


Bull Trap Trading Strategy Guide
Nasty stuff first.
Recall the times of buying a breakout.
Maybe you expected a bullish reversal in a downtrend.
Or, maybe it looked like the beginning of the new uptrend, as prices tried to get out of the range.
Whatever the case was, you’d often find yourself in a losing trade shortly after the long entry.
It felt like a trap, didn’t it?
It surely was – you got into a bull trap!
What is a bull trap in trading?
Contents in this article
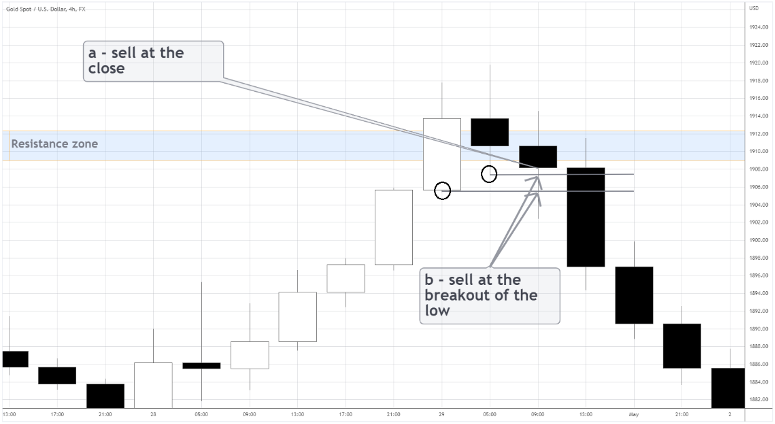
Breakout traders look for a resistance level that the price touched a few times.
Once the buyers push the market above the resistance, a potential breakout occurs.
At this point, breakout traders go long, usually setting their stop loss orders below the resistance level.
If the market lacks steam to stay above the resistance zone, the price dips under it.
That’s how one ends up in a bull trap.
Next, the decline triggers the buyers’ stop losses, adding fuel to the downward momentum.
To let the trap work for you, go short when the price returns below the resistance level.
Something like that:
Not everyone holding buy trade would be willing to recognize the trap or take losses quickly.
Some would close long positions only later, helping to sustain the move down.
You better stay on the right side of the market!
Read on to get to know the bull trap setup deeper.
What is a Bull Trap & How Do I Avoid It?
It’s not enough just to follow some shapes on the chart that might resemble a “trap.”
You should understand the reasons behind a bull trap.
Otherwise, you’re playing with fire.
You see, patterns are only useful when they make sense – pop up in the right context.
Suppose there are big reasons for the general market to fall.
And what if even it’s been going down for a while.
Any buyers would be going against the grain, putting themselves at a disadvantage.
When the buy trades are placed, but the market keeps grinding down, buyers would be forced to sell to mitigate further losses.
We look for those trap inflection points, where bulls capitulate, and we get in and capitalise.
On the contrary, if you look for long opportunities, but the market is bearish, you’re simply at the wrong place!
To avoid bull traps, you’ll need significantly stronger evidence of the market state change.
Until then, better wait and see.
Let’s dissect the bull trap criteria to finally put things in place.
Market conditions
The bull trap appears in trending and sideways markets.
However, the setup’s reliability generally varies depending on the market state it appears in.
Let’s look at the price action of each type of market.
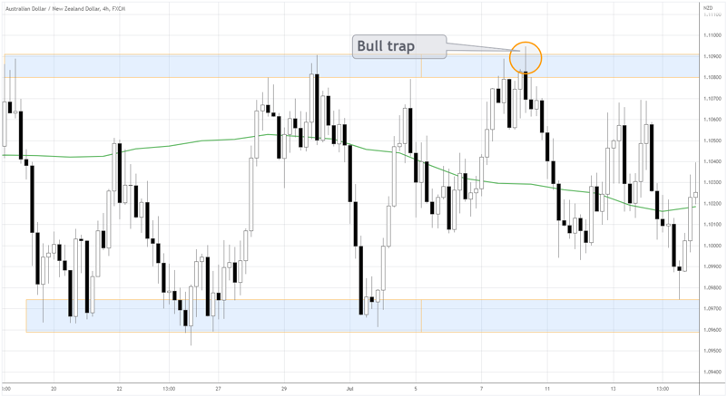
Downtrend
The best context for bull traps is a downtrend.
In a downtrend market, prices consistently make lower lows and lower highs.
Another straightforward way to identify a downtrend is a Moving Average.
If prices consistently stay below the MA, you see a downtrend.
Here’s an example.
Once a potential local resistance level was formed, some naive bulls would think the upward breakout would begin a reversal.
People are drawn to reversals for many reasons, including the satisfaction of being right and getting a “bargain” or buying “cheap.”
The truth is, there are real underlying reasons why the market has been declining for a while.
Many sellers queue to dump the asset – they love doing it at resistance zones.
What makes you think that today is the day to reverse the tendency that formed, say, for weeks?
Sideways
When there’s heightened uncertainty about the direction for a while, the market is sideways.
You can see the prices frequently crossing the Moving Average back and forth.
The price action in such a market tends to be erratic and capped within support and resistance zone.
Any spikes in either direction are likely to return to the mean – the middle of the range.
Check out the example below👇🏽
Here the idea is to bet against bullish breakouts.
The good thing is most of the time, markets are sideways, so there’s always a flow of opportunities.
Uptrend
Really?
Is it a trap for those who are actually right about the market’s direction?
Believe it or not, one can be right about the direction but still lose money.
How so?
Impatience and unrealistic expectations!
Let’s look at the bulls that managed to get trapped even in an uptrend.
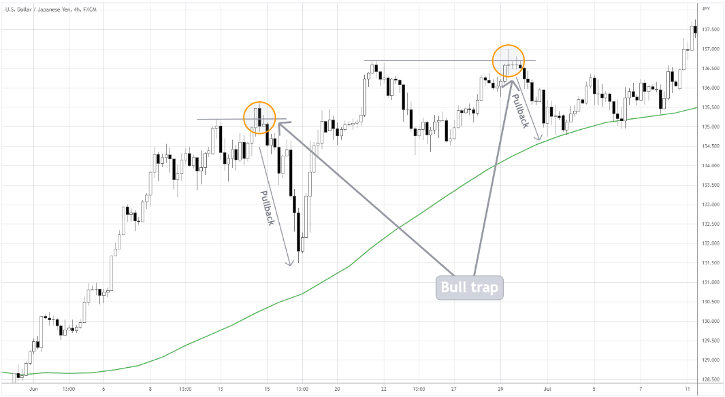
The problem of such buyers is trying to get in at the breakout after the short-term impulse has already happened.
Moreover, the tight stops stack more odds against such buy trades.
Massive profit taking of other short-term bulls causes the beginning of a pullback.
As late comers’ stops get triggered, the decline intensifies, providing us with another bull trap setup.
Essentially, in an uptrend, we hope to catch at least a meager pullback, not even a major correction or a reversal.
Trading a bull trap in uptrends is the most challenging and requires extensive experience.
If you mastered other basic price action setups but feel a particular calling to fade pullbacks, you may give it a try.
Alternatively, you can check out our Supply and Demand Advanced Trading Course HERE.

Sequence
Let’s look at the elements any bull trap setup consists of.
- The market state: (from most to the least favourable): downtrend, sideways, uptrend.
- Resistance zone: once you see at least one upswing, the high represents a potential supply area; the fewer times the supply zone is tested, the more likely prices will bounce down after the next retest.
- 3) Failed breakout price action: the market goes above the resistance level but quickly retreats below.
A failed breakout can be in the form of a single upper wick or a few candles.
4) Entry triggers:- Sell when a candle closes below the resistance level
- Sell at the breakout of the local micro lows
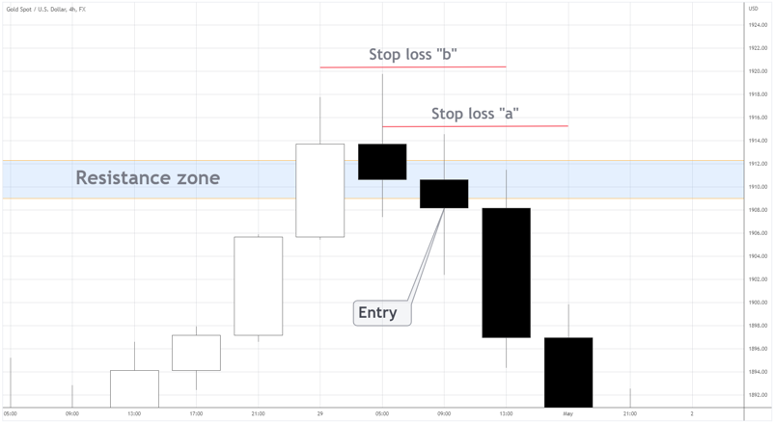
5) Invalidation points:- Stop loss above entry candle high
- Stop loss above swing high
Got it?
Regarding the targets, you can aim to take profits near the next support area.
The average risk/reward ratio may vary depending on a trader’s style.
However, to be safe, focus on attaining at least 1:2 R/R.
How to avoid a bull trap
No indicator or technique will 100% protect you from a bull trap.
Thus, always plan how to cut losses if the breakout fails.
There are ways to minimise ending up in a bull trap, though.
Here are the signs of a true breakout you should look for.
- The breakout is in the direction of a long-term trend
- At least two prior retests of the resistance zone
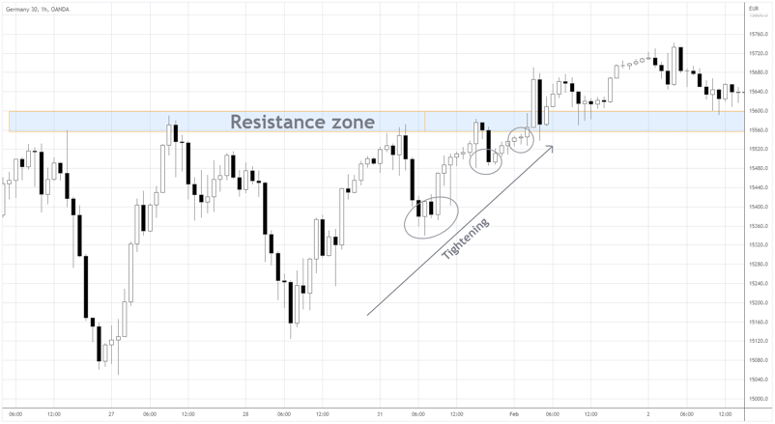
- The market “tightens” * to the resistance level prior to the breakout
- High volume comes out at the breakout
*Regarding the “tightening,” we don’t want to see the overextended market approaching the resistance level.
Many people would want to take profits if a significant move happened before the market touched the resistance zone.
In that case, keeping the prices above the resistance zone is harder, and the bull trap is more likely.
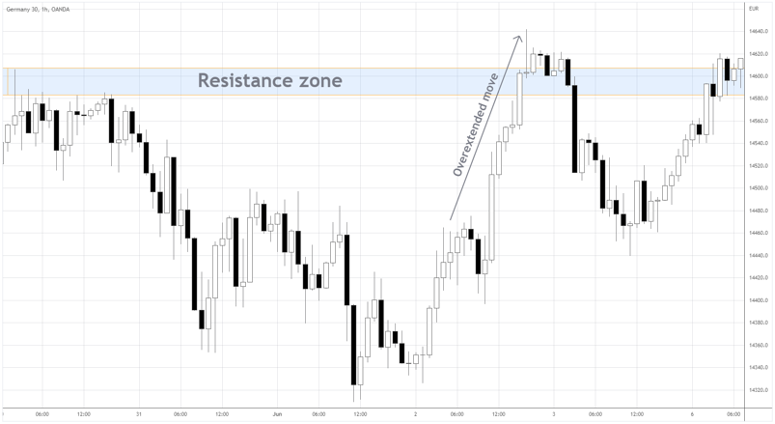
When the move is overextended, the prices come to the resistance level without significant pullbacks or pauses.
And this is what a tightening move looks like.
Here is the summary in the chart below.
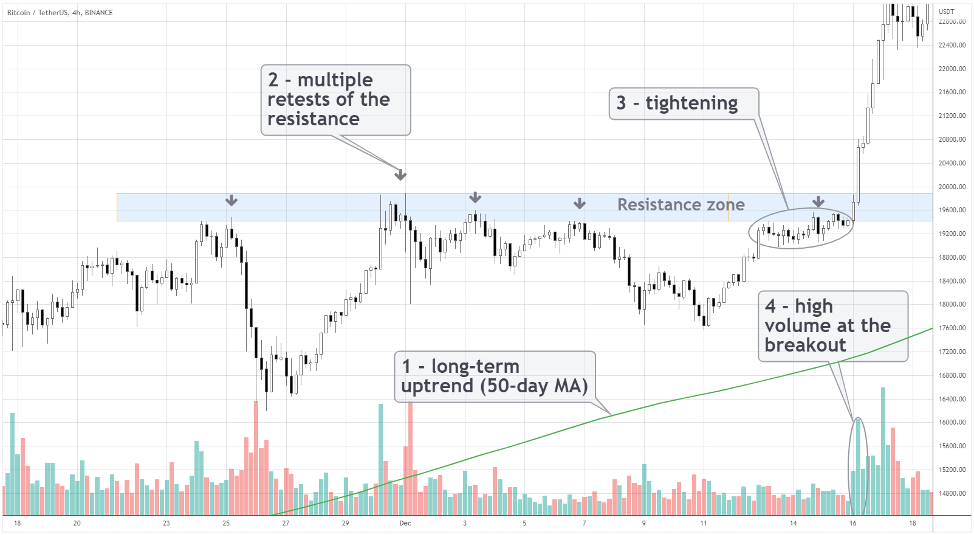
As you see, these are characteristics of successful breakouts.
Keep in mind, though, that roughly half of all breakouts fail.
How Can I Recognize a Likely Bull Trap?
The upcoming bull trap is an opposite of a solid breakout setup.
Let’s look at the price action traits of a likely failed breakout, aka a bull trap.
- The breakout doesn’t follow the long-term trend direction
- Only one test of the resistance level
- The overextended price action prior to the resistance level violation
- Low volume of the breakout
Keep in mind that when the price action is choppy in general, bull traps are common.
Look at such a beast below.
It’s tricky to trade in a market like this.
Ever thought of being trapped yourself while trading a bull trap?!
It happens all the time!
Next, we’ll look at the specific ways to trade bull traps and deal with various market environments.
The Common Bull Trap Patterns Examples
The EURUSD generated nice bull traps on the way to parity.
The chart below shows the euro staying primarily below the MA, so the long-term bias is bearish.
The grey arrows and horizontal lines highlight every resistance level that provides a short setup.
Look at each circled bull trap carefully.
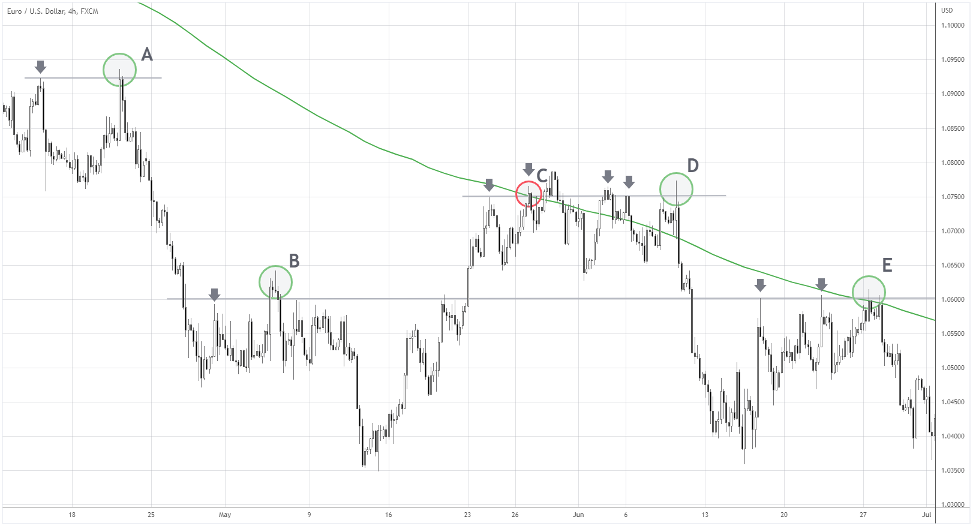
The setups A, D, and E provided almost immediate move in bear favor, with the entry being a point of no return.
The B setup would only provide a big R-multiple if you don’t move your stop until 1.05 is broken down.
If you short the euro at C, the loss is likely, unless you aim for a small risk/reward.
The point is the entry technique is not everything – you need a trade management plan that fits your goals.
Where is your target?
Do you trail stops?
Do you scale in/out?
How do you respond to the price action when the position is open?
These factors make a significant difference even if two traders male an identical entry.
A bigger risk/reward usually means a lower winning rate and vice-versa.
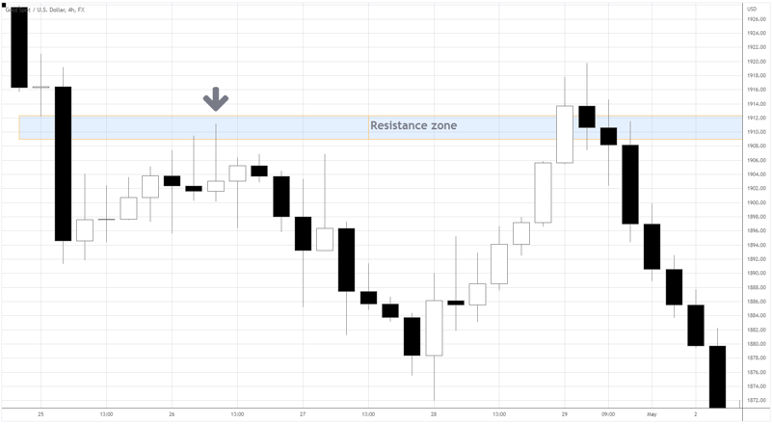
How to Trade Bull Traps?
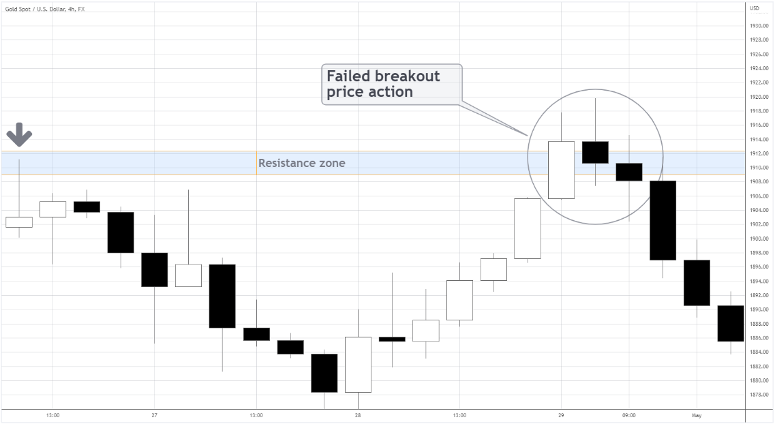
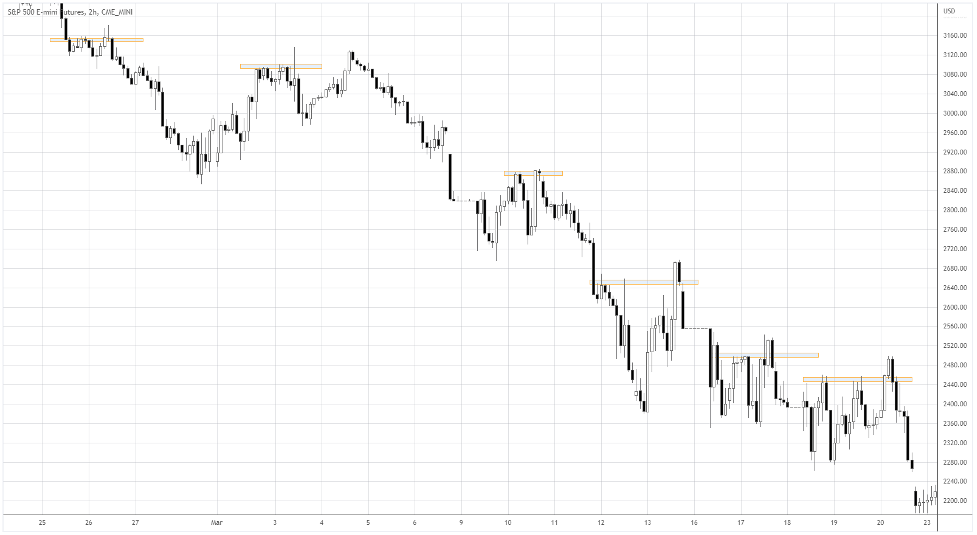
Let’s break down the bull trap formations in the S&P 500 example below.
The big picture is a downtrend, as the market is staying below the MA (green line).
The prices formed a resistance level at 4064.
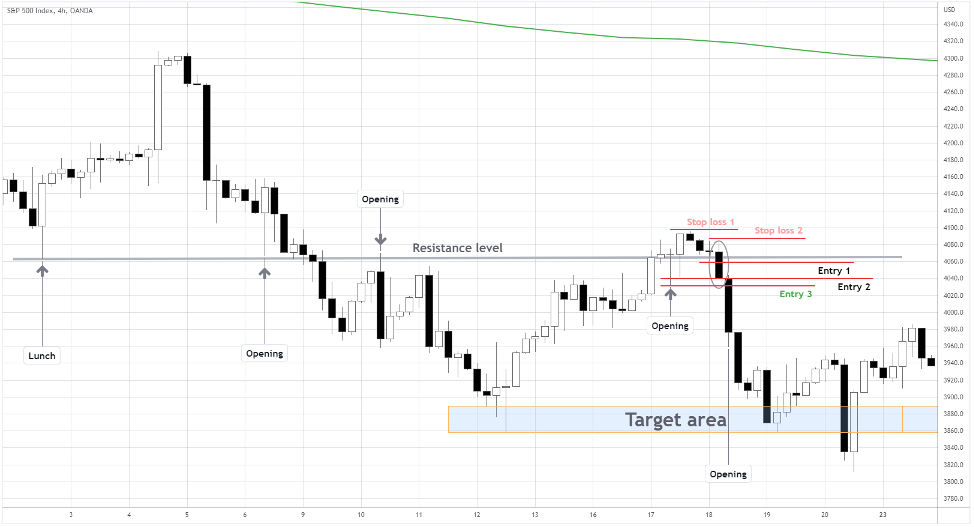
The fact that the resistance level was tested from above and below adds to its significance.
Also, notice that the market interacted with the zone during NYSE main session, primarily at the opening.
At the opening, the volume is usually the highest.
So, if the level can repetitively stop an impulse of the opening, the resistance zone contains big players.
Once we are sure about the setup conditions, we can plan the trade execution.
The red horizontal lines show potential entries and stop losses.
“Entry 3” is the most reliable one.
Why?
- We sell during the high-volume hours at the beginning of the session
- Breakout of the low made by the opening impulse on the previous day
The target area is a local low around 3880.
It would make sense to trail stops above the previous candle’s high as the market moved in your favour.
Bull traps and RSI
RSI-lovers would enjoy combining the indicator with bull traps.
When RSI is at 70, we should look for short setups.
That’s a nice tool to confirm the bull trap!
Here’s an example👇🏽
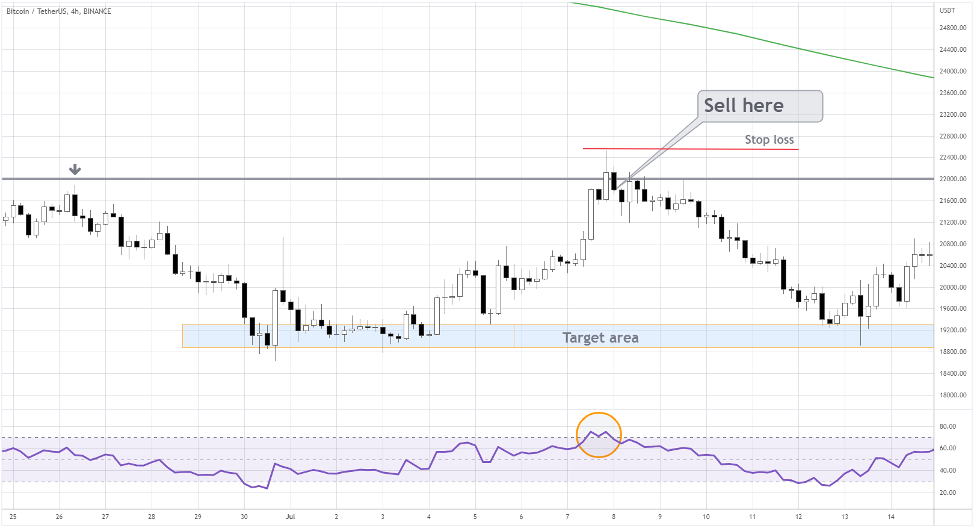
Bitcoin in the chart above was “overbought” when RSI went above 70.
At the same time, the resistance zone near 22000 wasn’t taken out, providing a short setup.
Ideally, consider selling once the RSI returns under 70.
Another way to use the RSI to confirm bull traps is divergence.
When the prices make the new high, buy the RSI shows the new low, divergence is in the house.
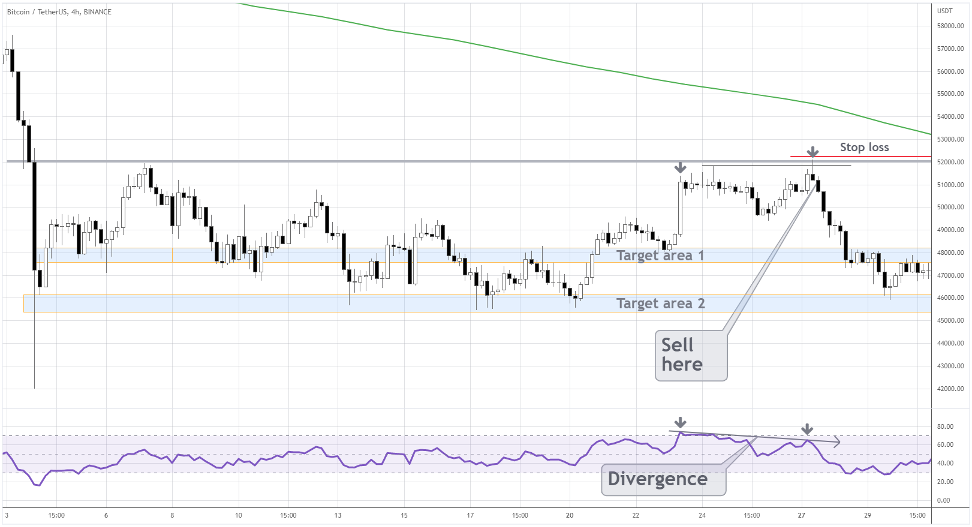
In the above’s Bitcoin example, the divergence added to the odds of a successful short-sell trade off the resistance zone around 52000.
Best Markets to Trade a Bull Trap
Novice traders tend to seek a once-fit-for-all method to profit from the markets.
The reality is that each type of market has its idiosyncrasies.
While you can find a bull trap setup in any market, the frequency of quality opportunities varies.
So, there are two ways how to go about it:
- Focus on the best setup filtering tactics
- Choose markets that gravitate to bull traps
Of course, it’s easier and faster to go with the number two.
Here’s a disclaimer.
It’s not all it is for traders to be consistently profitable.
You’ll still need to work on the selection skills.
Over time, experienced traders learn to filter setups and pick the most suitable market conditions.
One step at a time.
Now we’ll look closer at the markets that are the fittest for trading bull traps.
Forex
In contrast to equity markets, forex isn’t designed for growth.
If a currency pair is in a trend, one legal tender strengthens while another weakens.
Notice that the FX pair involves at least two countries’ economies.
It’s not just investors and an issuing company.
We’re talking about the entire societies that buy or sell currencies pursuing an insane number of uses.
Mind-boggling!
Think how crazier it gets with the euro – 27 EU member states are all trying to put their money to the best use!
Countries don’t necessarily benefit if the local currency gets stronger or weaker.
It all depends on economic conditions.
Thus, forex is quite a mean reversion market, in one timeframe or another.
That means the price action tends to give back prolonged moves.
The big picture shows something very different than stock indices.
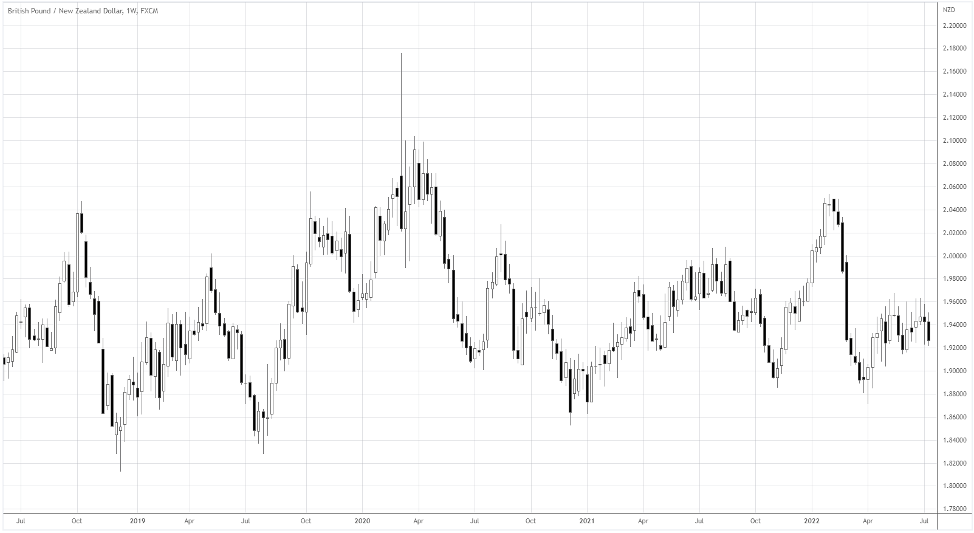
The market has been less directional through the years, especially currencies from the same risk sentiment camp (GBP and NZD are “risk currencies”).
There we go – a great playfield for trading all sorts of reversals, including bull and bear traps.
Trending, narrative-driven markets
Narratives make a buzz, driving digital content, politics, and financial markets.
The most powerful trends are driven by real-world events that aren’t too ambiguous.
For example, Covid-19 was a bad thing, a shock to the markets.
People started dumping stocks and loading up safe havens.
In this kind of environment, the buy trades are very dangerous.
There are always some bulls willing to try catching a falling knife, and bull trap traders are there to satisfy buyers’ wishes!
Look at those failed breakouts of one resistance level after another.
When you take another side of those buy trades, you have the avalanche of traders’ fear on your side.
That’s the edge!
When the trend and sentiment are clear, you can achieve a much higher winning rate.
Dead cryptos
People talk a lot about cryptos these days.
“To the moon” here, “to the moon” there, hodl, and so on.
However, try to open a chart of an average non-top-tier coin.
You’ll see a similar scenario everywhere: crazy mania shortly after the launch and ridiculous fall from glory afterward.
What happens next?
It’s a no man’s land!
Those coins just endlessly range or gradually decline as the public turns its back on the projects.
The same fate befell even the leading meme coins like Dogecoin.
Look at that daily chart!
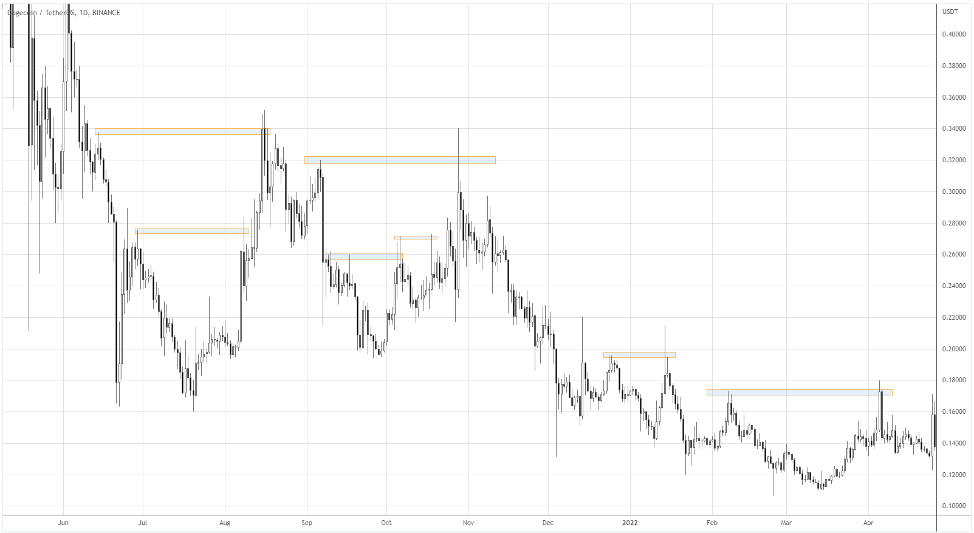
This is a dream for mean reversion traders!
Bull traps are very common in such choppy chaos, so dead cryptos are the right place to be in.
Just make sure the coin you’re watching is available to be borrowed for shorting.
Final words
A bull trap is a no-brainer setup that traders can find in virtually any market.
The simplicity of the pattern and the logic behind it makes it a powerful method for consistent profits.
Remember, you’re trying to ride the other traders’ stops!
We looked through specific market conditions and pattern variations of the bull trap.
So, you’re fully equipped to try it out!
Well, almost.
Like in most of the stuff you get on the internet, DYOR still applies here.
The solid theory is cool.
However, you’re unique, so for you, some variations of the setup will work better than others.
Try backtesting it first and get a feel of the mechanics and likely outcomes.
You need grounded confidence to trade this stuff successfully.
It’s your job to make the theory a natural extension of your individual trading style.
Happy trading,
Colibri Trader
P.S.
Have you checked my other article on the Bull Trap trading?
P.S.
Learn a time-tested Day Trading strategy using bull and bear traps to fine tune entries. Yes, this is the same strategy that recorded a winner trade of 1:40 risk:return.