


The Best Momentum Indicators and How To Profit With Them
Today will be all about best momentum indicators.
Markets are never static; they go through various phases, presenting unique trading opportunities.
When price change accelerates in a specific direction, we say the momentum is GROWING 🚀.
Some trading techniques and tools focus specifically on gauging the speed of the change to💰profit from the market.
For those unfamiliar with momentum trading, consider the strengths and drawbacks of the approach.
Here we go.
Contents in this article
Pros and Cons of Using Some of the Best Momentum Indicators
Before further ado, let’s just dive straight into those points.
And here they are:
Pros
- 1) The point of no-return: Usually, the entry is meant to be the price the market isn’t supposed to return to and aggressively retest.
- 2) Immediate feedback: Once you get in, it doesn’t take long to determine if the trade works out.
You either see 🤑profits very soon or get stopped out 🛑
- 3) The relative ease of stop-trailing: As we don’t expect significant corrections and whipsaws, the stop-trailing tactics are often simple – such as hiding stops below/above the last candle’s extremum.
- 4) Shorter time of reaching the target: We look for🏎 fast, powerful moves to join; thus, the market shouldn’t take long to hit the target.
Cons
- 1) Frequent stop-outs: In general, momentum traders use tighter stop losses
You’re likely to be shaken out of the market if the volatility is slightly abnormal and not in your favour.
- 2) Limited move potential: The market doesn’t accelerate forever – once momentum cools off, the correction starts, triggering your trailing stops.
UNLIKE 📊 trend-followers, momentum traders don’t aim to ride the entire trend.
The trend may continue when the correction finishes, often without momentum traders onboard.
Hopefully, you got the BIG PICTURE of what to expect utilising the tools we’ll talk about next.
Let’s look at some of the best momentum indicators to find 🤑 high quality setups.
How are best momentum indicators different?
Momentum indicators are typically mathematical formulas that process prices and return certain derived values.
Then, we get the graphical representation of the results – all those fancy lines and other stuff in the chart window.
Such as the ones shown below 👇🏽
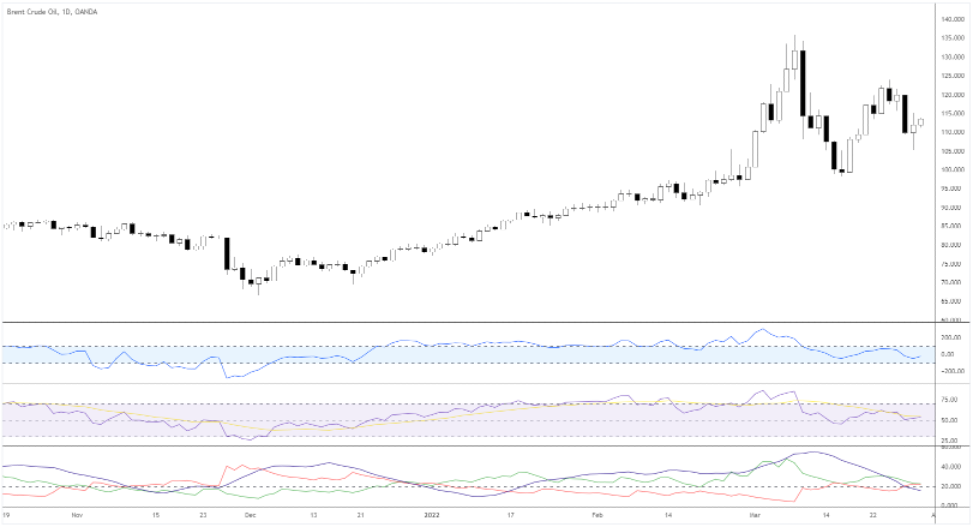
Most of the best momentum indicators can be categorised by how they’re calculated.
We’ll look at the THREE BROAD GROUPS of best momentum indicators that traders use the most.
Also, we’ll consider an ALTERNATIVE🤓 way to get insight into the momentum without using any formulas.
Best momentum indicators: last close vs. the previous close
These indicators aim to be LEADING📉– providing signals corresponding to possible future price movements.
The objective here is to measure the “speed” of the market relative to the last close.

If the moving speed is unsustainable for a while, such indicators label the market as “overbought.”
Conversely, when the prices abnormally fall, the best momentum indicators give the “oversold” signal.
The best momentum indicators from this group work well when markets are ranging.
Why🤨?
The sideways market consists of many similar up-and-down swings; the indicator helps recognise those similarities and exploit them.
RSI, Stochastic, and ROS are good examples of such tools; many indicators from this group are often called oscillators.
Best momentum indicators: last close vs. range
Here indicators analyze where the market is compared to the range in the past.
How exactly🤔?
We’ll be able to see how STRONGER or weaker the market is, removing extra noise produced by the signals of leading indicators.
Later on, we’ll look in detail at the Commodity Channel Index (CCI), representing this group of momentum tools.
Best momentum indicators: last close vs. Moving Average
Trend-followers mainly use indicators of this type.
Thus, such tools are LAGGING🐢 in nature as they measure the current price against averages of the past period.
How exactly?
An asset’s “normal” PRICE ACTION in the past can be quite in contrast to what’s happening now.
That’s why trend-following indicators can be helpful to spot that contrast – The Average Directional Index (ADX) is a perfect example.
Other best momentum indicators
We don’t necessarily have to look at the 🧙🏼♂️processed formulas market data to gauge momentum.
With enough observations and practice, it’s beneficial to analyse the raw price action.
There’s a good reason for it.
One of the most significant benefits of such an approach is the actuality of ANALYSED INFORMATION.
Nothing can be timelier than making trading decisions based on what’s happening now.

Unlike mathematical formulas, a trained eye can see how exactly the market came to, say, overbought conditions.
We’ll check a couple of ways to analyse bare📉price action to understand what’s happening with the momentum.
Relative Strength Index (RSI)
Meet the MOST COMMON among best momentum indicators, the RSI.
The popularity of the indicator is due to its SIMPLICITY of use in various market conditions.
Although, primarily, traders employ RSI during range markets.
The calculation of the tool isn’t rocket science 🚀
We find RSI in THREE steps:
- Calculate the average of higher closes and the average of lower closing prices for a selected period.
- Divide the average of higher closes by the one of lower closes.
- Invert the result to get the 0-100 oscillator value.
The 70% and 30% LEVELS are considered overbought and oversold, respectively.
There are TWO kinds of RSI signals
- Overbought/oversold condition: when the market is overbought, we should look for a short-sell setup and vice-versa for oversold.
- Divergences: we get a sell trigger when the prices make a new high, but RSI shows a lower one.
The opposite goes for long trades.
Working examples
In the Gold chart below👇🏽, the areas of the RSI above 70 and below 30 are marked with orange circles.
Notice how each period of EXTREME readings in RSI leads to a reversal in price.
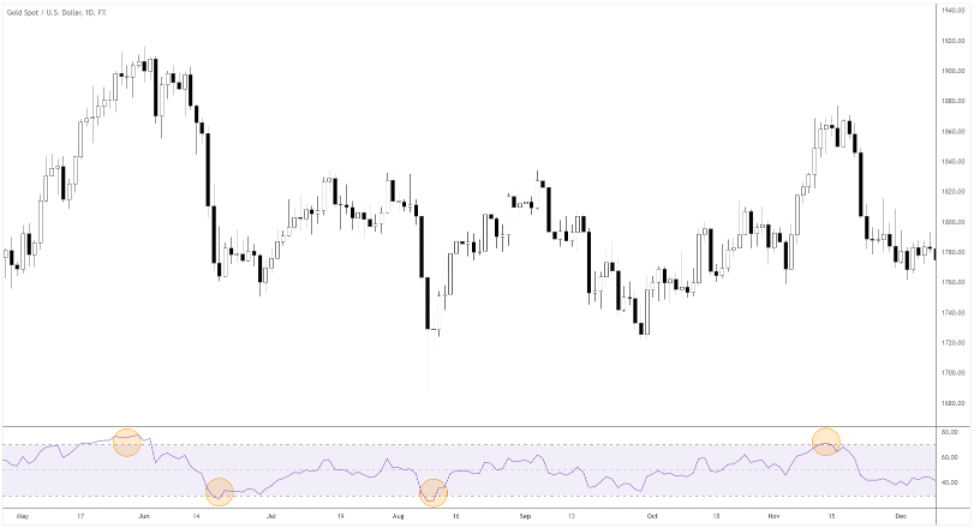
The challenge here is defining the exact entry trigger 😤
Any ideas?
For example, some traders would sell once overbought RSI downticks.
Others would wait until it gets back below 70.
It is really a personal choice based on the 🤔 back-testing results.
Commodity Channel Index (CCI)
The index was initially used for LONG-TERM trading trends in commodities.
However, today CCI is popular in any market.
The indicator compares the “typical” price (the average of High, Low, and Close) with the MA.
Also, the mean deviation element in the formula ensures that 70% to 80% of values are within the -100 and +100 range.
So, if the indicator goes beyond the typical range, we see an IMPROBABLE event 🤔
The markets tend to 🌀RETURN TO THE MEAN, so we should open positions toward the “normal” while the market is out-of-normal.
Makes sense?
The further we get in from the mean, the better from a risk-reward perspective.
CCI aims to find that exact spot for us.
Here are the CCI signals:
- The market goes beyond 100/-100 and returns back – potential dip-entry signal in a trend.
- When the prices stay within boundaries, the market is in the range.
Next, let’s look at the practical uses of the indicator.
Working examples
Suppose we identified that Microsoft is in an uptrend.
In that case, CCI will help us to BUY THE DIP.
The vertical lines in the image below showed possible long entries when CCI got above -100.
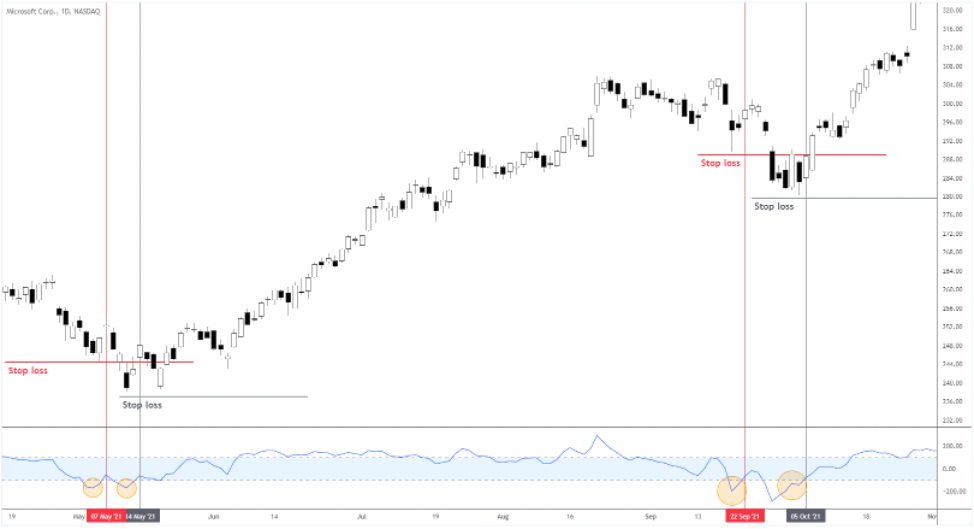
Suppose we set the stop loss below the local low and buy at the close of the trigger day.
Following such a tactic, we’d get losses on May 7 and September 22 (red lines).
Stay cool, though 😎
On the bright side, each second entry after the loss (black lines) would likely result in profits.
Average Directional Index (ADX)
Here is another invention of the author of RSI, Welles Wilder.
Among the previous indicators’ calculations, ADX has the most extensive one.
Without getting too deep into calculations, let’s break down the structure of the indicator with a brief description of each part.
ADX consists of two sub-indicators, -DI and +DI, forming the final ADX value.
The Directional Indicators (+-DI) are found by comparing using ATR of current highs with previous highs (thus +DI); the same goes for lows.
The ADX is the average of +DI/-DI
ADX is a unique indicator in the sense that its main function doesn’t include providing 📶 entry signals.
What does it do then?
The tool primarily does THREE things👇🏽
- Identifies the market state – trend or range
- Quantifies the strength of the trend
- Shows if the trend is getting stronger or weaker – momentum tendencies
When the ADX is above 20, we consider the market a trend.
To see the MOMENTUM CHANGE in a trend, we look at the consistency of ADX growth when above 20.
Working examples
Let’s see how moody Bitcoin is doing by plotting the ADX on it.
The dark green area was the time of strengthening momentum as ADX (the blue line) grew.
The momentum in the trend of the light green area was getting weaker; the declining ADX confirmed that.
Here’s the market state BREAKDOWN👇🏽
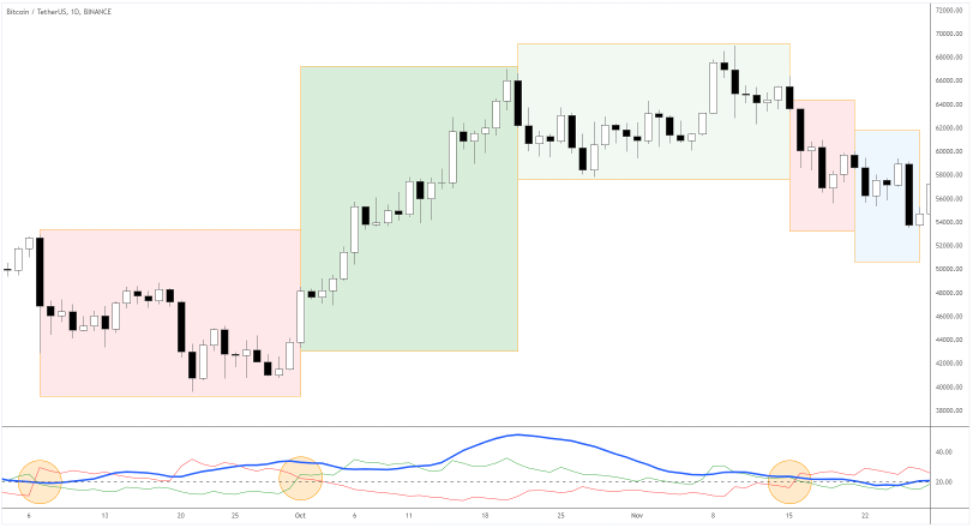
Note that we consider the change in market state in two cases:
- -DI and +DI cross while ADX is above 20: possible change of trend direction
- ADX goes below 20.0: the market becomes sideways
The yellow circles in the indicator window show👆🏽the market state shifts in the example above.
Price action as the best momentum indicator: candles shapes
Proper interpretation of price action is a valuable skill.
While technical indicators are helpful for market state and setup confirmations, price action gives you the TIMELIEST⏱ market feedback.
What should interest us in price behavior concerning momentum?
Let’s find out!
Parabolic advances and euphoria
Traders can take advantage of market bubbles💭 and euphoria by entering the initial momentum burst.
Usually, it looks like an abnormal-sized candle momentum launch.
The 🐕 DOGECOIN craze provides a vivid example 👇🏽
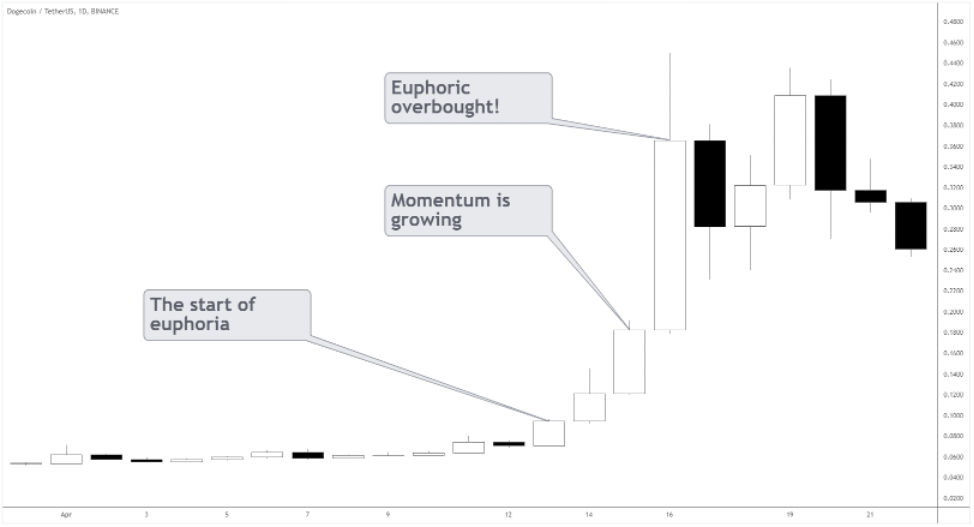
The evidence of GROWING🚀 momentum can be drawn from the increasing size of the subsequent candles, often exponentially.
You’d better buckle up!
Finally, the overbought state in a euphoric market comes with the mother of all previous candles.
The best setups are in the direction of the trend.
The overbought candle is better for 🤑PROFIT-TAKING only – shorting such a market is very tricky!
Losing steam market
If you see consequent full-body candles, the momentum is growing – this is the right environment to follow the trend.
Here’s an example 👇🏽
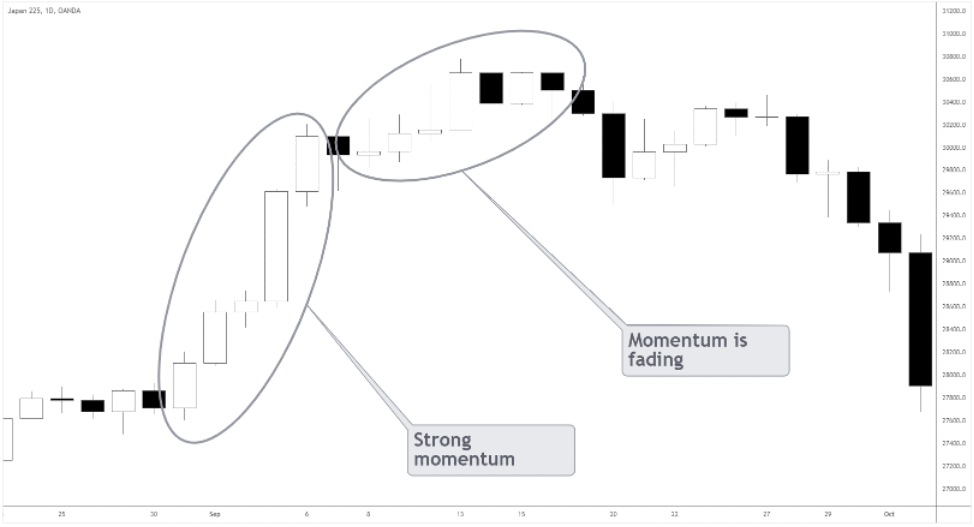
When the candles get consistently smaller after a strong momentum, we can conclude that the momentum is FADING💨.
As the Japanese index loses momentum, a potential short-sell opportunity may be around the corner.
Summing Up The Best Momentum Indicators
When it comes to using the best momentum indicators, it is hard to just generalise.
You need to take a few important factors first:
- General trend
- Trading strategy in use
- Trading preferences
It is usually much easier to test a few different indicators from the list above and see which ones are giving you the best results.
Trading is more art than science, and this could not be more true when it comes to selecting the best momentum indicators for your trading.
With that on mind, you will need to remember one thing 👇🏽

Anything else should be secondary.
With these thoughts on mind, I wish you happy trading.
See you in the next article!
Atanas
P.S.
Did you check my recent article on The Best Swing Trading Indicators and Wy So Many Traders Don’t Know How to Properly Use Them?