


USDJPY Trading Analysis 11.04.2022
Dear traders,
Last time I wrote about Gold.
After a protracted stretch of range-trading, gold has finally started to inch higher⬆️.
Here is a screenshot of the daily chart 👇🏽
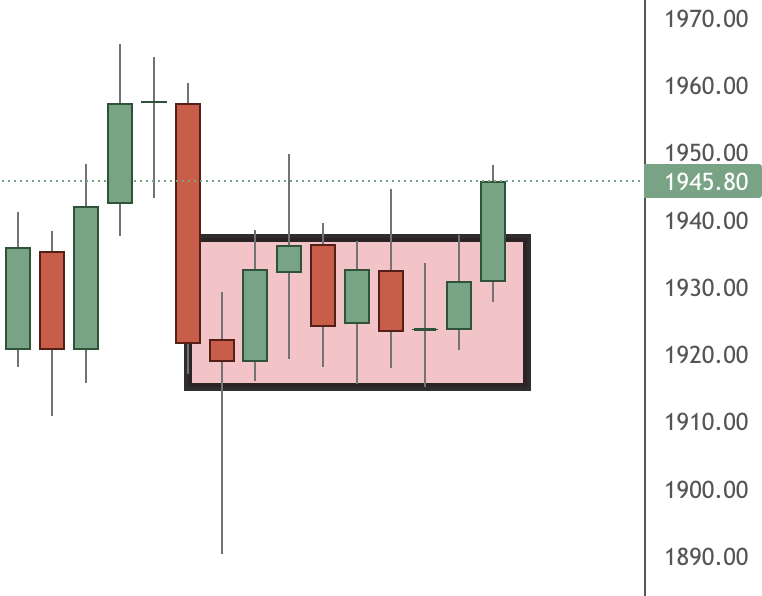
As you can see, the price action has been very monotonous.
What do I mean?
Well, price has not moved above or below the range (Red Box).
Now, I am currently starting to see some momentum.
The question is how long will it last?
Traders need to be careful with the 1950 area. This could lead to some surprises BOTH bullish OR bearish.
I still believe that we are in the beginning of a new bull cycle.
Remember the SILVER article here?
I need to see a bit more confirmation from the daily timeframe, but so far things are still rosy for the bulls.
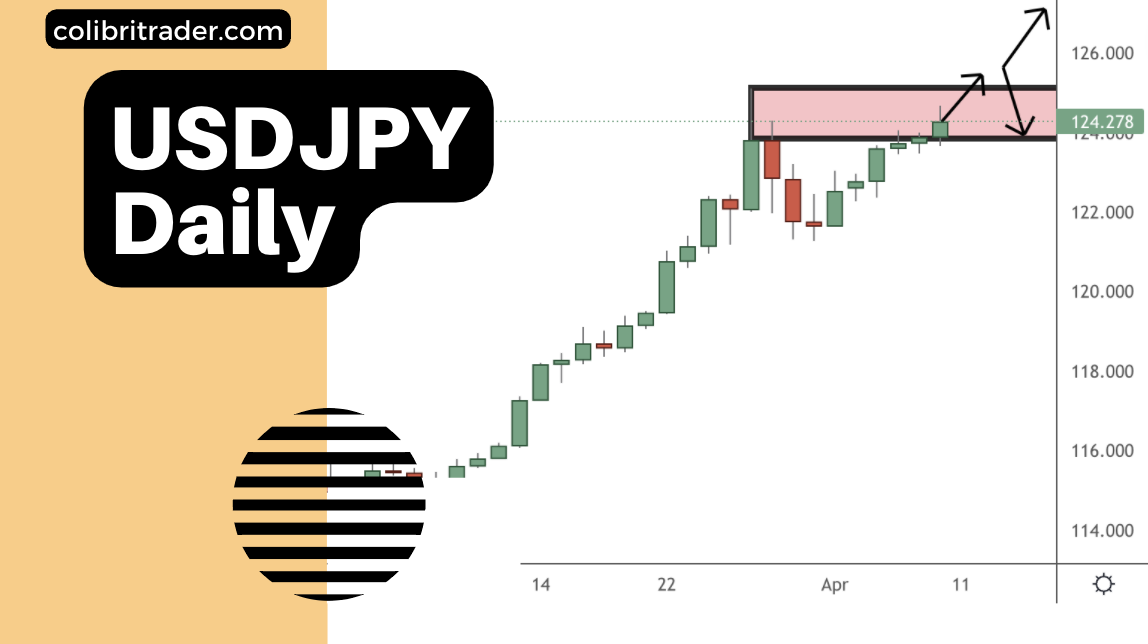
USDJPY Trading Analysis 11.04.2022
Today, I will be also talking about USDJPY.
After a stellar run, this par looks to be ready for a 🥱BREAK.
Price has retested the 125.00 area for a couple of times.
Apart from being a strong PSYCHOLOGICAL barrier, it is also a major zone a supply.
What else am I waiting for? This sounds to be the perfect short.
Well, I need to see more price action confirmation before jumping into any sort of trading conclusions.
I would ideally like to see an INVERTED PINAR or a BEARISH ENGULFING to gain more bearish confidence.
Before that happens, I will be patiently⏳WAITING.
Here is an example of an ideal scenario 👇🏽
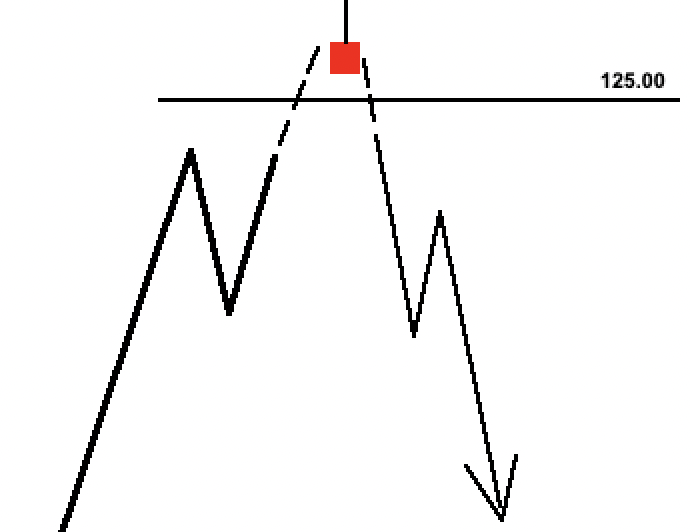
It is apparently a hypothetical scenario, but you get the idea of what I am looking to see on the Daily timeframe.
Until then:
Happy trading,
Atanas (a.k.a. Colibri Trader)
P.S.
Did you you know that you could be🧙🏼♂️Profiting In Bear and Bull Markets with Those Momentum Indicators?