


Three White Soldiers – 5 Untold Secrets

Today will be all about the Three White Soldiers.
But before that, let me ask you how much do you know about candlestick patterns?
Such setups can be powerful (despite being strikingly simple) if you use them properly.
There’s a problem, though.
Novice traders tend to see candle formations where there’s none – all in pursuit to see what they want to see. As a result, it’s extremely easy for unscrupulous “coaches” to claim that something works by merely cherry-picking occurrences from the price history.
Such a gloomy beginning, you’d say.
This article aims to stress the significance of often neglected yet critical factors in the candlestick setup. Furthermore, we’re going to talk about one of the rarest formations – Three White Soldiers.
Due to traders’ lack of exposure to the pattern, the ins and outs are difficult to learn, so frequent mistakes are common.
But, no worries, we’ve got you covered below.
Contents in this article
- Japanese candlesticks basics
- Three White Soldiers pattern structure
- Section #1: Classic and adapted version of the Three White Soldiers
- Section #2: The proper market context for the Three White Soldiers
- Section #3: Find a suspect in the Three White Soldiers
- Section #4: What to expect right after the Three White Soldiers formed
- Section #5: The risk-reward tradeoff and the truth of profitability
- Key stats
- Three White Soldiers Sum Up
Japanese candlesticks basics
If you’re not familiar with candlesticks and patterns they may form, let’s quickly go over the basics.
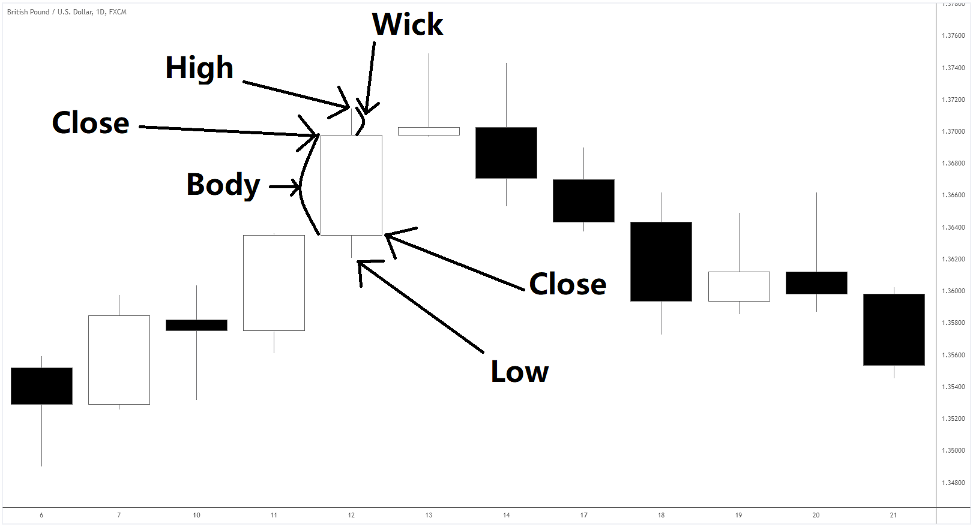
A candlestick chart is a way to represent price fluctuations of a certain period (timeframe).
For example, if we use a daily timeframe, each candle gives a generalised view of how the market behaved within a day. Such a view is expressed through four data points: Open, Close, High, and Low.
What do they mean?
- Open – the price of the first transaction of the day
- Close – the final trade’s price of the day
- High– the day’s highest price of the day
- Low – the day’s lowest price
If we use another timeframe, the four points will pertain accordingly.
As the market fluctuates, candles will have different properties: various body and wick sizes.
Look at the example below.
Setups contain several candles with certain shapes.
It’s time to see what’s the Three White Soldiers pattern like.
Three White Soldiers pattern structure
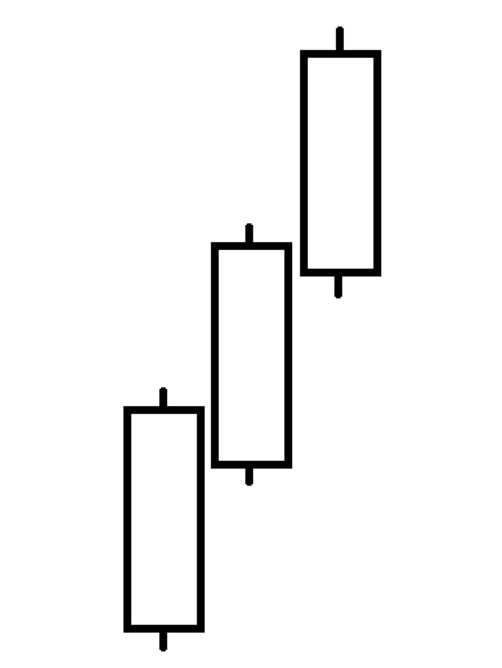
The pattern shows up after a sustained downtrend, suggesting a reversal.
The three bullish big body candles form the setup, with each candle opening within the body of the previous one.
Hard to visualise? – Here’s a simplistic illustration.
Too perfect to be true?
Indeed, not only it’s rare to find the Three White Soldiers, but it’s even more challenging to spot its classic form!
Next, we’ll delve into five pattern intricacies that are often neglected.
1. Classic and adapted version of the Three White Soldiers
What makes the pattern tricky?
One of the most noticeable features is the opening of each candle.
If a candle’s open is below the previous one’s close, the gap occurs.
The classic pattern has at least two gap-ups straight.
Such frequent gaps happen on a daily scale in centralized markets like stocks and futures.
Why?
The exchange forms the first and the last prices of a trading session based on accumulated pending orders.
Hence, when the supply and demand imbalance is significant, gaps happen.
What does it mean practically?
In markets that operate without closing, the Three White Soldiers setup won’t have meaningful gaps.
For example, Forex trading stops only on weekends, and cryptocurrencies are traded 24/7.
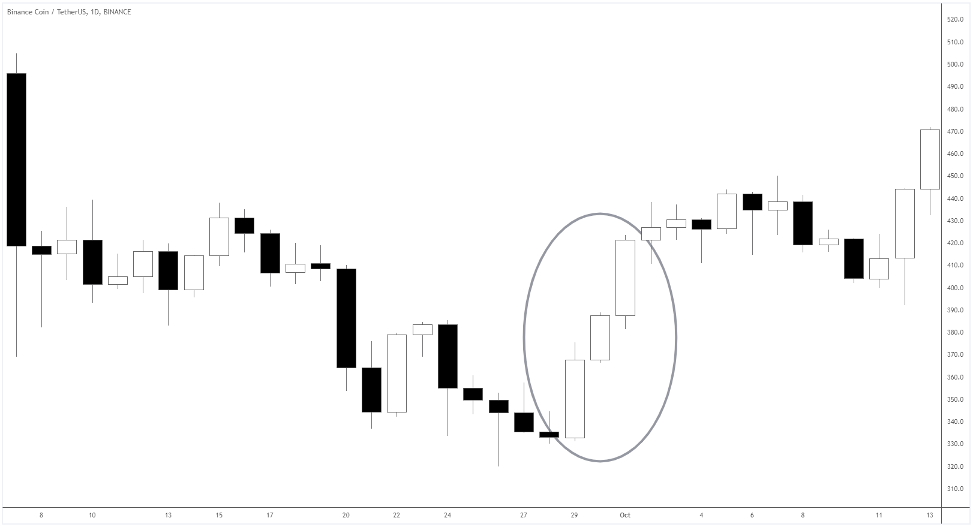
Look at those circled Three White Soldiers in the Binance coin chart above!
2. The proper market context for the Three White Soldiers
One of the frequent mistakes novice traders make when looking for the pattern is disregarding the market environment.
The Three White Soldiers pattern aims to identify a reversal of an established downtrend.
Too often, people use the setup to catch a reversal, say, of an impulse in a sideways market.
To see how strong the tendency is, look at how long the downtrend has lasted.
If you’re working with a daily timeframe, a downtrend should be going on for at least several weeks.
Second, be clear about the basics of a trend structure: a downtrend will have lower highs (LH) and lower lows (LL).
Here’s an example.
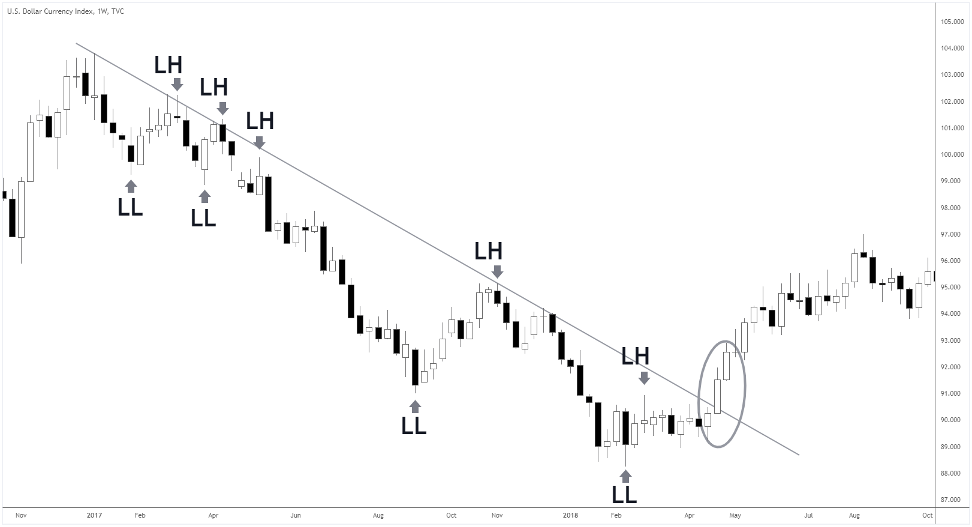
You can plot a trendline in an established downtrend, connecting the most obvious lower highs (LH).
When a candle closes above the trendline, it’s the first sign of a trend reversal. It’s helpful to combine the Three White Soldiers with a trendline breakout (see an oval in the image above).
3. Find a suspect in the Three White Soldiers
There can be warning signs in the shape of the three candles comprising the pattern.
What are they?
Be careful if you see long upper wicks or a small body in some of the formation’s candles.
The inability to form a big body and close near highs shows high selling pressure.
In the Silver chart below, the Three White Soldiers setup suggests buyers aren’t powerful enough to reverse a downtrend.
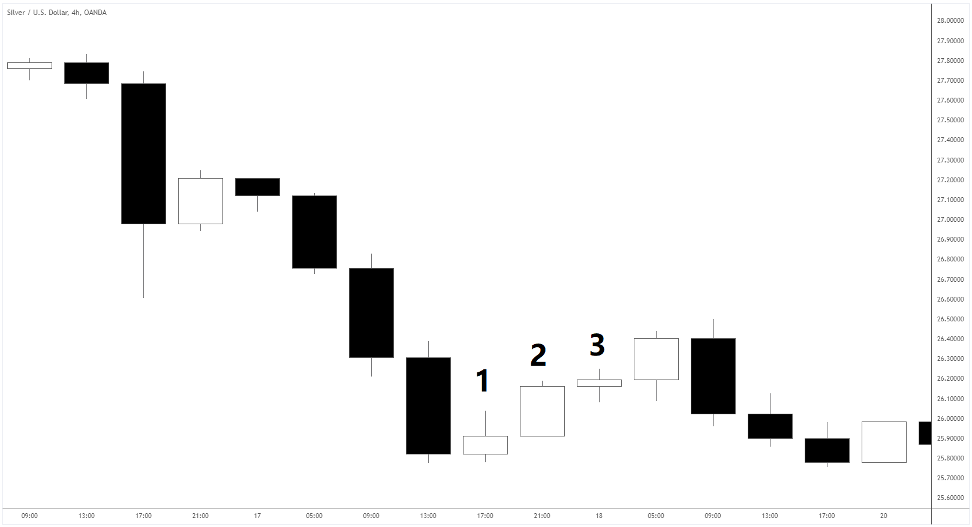
The candle “1” has a long upper wick, and the candle “3” body is too small.
Only “2” is a qualified White Soldier! As you see, although after the candle “3,” the market moved up for another four hours, the rally didn’t last.
4. What to expect right after the Three White Soldiers formed
The Three White Soldier pattern is not a momentum setup.
So, you’re not likely to see the market moving in your direction soon, like in triangles or rectangles breakouts. Instead, as the prices already traveled upwards for three candles straight, some short-term bulls may want to cash in.
As buyers take profits, the market pulls back or consolidates.
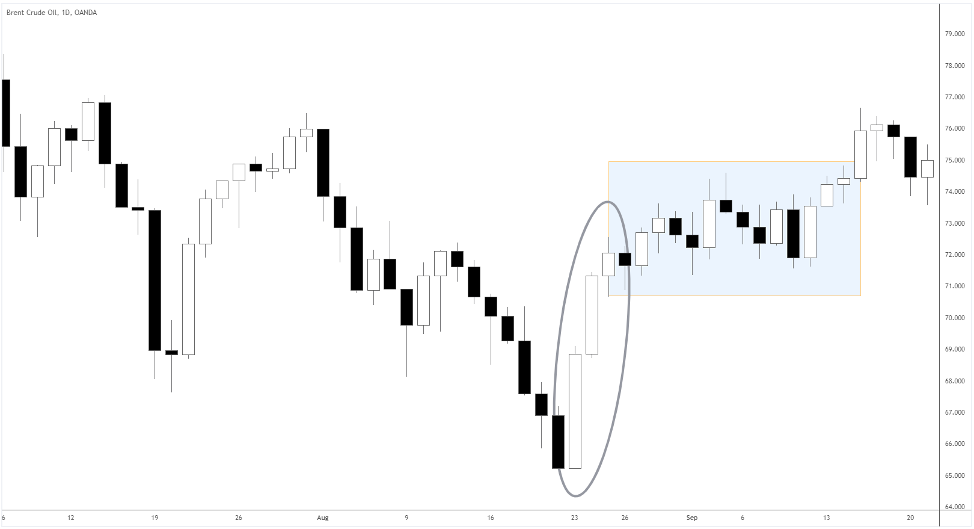
In the Brent Crude Oil chart below, the market went sideways (see the blue area) after the Three White Soldiers.
Momentum indicators such as RSI and Stochastic would often show overbought conditions on the lower time frame.
You can also utilise consolidation to find the no-return entry point. As a result, you will mitigate significant pullbacks afterward.
Avoid that pain!
For example, you may buy after the market pierces the bottom boundary of the range and swiftly recovers. This is another way is to buy at the consolidation’s upper border breakout.
5. The risk-reward tradeoff and the truth of profitability
You probably noticed that the Three White Soldiers isn’t so “compact”. In fact, it takes a large up-swing to form the setup.
Any problems with that?
It’s critical to identify the invalidation point in any formation.
If the market reaches that price, we can consider the trading idea didn’t work out.
In that case, it’s critical to cut the loss by exiting the trade.
The classic spot to put a stop-loss in the Three White soldiers is below the first candle’s low.
We must aim for over 1:2 Risk/Reward to profit in the long run, justifying our entry.
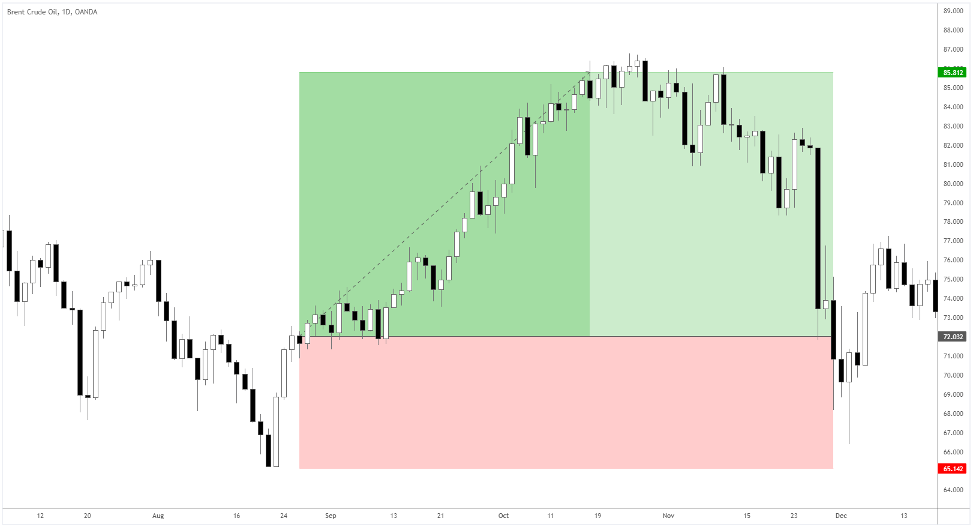
The red area is the risk in the Brent example above. The green area shows a potential for a 2R return.
The risk-reward tradeoff
Suppose you trade assets like forex or commodities using the Three White Soldiers formation on a daily timeframe.
Based on such a pattern, the move over two risks in traditional assets is a big deal and doesn’t happen often.
The fact that you need to set your stop-loss that far diminishes the odds of hitting a reasonable target!
Makes sense?
Some of the solutions to the potential profit issue are listed below.
- Trade extremely volatile assets: cryptocurrencies and stocks tend to go higher than anyone would expect, so you may consider them.
- Use multiple timeframes: look for the pattern on the lower timeframe but set a target on the higher one.
- Employ shorter stops: you can set protective stops below the third or the second candle, sacrificing the hit rate, though.
Do not rely on the rigid textbook rules of the Three White Soldiers pattern execution. In conclusion, it’s critical to be flexible enough and find the tactics that work for you in the long run.
Key stats
Considering key statistical data, let’s look at the big picture of the Three White Soldiers’ performance.
Numerous websites have already conducted extensive research on the pattern’s occurrence and success rate.
Here’s the brief.
- Three White Soldiers appear every 2888 candles (based on 4120 markets and 59 years of price data)
- The market reached two risks target in 33.3% occurrences.
- Longest winning and losing streaks were 8 and 22, respectively.
- Without considering fees, the mathematical expectation is -0.001$, as if every time you risk 100$, you lose $0.1 on average.
As you can see, it’s not advisable to base your trading system on the Three White Soldiers only.
Three White Soldiers Sum Up
We looked at a classic Japanese candlestick pattern that serves as a reversal signal in a downtrend.
Firstly, before peering into particular candles, make sure it makes sense to look at that chart at all –there must be a downtrend! You will most likely find the adapted version of the Three White Soldiers, which doesn’t have gaps.
Secondly, keep in mind that seemingly minor details like the size of the candle’s body and wick’s length affect the setup quality.
Finally, consider price action shortly after the pattern occurs.
Consequently, this is where the market may dance around for a while before taking off.
If you trade the classic pattern in a “normal” way, you’ll end up in red!
Is that what you want?
Not really!
Therefore, take heart, be creative devising your trade management system, and back it all up with the statistical edge.
Happy Trading,
Colibri Trader
P.S.
Did you read my guide on How to Make Money Trading With Pin Bars?