


The Pin Bar Candlestick Trading Guide
***GET THE CANDLESTICKS TRADING PDF EBOOK***
What is it about the pin bar candlestick that everyone is talking about?
There is a universe of potential signals that traders can use to time their entries.
The price action offers various setups that provide a favorable risk-reward win rate and are straightforward to execute.
The pin bar is among the most famous formations you can utilize in various market contexts.
In this article, we’ll look in detail at what the pin bar candlestick is and the no-brainer ways to employ it.
Let’s get to it!
Contents in this article
What is a candlestick in charting?
Before we dig into the intricacies of the pin bar, let’s learn about the structure of the Japanese candlestick.
The candlestick chart shows price fluctuations distinctively.
The candle represents the price movements within a specific period, depending on the timeframe you’ve chosen to use.
If you use daily charts, each candle portrays how the market moved on that day.
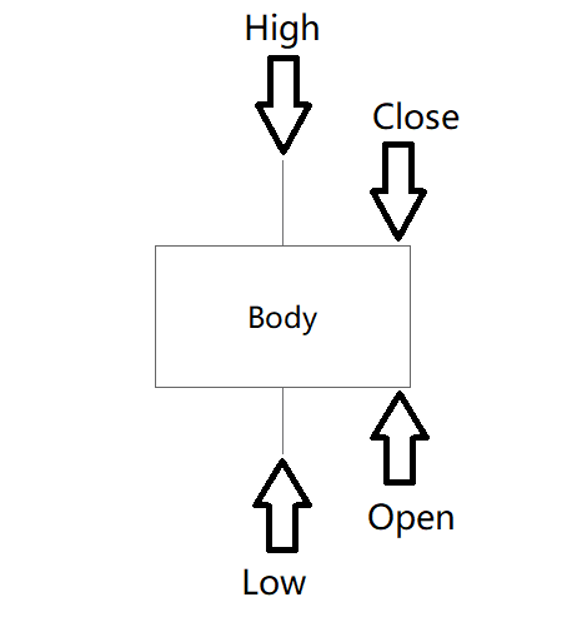
Each candle has four parts:
1) open
2) close
3) high
4) low (see the illustration above).
Let’s look into each part of the daily candle in the list below:
- Open: the first price at which participants made a transaction on a given day
- Close: the last price of the day that somebody sold at; it’s usually considered as the most important one
- High: The highest price of the day
- Low: The lowest price of the day
If a candle closes above its opening, the body’s colour turns white.
In case the close is lower than the open, the body is black.
The candle structure is essential for further understanding the setup.
Makes sense?
Here is a short video on Candlesticks taken from the Smart Money Course.
What are candlestick setups?
The forces of supply and demand make the prices fluctuate, forming the candlesticks of different shapes.
When the properties of the candle’s elements match specific criteria, we get a potential trading setup.
In the illustration below, you can see candlesticks of different shapes, where each candle gives various clues about where the market may head next.
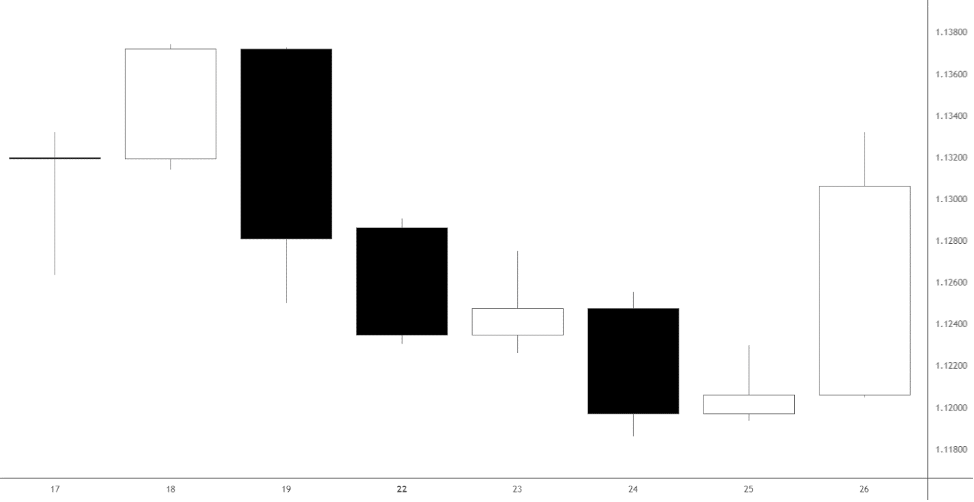
Some patterns require more than one candlestick to form.
The pin bar candlestick consists of only one candle.
Thus, it’s easy to spot, and the market forms it frequently.
Understanding the pin bar
When the market declines and the buyers suddenly step in, causing a sharp surge, the pin bar candlestick forms.
Several patterns match this description.
However, the feature of the pin bar is usually the fastest speed of growth.
The drop and surge happen within only one candle, emphasizing the aggressive purchases.
Let’s see an example.
Below is the pin bar candlestick; look carefully at the candle’s unique structure.
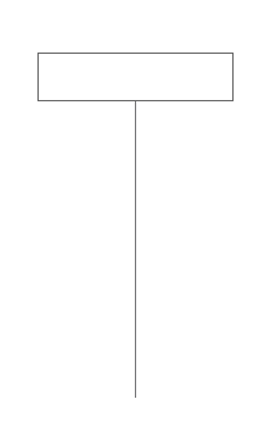
The wick is the difference between open or close and low or high.
The main properties of the bullish formation are a long down-wick and a small or absent upper wick.
Conversely, the bearish setup would have a long upper wick and a short or absent down wick.
Pro tip: The most robust bullish formation has a white body, while the most reliable bearish setup has a black body.
The pin bar under the magnifying glass
When we look at any long wick, it should scream to us that the market was moving fast through those prices.
If somebody is willing to buy very aggressively, the wick’s range, especially the tip, becomes significant.
Why do they matter?
In price action, we disregard the underlying reason for someone’s order – there could be thousands of variables.
The fact of the decision matters: if people were frantically buying during the wick, those prices mean something to somebody!
Furthermore, imagine the motivation of a person who was willing to place a large limit order to absorb the sales at the tip.
The opposite logic is valid for a bearish pin bar candlestick.
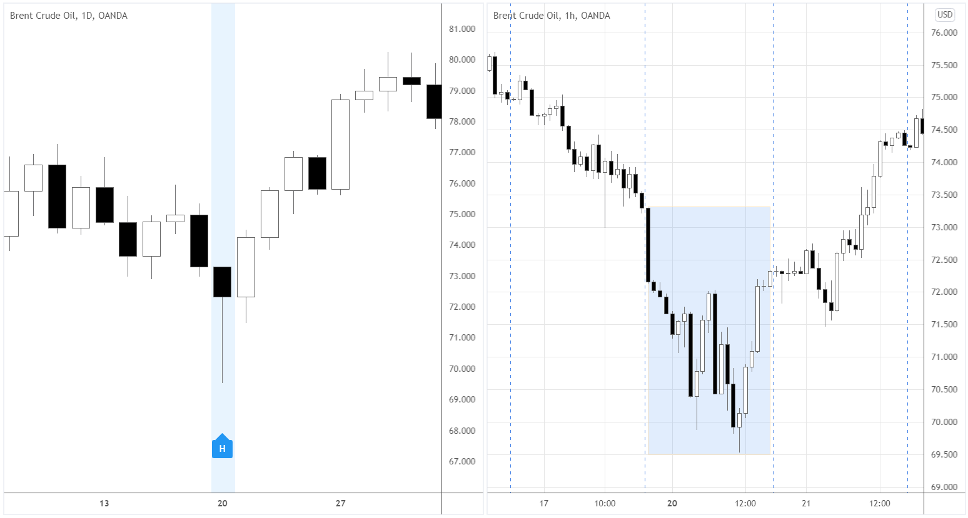
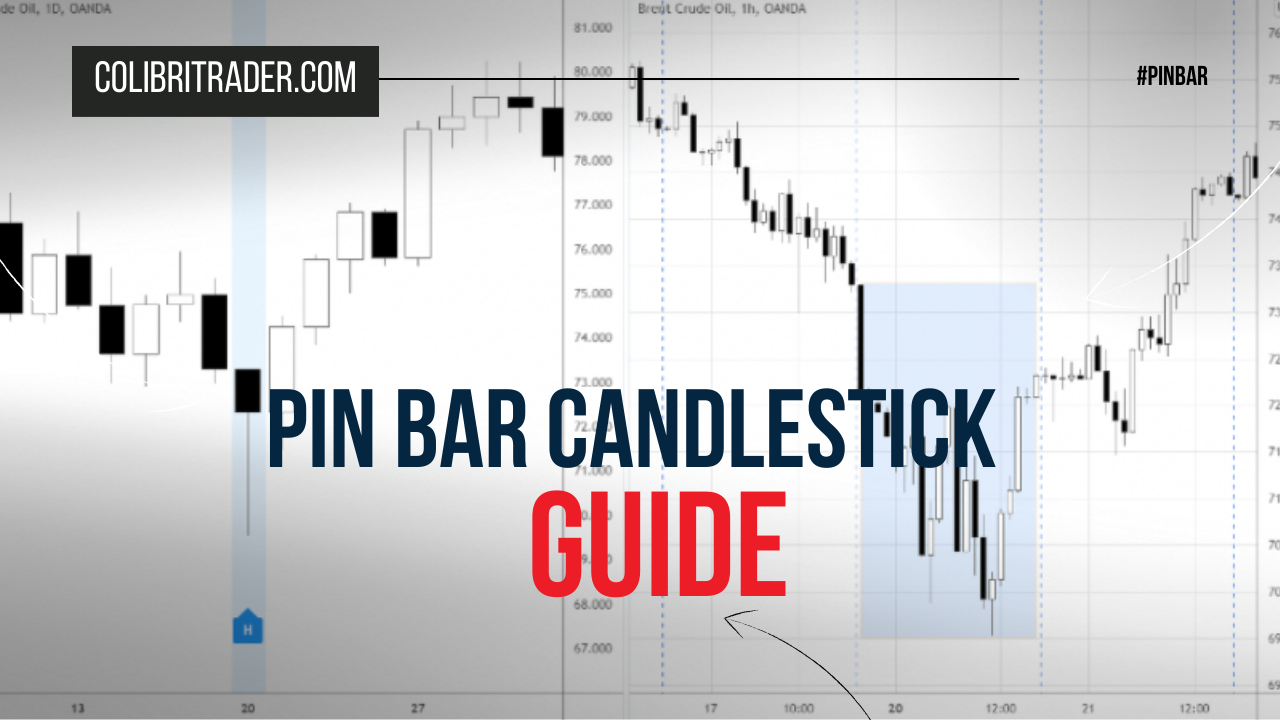
The left side of the illustration above portrays a daily chart with a bullish pin bar candlestick (H – Hammer).
We see an hourly chart within (see the blue area) that daily candle on the right.
Notice how big most of the candles’ bodies are on the way down and up.
How to trade using the pin bar setup?
There are many kinds of market environments where we can apply the pin bar candlestick.
In one way or another, usually, the pattern means a reversal.
Pro tip: You should pay attention to the general price action character of the instrument!
Is it smooth or choppy?
If an asset is choppy, often forming long wicks, the significance of the pin bar candlestick will decrease dramatically.
In that case, you need to look for the one that stands out the most, say it has a noticeably longer wick.
On the other hand, if the asset has been forming smooth waves without any abrupt moves, the pin bar is essential.
Catch the reversals with a pin bar
Let’s start with the classic use of the pin bar candlestick – the reversal.
The Gold chart below shows two bearish reversals after the pin bar (see the circled candles) appeared.
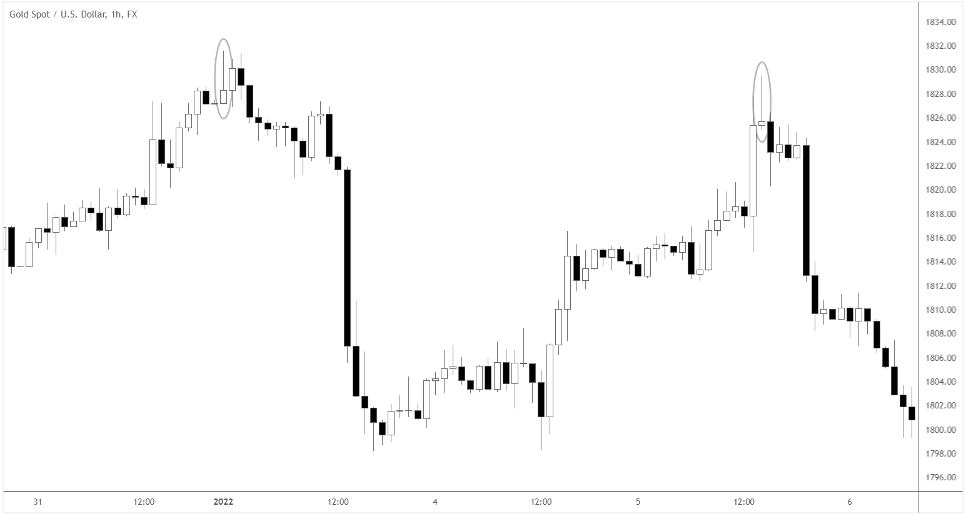
Notice, that we need to see an extended move before considering the pattern.
Traders could sell right after the pin bar candlestick closes in the case above.
For additional confirmation, you can enter at the breakout of the candle’s low.
Pro Tip: A good place for a protective stop is above the high of the pin bar candlestick.
Pin bars in range-trading markets
The pin bar candlestick occurs more often when the market is flat, presenting enough trading opportunities.
The concept is the same – catch the reversal; however, now we should be aware of the limited price range.
Here is an example:
The chart below shows the pin bar candlestick appearing at the range boundaries – support and resistance.
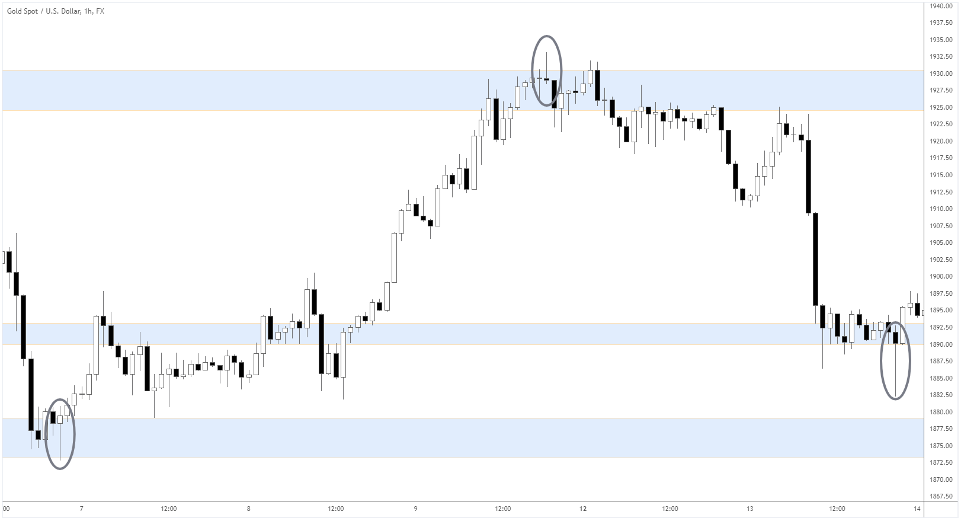
The blue area around 1924.0-1932.0 represents resistance, while those two under 1900.0 are support areas.
We want to enter when the pin bar candlestick comes up at or near the blue area.
A reasonable target would be the middle of the range or even the opposite boundary.
Trade with the pin bar with the trend
When we trade in the direction of a trend, the highest probability setups work for us.
In the context of trend-continuation patterns, we can use the pin bar candlestick to enter at a pullback.
The German stock index (DAX) is trending in the illustration below.
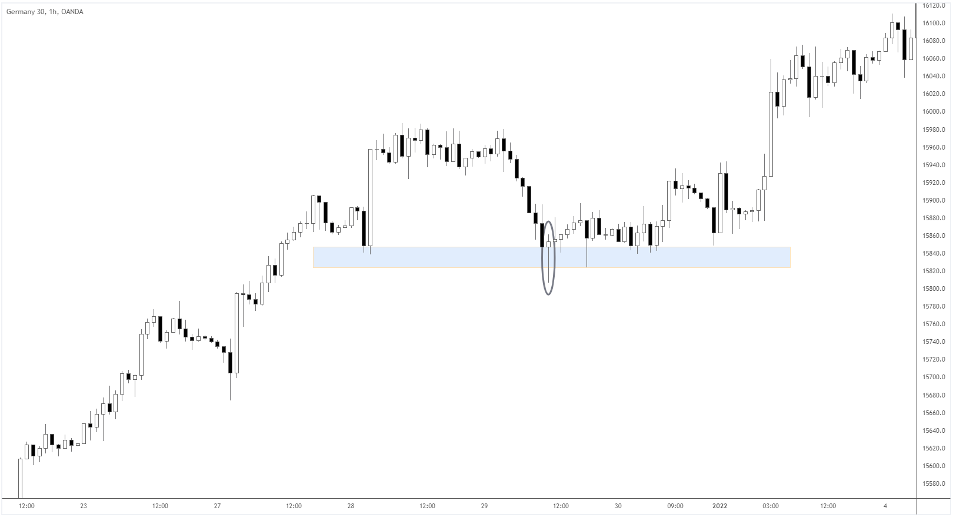
Around the 28th, the market started consolidating, forming local support (see the blue area).
On the 29th, the pin bar candlestick appeared, and pierced the support, with prices later staying above the support.
If you aren’t comfortable entering right away after the candle’s close, you can wait and see if the support holds.
Combine other tools with the pin bar candlestick
Remember: Like most tools, the pin bar candlestick is more reliable when combined with other methods.
Below, we’ll look at several main techniques that can tremendously increase the pin bar’s reliability.
Critical levels
Previously, we combined the pin bar candlestick with the critical levels in different contexts.
Let’s extend on that.
The market was numerously testing a specific price in the illustration below.
Finally, on the 25th, the pin bar appeared (see the circled area), offering a perfect short-sell setup.
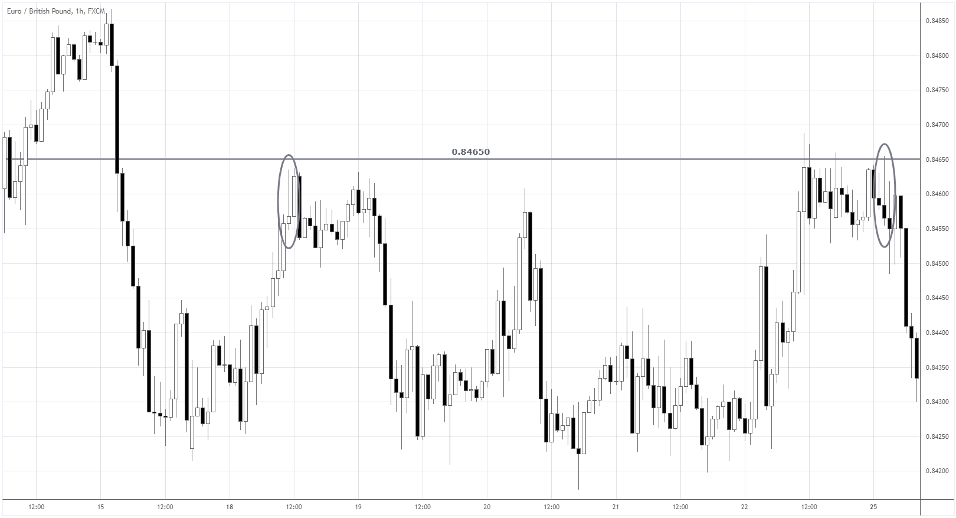
Pro Tip: To find critical levels, look for a price area tested more than twice, preferably from above and below.
It’s helpful to use a grid at your chart’s background – you’ll be able to see the specific prices that matter.
The round prices tend to draw the attention of the market participants as institutions tend to accumulate positions there.
Technical tools
Let’s look at the other method to assess the market context not long before forming the pin bar candlestick.
Indicators are popular tools that calculate price data based on a particular formula.
Traders use such tools to find setups in the market – one of the most popular ones is RSI.
We can find sell setups when the indicator’s reading goes above 70.
When RSI is below 30, buy setups are likely to emerge.
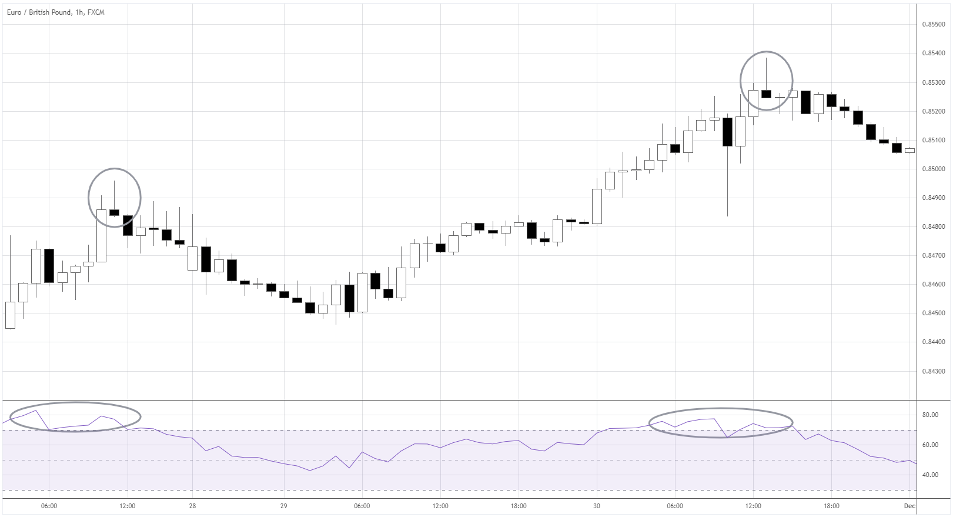
The EURGBP chart above shows examples of “fading” the market.
We attempt to sell at the top of the wave when RSI is above 70, and the pin bar candlestick is formed.
Volume
The final major way to find high-probability setups is by combining the pin bar candlestick with the surge in volume.
When the pin bar is formed along with the abnormally high volume, it confirms the excessive interest in an asset.
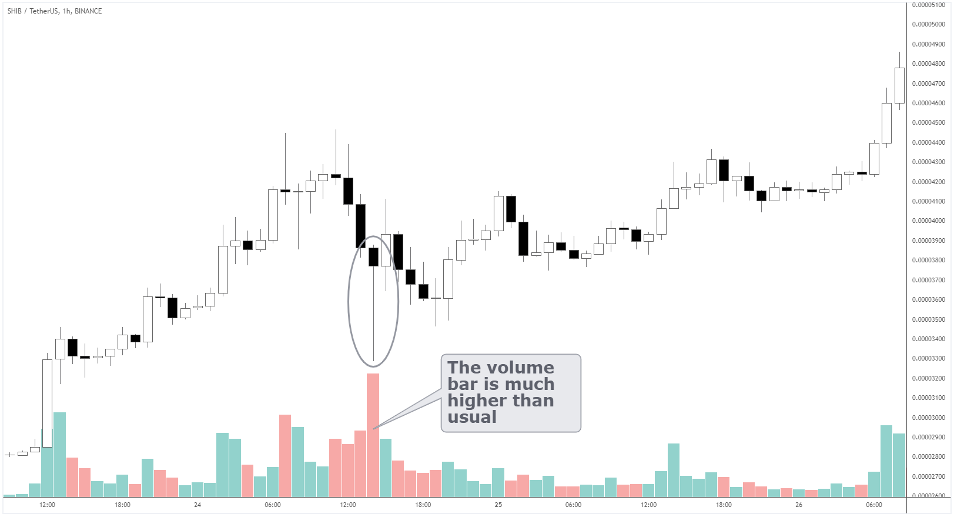
The meme crypto, SHIB, took off after the colossal volume showed up with the pin bar candlestick.
Pro-tip: zoom in and pinpoint the entry
Not all pin bar candlesticks are created equal.
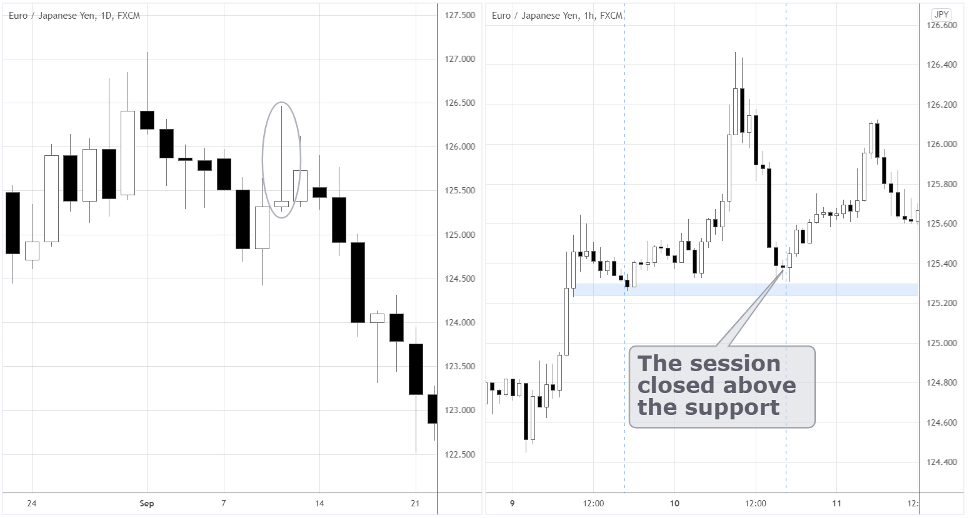
You can look for the setup confirmation within the candle itself.
In the first case, we see a pin bar on a daily chart on the left and an hourly chart on the right.
We got sell signals after the session broke the support at 126.3 and closed below.
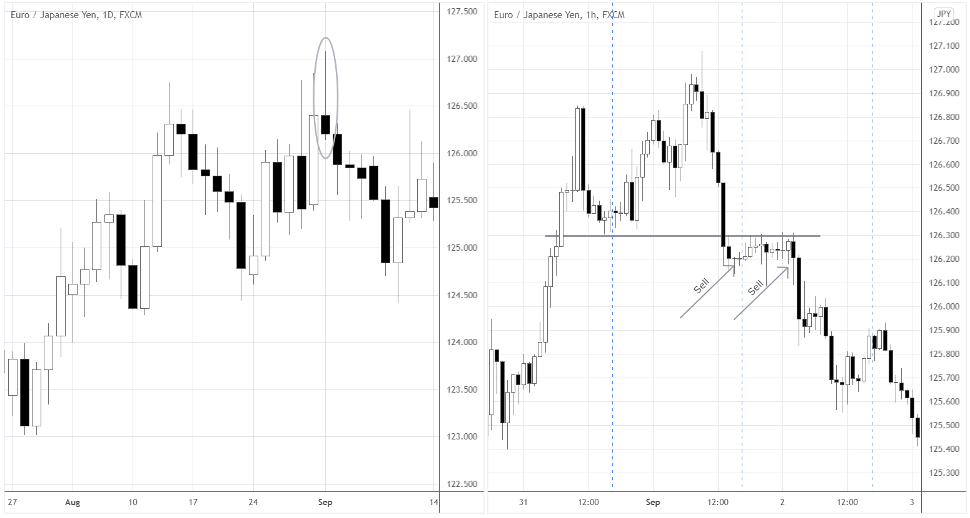
Compare it with the following example, where the close is above the support.
We would sell into a fat buy limit order if we went short there.
It’s like trying to break the wall with a finger instead of using a bulldozer!
Summing It All Up- The Pin Bar Candlestick
The pin bar candlestick is a simple yet powerful formation you can use in various market contexts.
It would help if you incorporated other tools to increase the reliability of the pin bar.
To sum it up, the pin bar candlestick pattern is one of the simplest ways to trade with and against the trend.
Hope that makes sense.
Depending on the place of formation and its shape, the pin bar candlestick could be used as both a reversal, as well as continuation pattern.
All in all, the properties of this candlestick are very important for successful chart reading.
If you are looking to incorporate one very simple yet powerful approach to trading the markets, trading with pin bars is it.
Happy Trading,
Colibri Trader
P.S.
Have you checked my other article on the 5 Pin Bar Trading Strategies?