


7 Best Trend Indicators Traders Should Know About

7 Best Trend Indicators Traders Should Know About
A trending market is either rising or falling. The beauty of currency trading is that it lets you sell something you don’t have with the help of a margin.
Traders go short to benefit from bearish trends too. Trend indicators, therefore, work in both bullish and bearish markets.
Get the Free Moving Averages PDF Guide- One of The Best Trend Indicators Ever!
This article focuses on the best trend indicators out there. We’ll have a look at their pros and cons, as well as at some strategies to make the most of trending conditions.
Before anything else, we should all keep in mind of one thing. For a strategy involving trend indicators to work, the presence of a trend is mandatory.
Contents in this article
- On Artificial Intelligence, Trend Indicators and Algorithmic Trading
- Bollinger Bands
- How to Trade with the Bollinger Bands Trend Indicator
- ADX – One of the Most Powerful Trend Indicators
- Parabolic SAR
- Using Trend Indicators as Scalping Tools
- Moving Average – The Reliable Trend Indicator
- MACD – A Trend Indicator that Rarely Misses a Move
- Donchian Channel – A Unique Channel Reinforcing Trending Conditions
- Aroon – A Surprisingly Powerful Trend Indicator
- Conclusion
On Artificial Intelligence, Trend Indicators and Algorithmic Trading
The rise of artificial intelligence and algorithmic trading lead to changes in the marketplace. The concept of market efficiency (i.e., the market prices in every possible information as quickly as the first possible trade) has never been more actual as it is today.
Moreover, if there’s a market to prove it, that’s the currency market. Here, market anomalies, the core of the market efficiency concept, are corrected so quickly that all it takes is a fraction of a second.
For this reason, strong, directional trends, exist only on the bigger picture. In the short run, algorithmic trading corrects market anomalies so fast that trending conditions on lower timeframes rarely exist.
It makes it a challenge using trend indicators. Moreover, finding the right strategy using trend indicators is a challenge too.
However, traders always had a unique vision. It takes imagination and courage to dive into currency trading.
With more and more traders joining the currency market, new views and ideas emerge. So yes, it is possible to be profitable using trend indicators. But there are some things to know before deciding which indicator to use. And that’s where this article fits.
Bollinger Bands
We must start with the Bollinger Bands indicator. If anything, it is the most famous trend indicator. And, extremely popular among retail traders.
Moreover, it has a representative name. John Bollinger built the indicator that bears his name in the 1980s, having in mind two uses for it: 1) to show trending conditions and 2) to measure the market’s volatility.
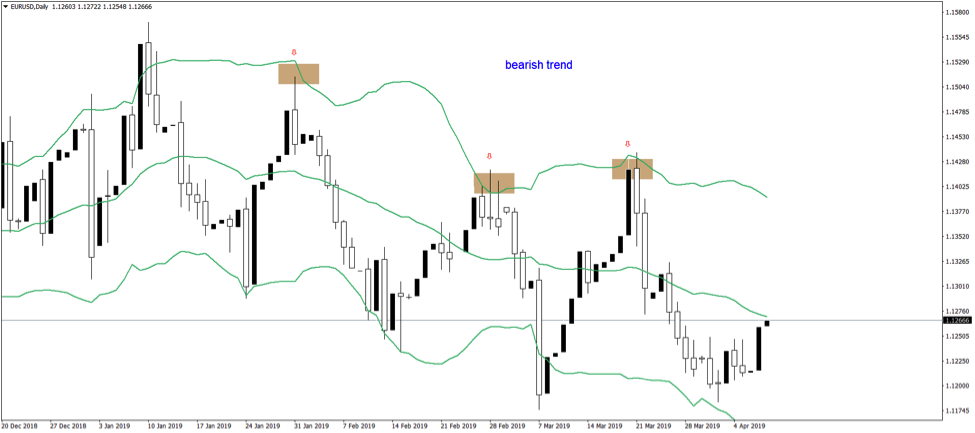
The three bands involved (the green bands on the chart above) closely follow the price. Usually, the band in the middle is a moving average, like an EMA (Exponential Moving Average).
The indicator’s edges (i.e., the bands) follow the price and reflect its volatility too. The closer they get, the lower the volatility. Hence, a breakout becomes imminent.
How to Trade with the Bollinger Bands Trend Indicator
For the right trend interpretation, here are some things to consider in a bearish market.
- First, make sure there’s a series of lower lows in place. That’s what makes a bearish trend.
- Second, use the upper Bollinger Band as a place to enter the market on the short side.
- Third, have in mind two targets.
One, at the MBB (Middle Bollinger Band). Most traders book half of the profits here and move the stop-loss order at break-even.
Finally, target the lower edge of the bands. On a timeframe like daily, this is enough for making the most of medium-term trends.
Trend indicators like the Bollinger Bands have the significant advantage of making the trend visible. Strong bullish trends have the price hovering between the upper and middle Bollinger Bands. In contrast, strong bearish trends move between the lower and the middle Bollinger Bands.
Traders with a stronger risk appetite will try to get in as quick as possible. For this reason, the MBB (Middle Bollinger Band) works best as an entry place. However, the condition is that the trend is strong enough for it to act as resistance (in a bearish market).
Hence, other trend indicators may be needed to confirm the trend. Or, even to measure its strength. How about the ADX?
ADX – One of the Most Powerful Trend Indicators
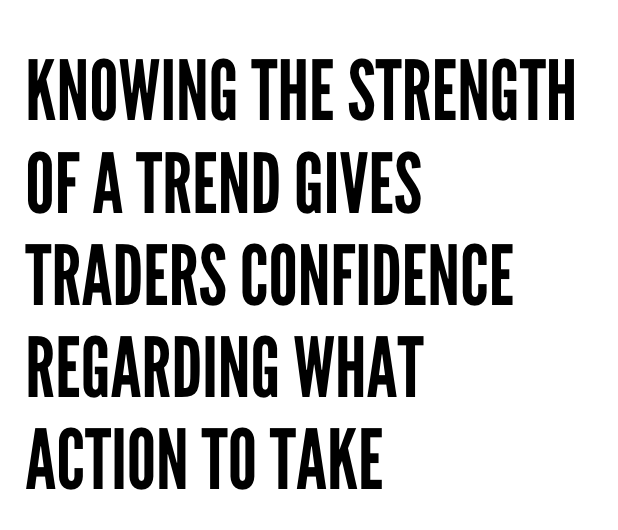 Out of all trend indicators to know, ADX tops the list. It shows the strength of a trend, and this is a piece of critical information for all traders.
In other words, during strong bullish trending conditions, one may decide to skip selling at resistance. After all, if the trend is so strong, the price might get through it.
Or, during strong bearish trends, buying into support might not be wise. The price may dip further.
Thus, knowing the strength of a trend gives traders confidence regarding what action to take. If all things point towards a trade, but the trend is not confirming that, skipping the trade is the right thing to do.
Coming back to the ADX, the acronym stands for Average Directional Moving Index. It travels between the 0 and 100 values.
When below 20, it shows weak trending conditions. On the contrary, above 40, and trend indicators might work in providing the right entry for a trade.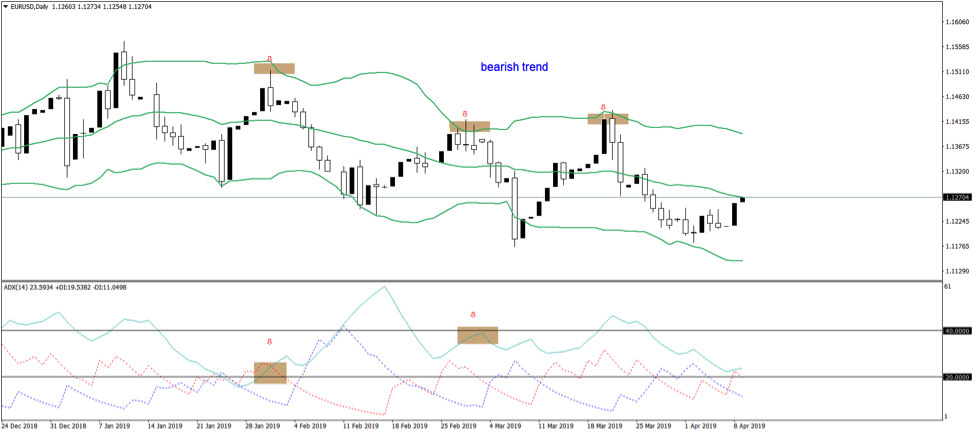
The easiest way to demonstrate the ADX’s importance is to use the previous example. According to the Bollinger Bands, there were three places to sell: when the price went against the UBB.
The ADX below also shows the 20 and 40 levels. From left to right, the price nears the UBB, in a bullish trend. But, a close look at the ADX shows values close to 20. It implies that the bounce higher didn’t have trending conditions. Hence, selling against resistance makes sense.
Out of the three situations, the first one is the most reliable. Again, the ADX confirms the strength of a trend. As such, traders adjust the risk and the volume, accordingly.
The ADX has one drawdown. It lags price action.
However, in combination with other trend indicators, it proves to be quite useful.
Parabolic SAR
The name of this trend indicator comes from “stop and reverse.” Developed by Wilder in the ’80s, it is an excellent trend-following indicator.
This one, too, lags the price action. However, in strong trends, the stop and reverse function makes it clear to all traders that a new trend is in place.
Many traders use it to set the appropriate stop-loss in a trade. However, to make the most of the Parabolic SAR trend indicator, one needs to use his/her imagination.
The pure beauty of this indicator is that it calculates the future values based on historical ones. And, it doesn’t repaint.
It means that by the time it plots a dot on the chart, signalling bullish or bearish conditions, it does remain there. Regardless of the future price action, it merely remains there.
Savvy traders use that as an invalidation of the previous trend.
Because the market rarely forms strong trends (for all the reasons explained at the start of this article), traders use the Parabolic SAR to trade short-term. Or, to scalp the market.
Below is the USDJPY chart. It shows the daily timeframe.
In a bullish trend, the SAR dots appear under the candlesticks that reveal the price action. On a bearish trend, they are above.
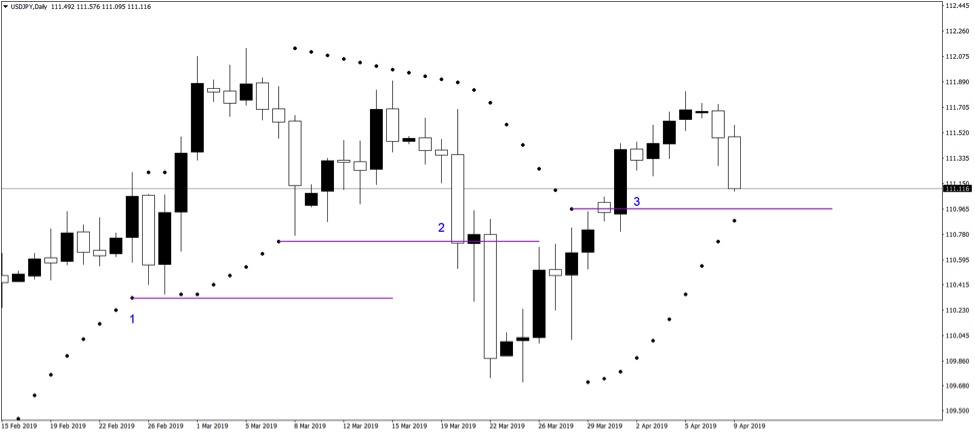
Traders use trend indicators like this one to profit from small market moves. And, to filter the possible false breakouts.
Using Trend Indicators as Scalping Tools
From left to right, the first instance shows the SAR dots changing from bullish to bearish. However, traders wait for a candlestick to close below the last SAR bullish dot.
No close, no reverse. As such, when the SAR dot becomes bullish again, the trend resumes. Typically, the next candlestick is always one that makes a new high.
The second instance on the chart shows a strong, bearish, daily candlestick. The price closes below the last bullish SAR dot.
It signals reversal conditions and is followed by a move at least of the same length as the candlestick that closed below that horizontal line.
The third example confirms the theory. And this is how you use trend indicators to scalp on the daily chart. Effectively, it means finding intraday trends on the five-minute timeframe, so we can say that the trend indicator respects its function.
Moving Average – The Reliable Trend Indicator
Never underestimate the power of a moving average! That is especially true in the case of the mother of all moving averages: the MA(200).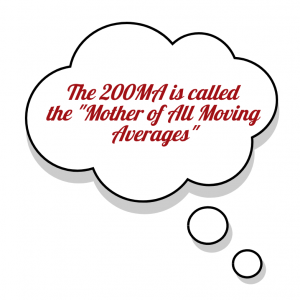
For those familiar with this blog, it isn’t the first time I have discussed moving averages. There are multiple ways to deal with a trend when using them:
- sell spikes in a bearish trend
- buy dips in a bullish trend
- interpreting multiple moving averages of various periods and looking for their perfect order (e., their alignment from the fastest to the slowest)
- buying dips after a golden cross between MA(200) and MA(50)
- selling spikes after a death cross between the same two moving averages
And, the list can go on. Among all trend indicators, the moving average stands as one of the most reliable ones.
For a good reason! Here’s the recent hourly price action on the EURJPY cross:
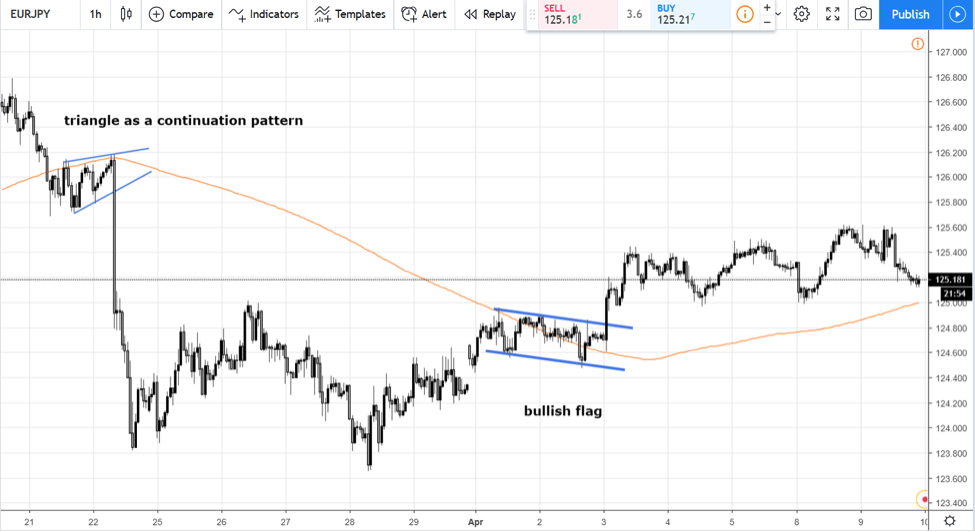
The orange line represents the MA(200). The mother of all MAs.
Its primary purpose is to split the market into two: bullish and bearish.
Using price action in conjunction the MA also offers valuable info for the veteran trader. From left to right, the first instance shows trending conditions.
The marked formed a triangle as a continuation pattern. This kind of triangles form during strong trends. Hence, it is no wonder the pair effectively “melted” after it broke lower.
However, after a while, the market bounced. But, when touching the MA, instead of rejection, it formed another continuation pattern.
What else do you need from a trend indicator than signalling a continuation pattern?
The idea of this part of the article is to show a different way to use the classic MA. And, as we’ve proven, a valuable one.
MACD – A Trend Indicator that Rarely Misses a Move
The MACD is one of the indicators traders should know. While listed on most trading platforms as an oscillator, it has a strong trending component.
Check out my full article on MACD here.
The MACD histogram is one of the most powerful trending tools that exists out there. It shows the nature of the current trend immediately, if any.
And, it also shows when the trending conditions disappear. To use it properly, traders should interpret the histogram against the MACD line.
In a bullish trend the histogram is always below the MACD line. So, what to do to ride the trend? Nothing, just watch the market going in your favour.
Obviously, exit when the histogram gets above the MACD line, as it might be showing a possible bullish reversal. Or, at least a weakening of the previous bearish trend.
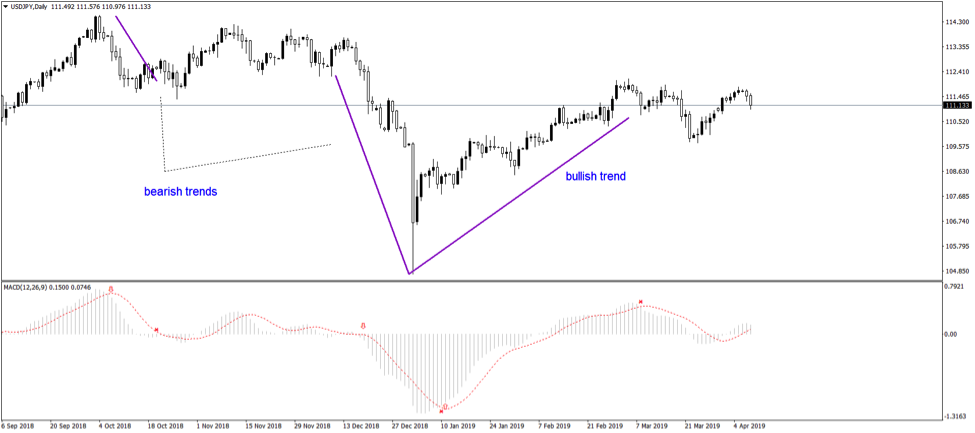
Using the MACD on the daily USDJPY pair (in the above chart) results in identifying three strong trends. Two bearish, and one bullish.
Moreover, it allowed traders to make the most of the now-famous January 2019 flash crash. For those riding the bearish trend with the MACD trend indicator, the flash crash wasn’t a surprise.
At best, it was the last phase of a bearish trend, the ultimate goal of every trend rider.
Donchian Channel – A Unique Channel Reinforcing Trending Conditions
 Richard Donchian is credited with developing the Donchian Channel trending indicator. Also called the “father of trend following,” he created the indicator with the stated intention to helping him identify trends.
Trading with Donchian is both simple and complex. The standard interpretation is that traders should buy when the price reaches the upper edge of the channel. And, sell when reaching the lower one.
However, the indicator wasn’t developed for the currency market. Therefore, we need to “adapt” it to better fit the purpose.
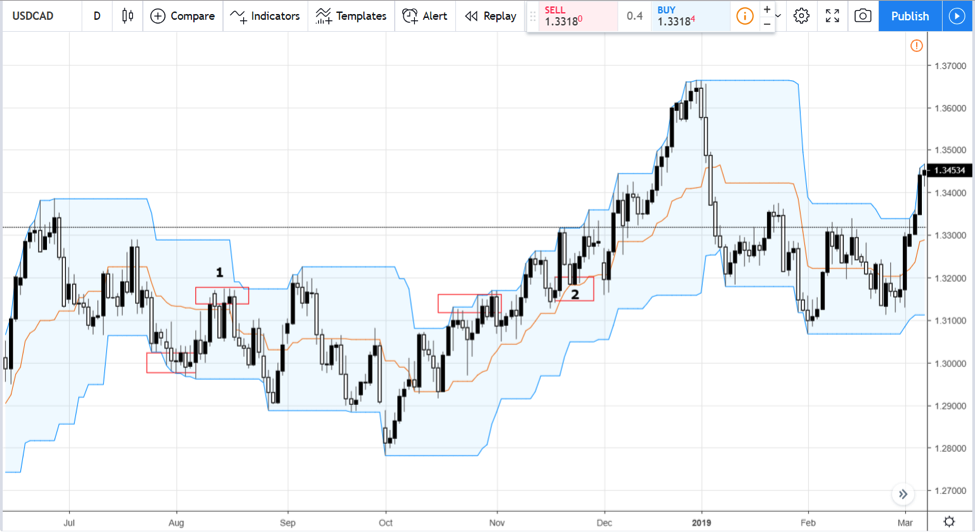
The chart above shows the USDCAD. On the daily timeframe, it has the Donchian Channel marked with the blue area.
The red rectangles mark two distinct situations. The price needs to touch the upper or lower edges of the trend indicator to signal a trend. And, traders typically enter on a bounce to the middle of the channel, marked with the orange line.
An effective strategy, it makes the Donchian Channel one of the indicators traders should know about. It is, to say the least, a very good trending indicator for your trading arsenal.
Aroon – A Surprisingly Powerful Trend Indicator
Last but not least of the trend indicators that made our list is the Aroon indicator that has been created in 1995. Tushar Chande built it having in mind one thing: to identify changes in the underlying trend.
With that in mind, consider that the Aroon indicator has two lines. And, unlike any other trend indicator, it appears at the bottom of a chart.
In a separate window, just like an oscillator, it measures the changes and the strength of a trend. It acts, if you want, as a confirmation to a trend’s strength.
The two lines that make this trend indicator are crucial to its interpretation. Conveniently called Aroon Up and Aroon Down, the focus sits on their cross.
Naturally, when Aroon Up crosses above Aroon Down, the market starts a bullish trend. When the opposite happens, a bearish trend begins.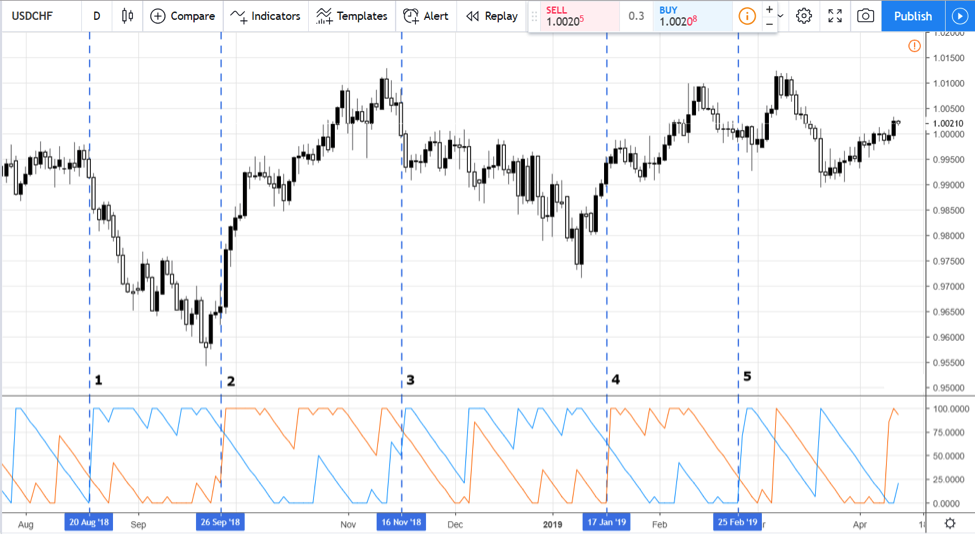
The chart above is the daily chart of the USDCHF. As a major pair, it strongly depends on the value of the U.S. Dollar, the world’s reserve currency.
Hence, it trends quite a lot. Even on this timeframe, we can see a few trends in the last twelve months or so.
The blue and orange lines speak for themselves. They represent the Aroon Down, respectively Aroon Up lines.
The vertical lines were drawn to give you a clear picture of where the price was when the two Aroon lines crossed. With virtually little error or none, the crossover of the two Aroon lines marks the start of important trends.
Keep in mind: this is the daily timeframe!
Conclusion
The use of trend indicators increased in popularity with the expansion of online trading. Suddenly, a simple Internet connection and a trading platform gave traders access to sophisticated market indicators.
In other words, it is easy to apply and use an indicator on any given chart. But, there’s one caveat one needs to consider.
That is, the type of the market. Most trend indicators were developed before the currency market as we know it today even existed.
Furthermore, they all lag the price action. With some lagging more than others, it becomes a real challenge to smooth the price action in such a way that the trend indicator reflects accurate changes in price.
For instance, the Bollinger Bands indicator works best if for the MBB (Middle Bollinger Band) traders use an EMA (Exponential Moving Average) instead of the implied SMA (Simple Moving Average).
Small tricks like this reduce the lag, but they can’t eliminate it altogether.
So what?
Does this mean that trend indicators have no use?
No, it only means that any trading strategy, regardless of whether it is based on trend indicators or not, works better if accompanied by sound money management principles. There’s no indicator telling you to buy from the absolute low and sell from the top. There is also no indicator that is accurate one-hundred percent of the time.
Instead, using trial and error, stop-loss orders and proper risk-reward ratios, you’ll end up riding important trends even with lagging indicators. Trend indicators may lag, but when you ride a trend on the daily timeframe and have the power to stay for the whole ride, you’ll hopefully make up for most of the previous mistakes that affected the account.
Happy Trading,
Colibri Trader
Check out my other article on Trend Following
or watch my video on Moving Averages and how to use them below:
Good article. I am trying the DONCHIAN CHANNELS for intraday trading. Looks good so far. Please do keep up the excellent work you do Colibri & many thanks for your helpful advise & information.
Hi Ed! It is totally my pleasure! I am glad that I could help other fellow-traders! Never give up and keep your discipline strong!