


Silver Analysis
In this article, I will do a quick technical silver analysis.
Why is that?
Because I believe that we are entering into a new phase of money rotation.
Let me walk you through what I see and why I think the silver market may be at a tipping point.
Technical Thoughts on Precious Metals (Including Silver Analysis)
Before I get you started on silver, I wanted to remind you of an article I wrote late last year.
Here is my article on an indices sell-off, which I was expecting to happen on the 29th of November, 2021.
Since then markets have fallen off a bit, but I still believe that the worst is to come.
From a technical perspective, both US and European indices are looking bearish.
What that does mean for Silver?
Bullish Silver
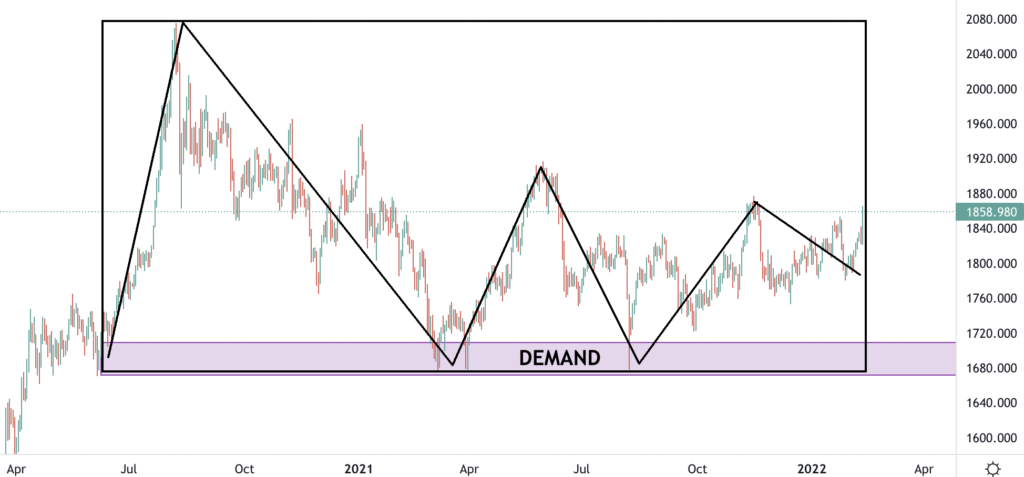
Here is a daily chart of Silver:
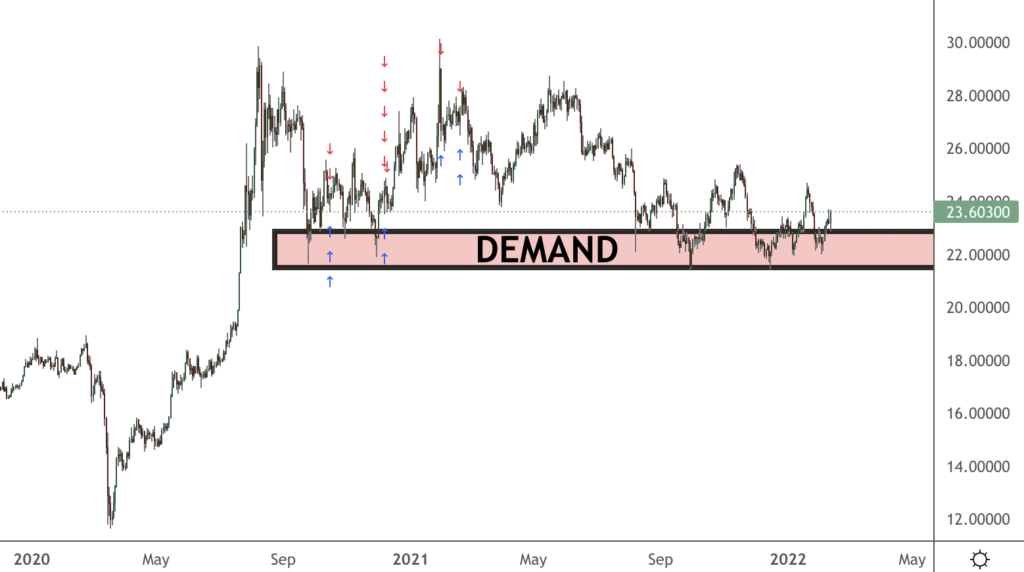
As you can see, price is located just above a major demand zone.
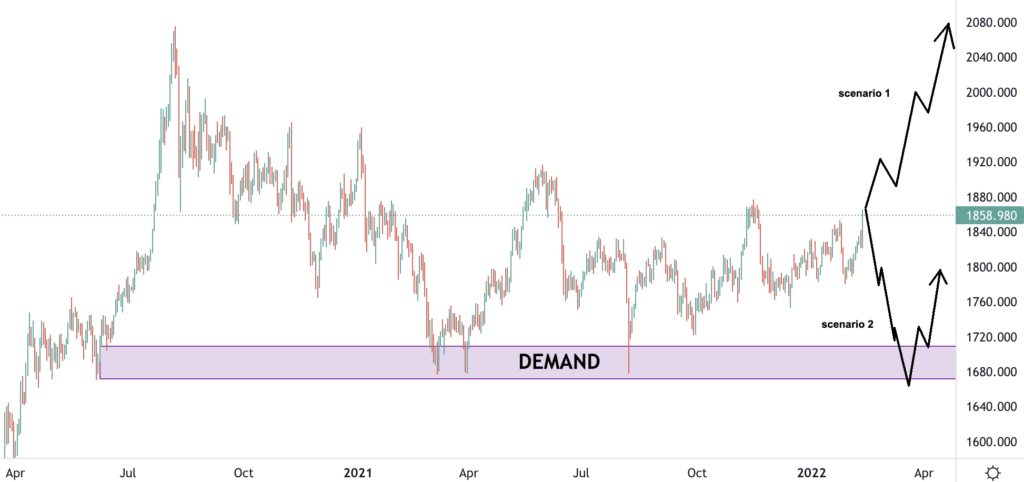
There are three possible scenarios and one of them is for the price to break below the demand zone and more lower.
Here are the other two:
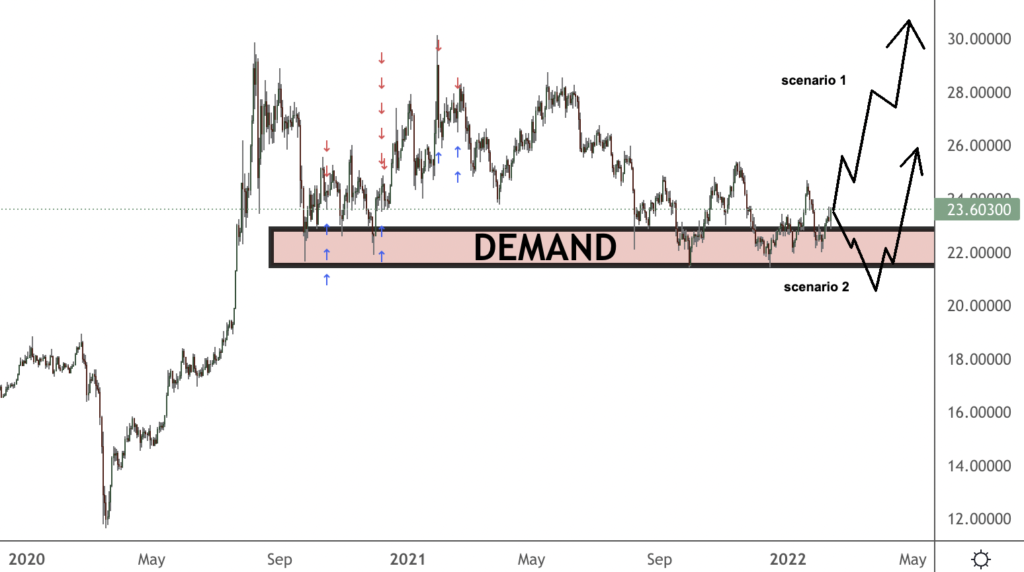
It is very likely that we will see price coming down to test the demand zone one more time.
One way or another, I feel more bullish than bearish when it comes to silver.
Let’s have a look at Gold now.
Bullish Gold- similar to Silver
Gold looks very similar to Silver.
It has been range-trading for almost 6 months now.
It almost looks like the market was on a HOLD mode waiting for some event to hit the wires.
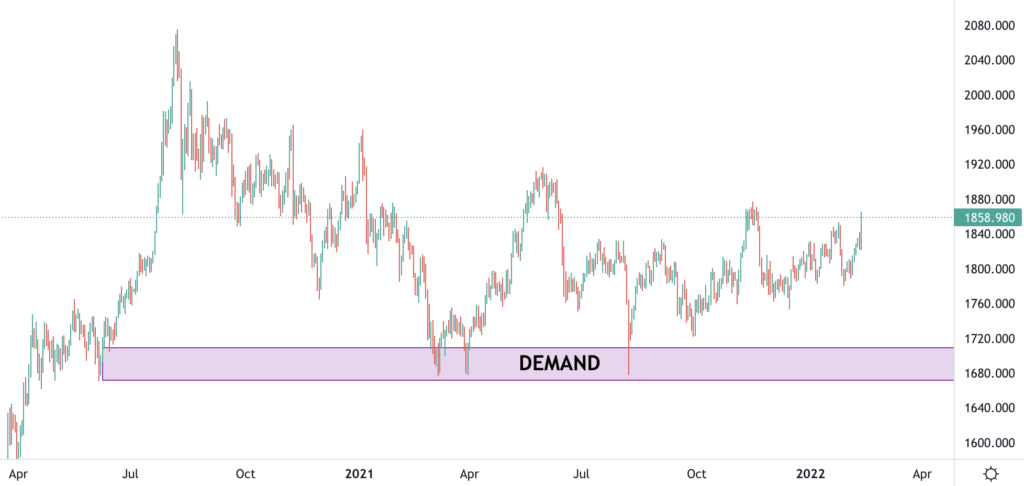
Here is the range:
This is very similar to the range that the silver market was bound to.
So, what am I expecting to see here.
Three possible scenarios are on face.
#1: Price breaks lower and establishes a new bear trend
#2: Price continues higher and continues the bull trend
#3: Price re-tests the demand zone and then continues the bull trend
What will happen?
Considering the overall landscape, I believe it is just a matter of time before we see the price going higher attracting more safe-heaven investors.
Bullish Platinum- just like Silver
Let’s go one timeframe higher here.
In order to see better the technical landscape here, we need to go one timeframe higher: weekly.
Here is the weekly chart of Platinum:
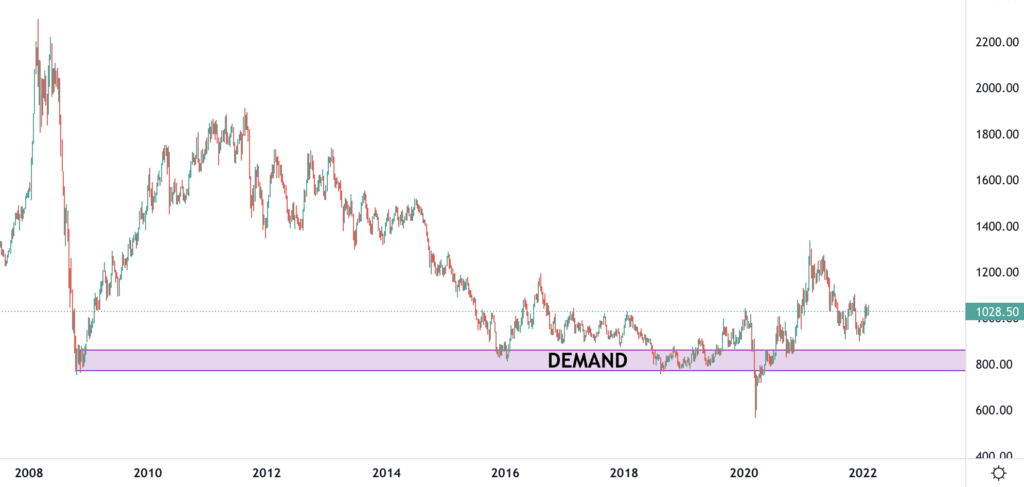
It looks very similar to the rest of the precious markets.
There is a major demand zone, which was briefly “pierced” to only form a bear trap pattern (a great place to enter in a long trade as per my strategy).
It looks like we might see a very bullish scenario here, too.
Let’s have a look at the possible options:
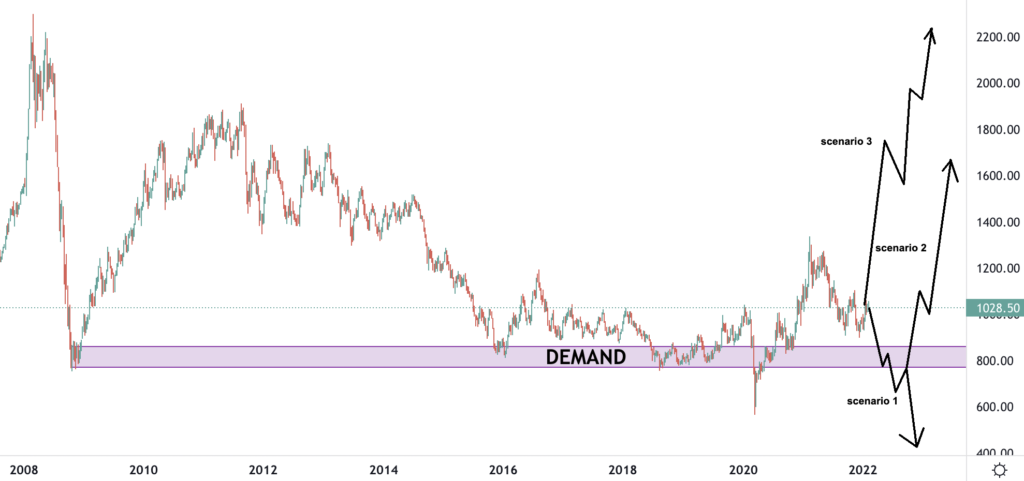
Just like the previous two markets- silver and gold, there are three possible scenarios ahead of us.
One looks bearish (scenario 1) and the other two bullish.
Considering the overall landscape with falling indices and cryptos, there is a high chance of prices of these precious metals to enter a new bull cycle.
Last but not least, the geopolitical situation bodes for more money being shifted towards safe heavens like precious metals.
Silver Analysis- Previous Bull Cycles
Silver has always had an intrinsic value in human history and it continues to provide security in volatile financial markets.
Since the 60s, there have been 6 bull markets!
This could possibly be the 7th lucky streak.
Here are the 6 previous silver bull markets:
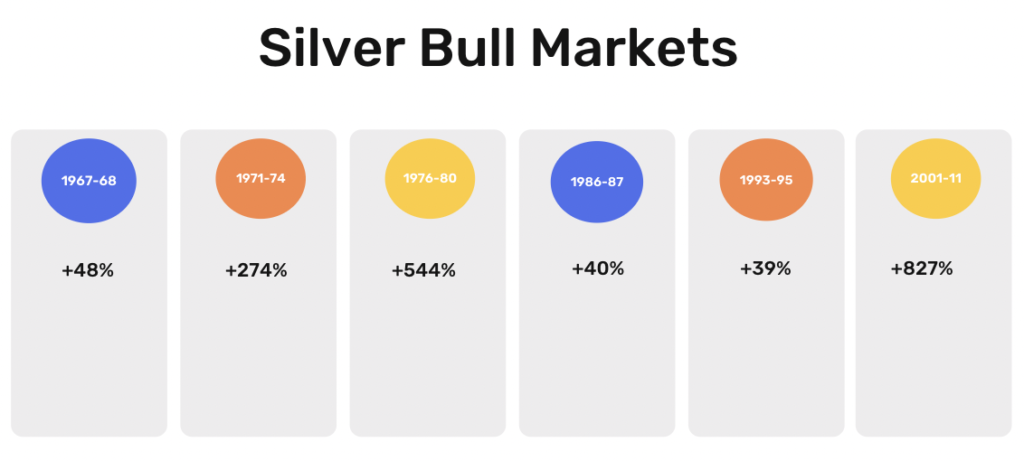
Currently, since the last bull cycle started (which was 2015), the price of silver has appreciated roughly 53% or from $15 to $23.
Why am I more bullish on Silver than Gold?
Simple:
Will silver prove itself one more time in this bull run?
Price will show us.
Happy trading,
Colibri Trader
P.S.
Check out my article on The Major Market Sell-Off