


Pullback Trading: 7 Factors to Consider Before Placing a Trade
DOWNLOAD THE OPTIONS CALCULATOR
Pullback trading can best be described by the term ‘the trend is your friend.’
This is because trends bring a lot of trading opportunities, especially after an active higher or lower price trajectory.
Thus, you place your trade after confirming the market’s direction with pullbacks, making it a widely successful strategy.
Unfortunately, taking advantage of such an opportunity is easier said than done.
The trend is only your friend ‘until it ends.’
Traders need skills to profit from trading pullbacks and equally know the right time of pulling out of a bad trade.
We will guide you on the factors to consider before placing a trade using the pullback trading strategy.
But, before that, let’s define and understand what pullback really is.
DOWNLOAD THE OPTIONS CALCULATOR
Contents in this article
- Pullback Trading Factor #1: Identify a Trend and Trade in Its Direction
- Pullback Trading Factor #2: Classify The Trend
- Pullback Trading Factor #3: Identify Your Area of Value
- Pullback Trading Factor #4: Entry Trigger
- Pullback Trading Factor #5: Exit if You’re Wrong
- Pullback Trading Factor #6: Exit If You Are Right
- Pullback Trading Factor #7: Multiple Plans of Attack
- Final Thoughts on Pullback Trading
- Pullback Trading FAQs
What is a pullback?
A pullback in trading simply means a price movement inconsistent with the prevailing market trend.
For example, new highs or new lows cause strong market trends.
Likewise, we have a pullback when asset prices move way beyond the notable breakout or breakdown levels.
7 Factors to consider before placing a pullback trade
Below find the seven most important factors that every trader, new or experienced should consider before trading pushbacks.
To a large extent, these factors will contribute to the success of a trade.
Pullback Trading Factor #1: Identify a Trend and Trade in Its Direction
When you trade pullbacks, you must recognize an existing trend. Traders should be able to do this with ease.
However, let us clarify for novice traders.
From the chart:
- An uptrend is when the price on the left is lower than that on the right. That leads to higher highs and higher lows.
- A downtrend is when the prices on the left of the chart are higher than those on the right. That leads to lower highs and lower lows.
Examples of uptrend and downtrend graphs:
The trends should have visible pullbacks and clear retracement.
That helps you time your entry.
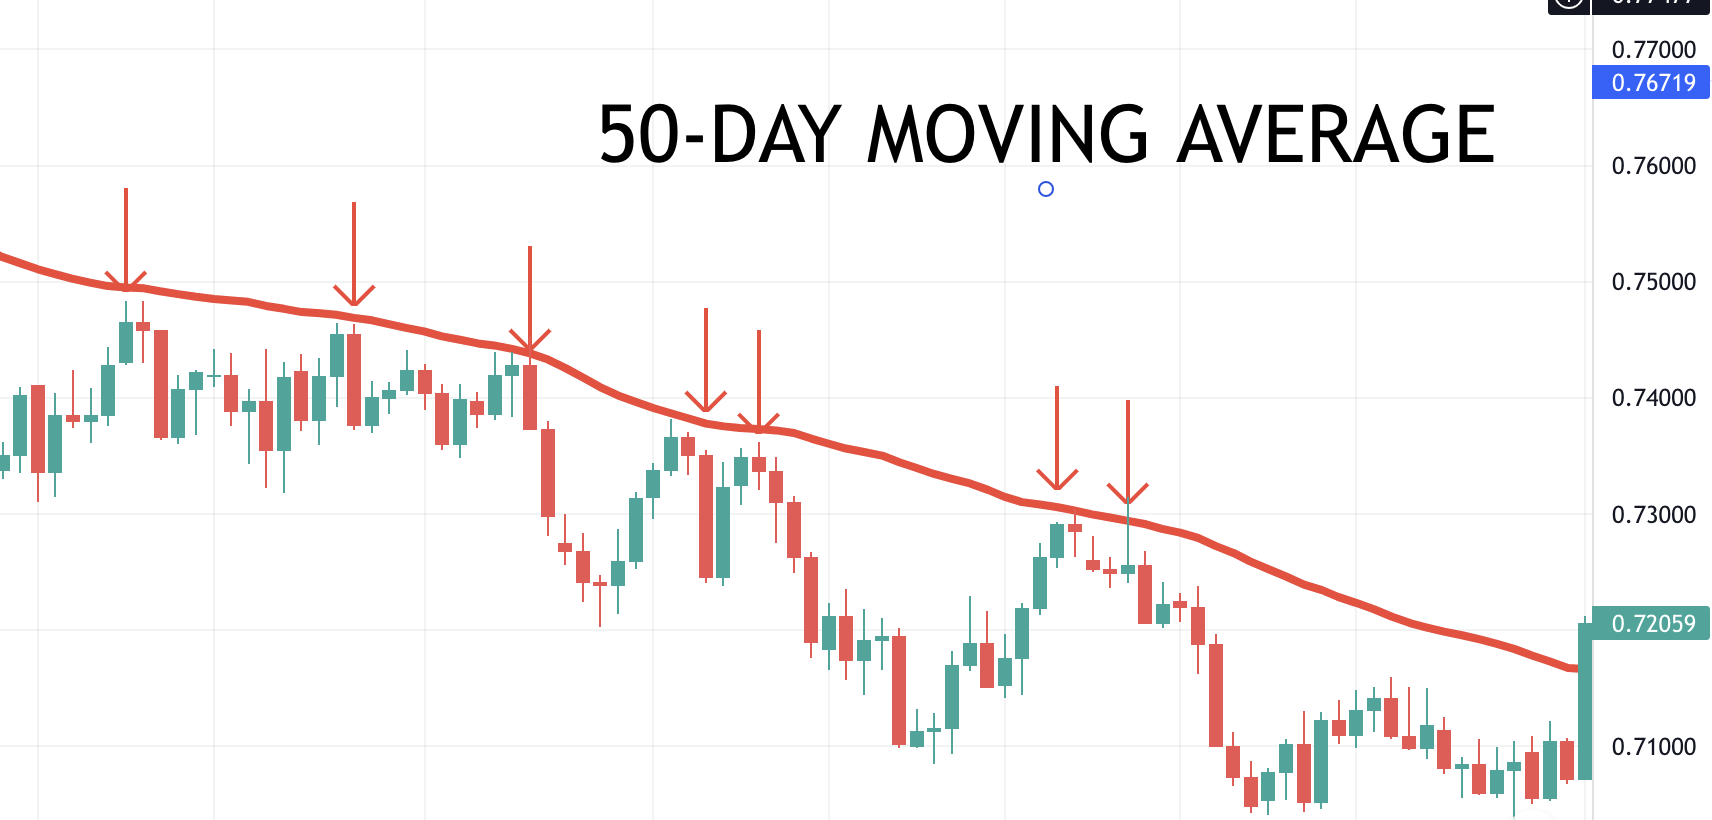
Keep in mind that the 50 moving average (50MA) is an essential tool here.
So, look for trends with a pullback towards the 50MA or more.
Also, avoid market conditions that lead to grinding up or downtrends with shallow pullbacks, as timing the entry points is complex.
Pullback Trading Factor #2: Classify The Trend
A general assumption amongst traders is that trends consist of higher highs and lows.
That is, however, not exhaustive as trends are not equally created.
Therefore, we classify trends into three categories depending on their pullbacks.
Some have shallow pullbacks, while others have deep pullbacks.
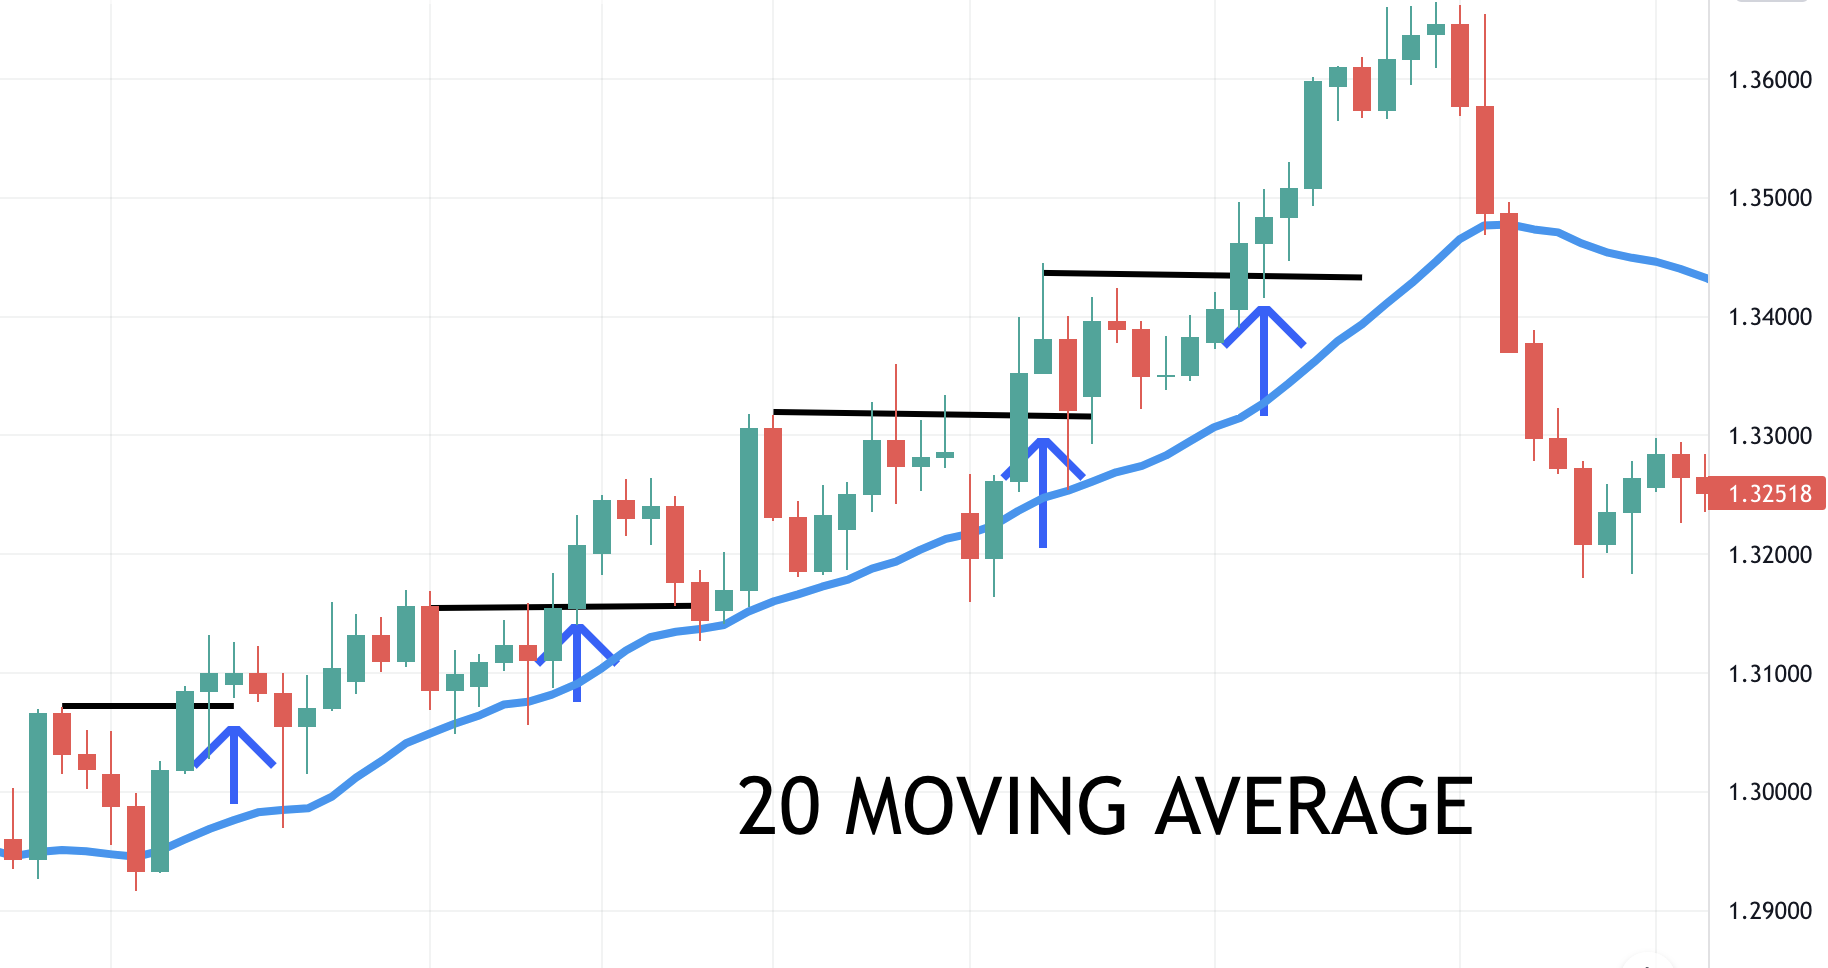
- Strong Trend: This type of trend has shallow pullbacks barely retracing beyond the 20MA. Buyers are in control with very little selling pressure.
- Medium Trend: This trend has a decent retracement though it respects the 50MA and remains above it. Buyers are still in control though there is little pressure to sell. The pressure is probably because of traders taking profits or taking counter-trend setups.
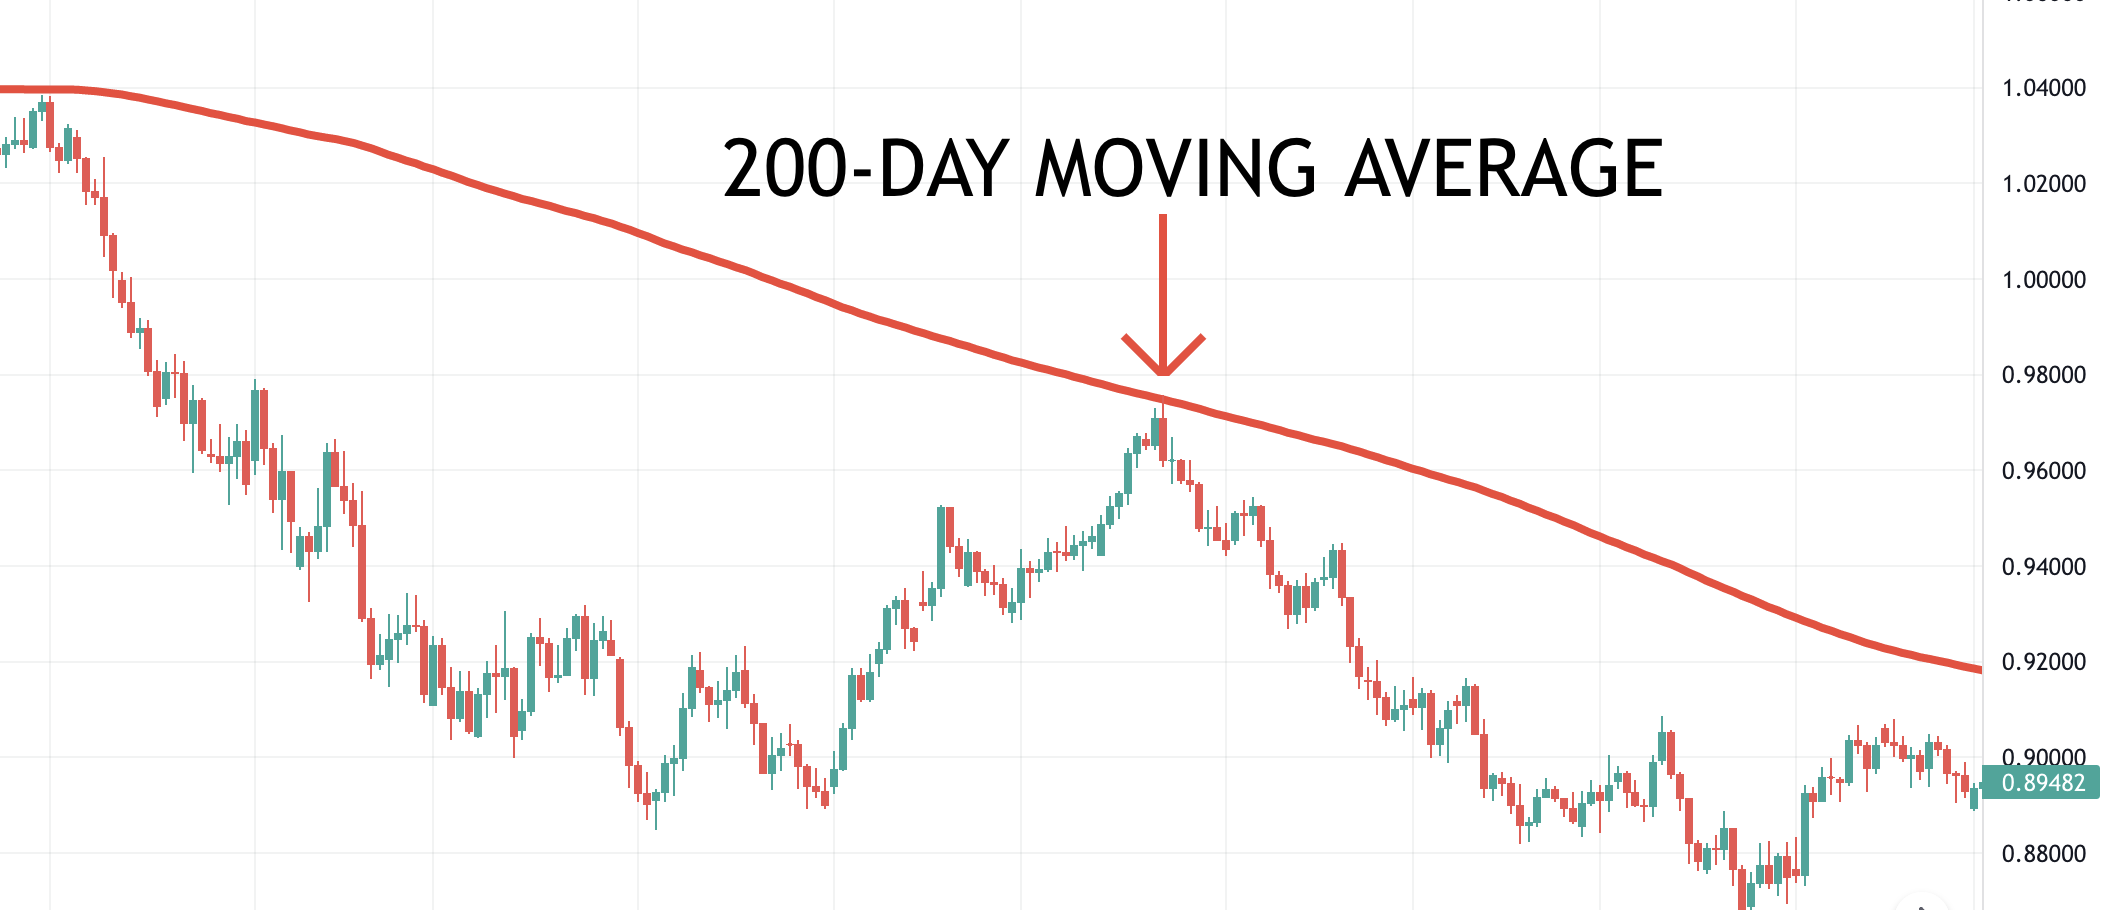
- Weak Trend: This trend is characterised by steep pullbacks that trade beyond 50MA but respect the 200MA. Both buyers and sellers are struggling for control.
Choosing where to enter a trade can be challenging as multiple entry points exist.
You need to select the best entry point based on your analysis.
Fortunately, by classifying the trend, you will know the area of value in the chart.
That will show you precisely the point of entering your pullback trade.
Pullback Trading Factor #3: Identify Your Area of Value
The area of value simply means where the potential buying or selling pressure comes in.
We use several indicators to identify the area of value.
Such as:
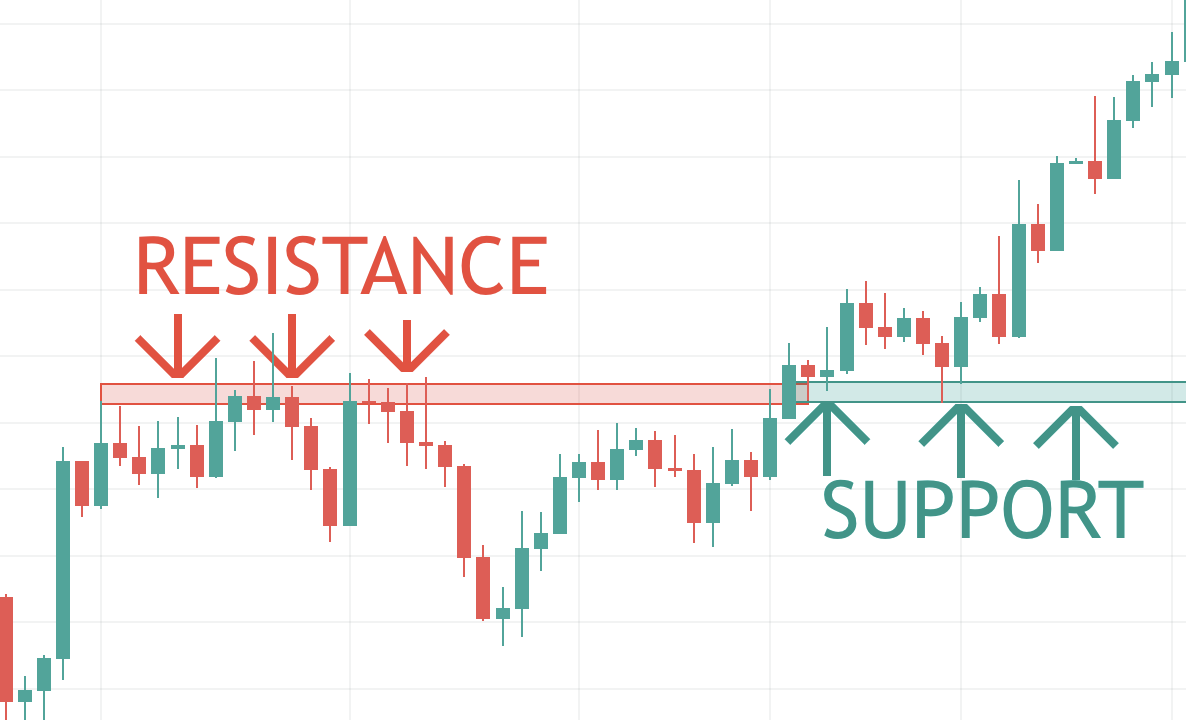
- Support and resistance: Support is the area in the chart where potential buying pressure comes in, pushing the price higher. On the other hand, resistance is where the potential selling pressure pushes the price lower.
- Trendlines
- Moving Averages
You identify an area of value as the point where you would buy low and sell high.
In an uptrend, the area of value is a location on the chart where pressure could force the price to move higher.
The area of value differ under the three classifications of trends;
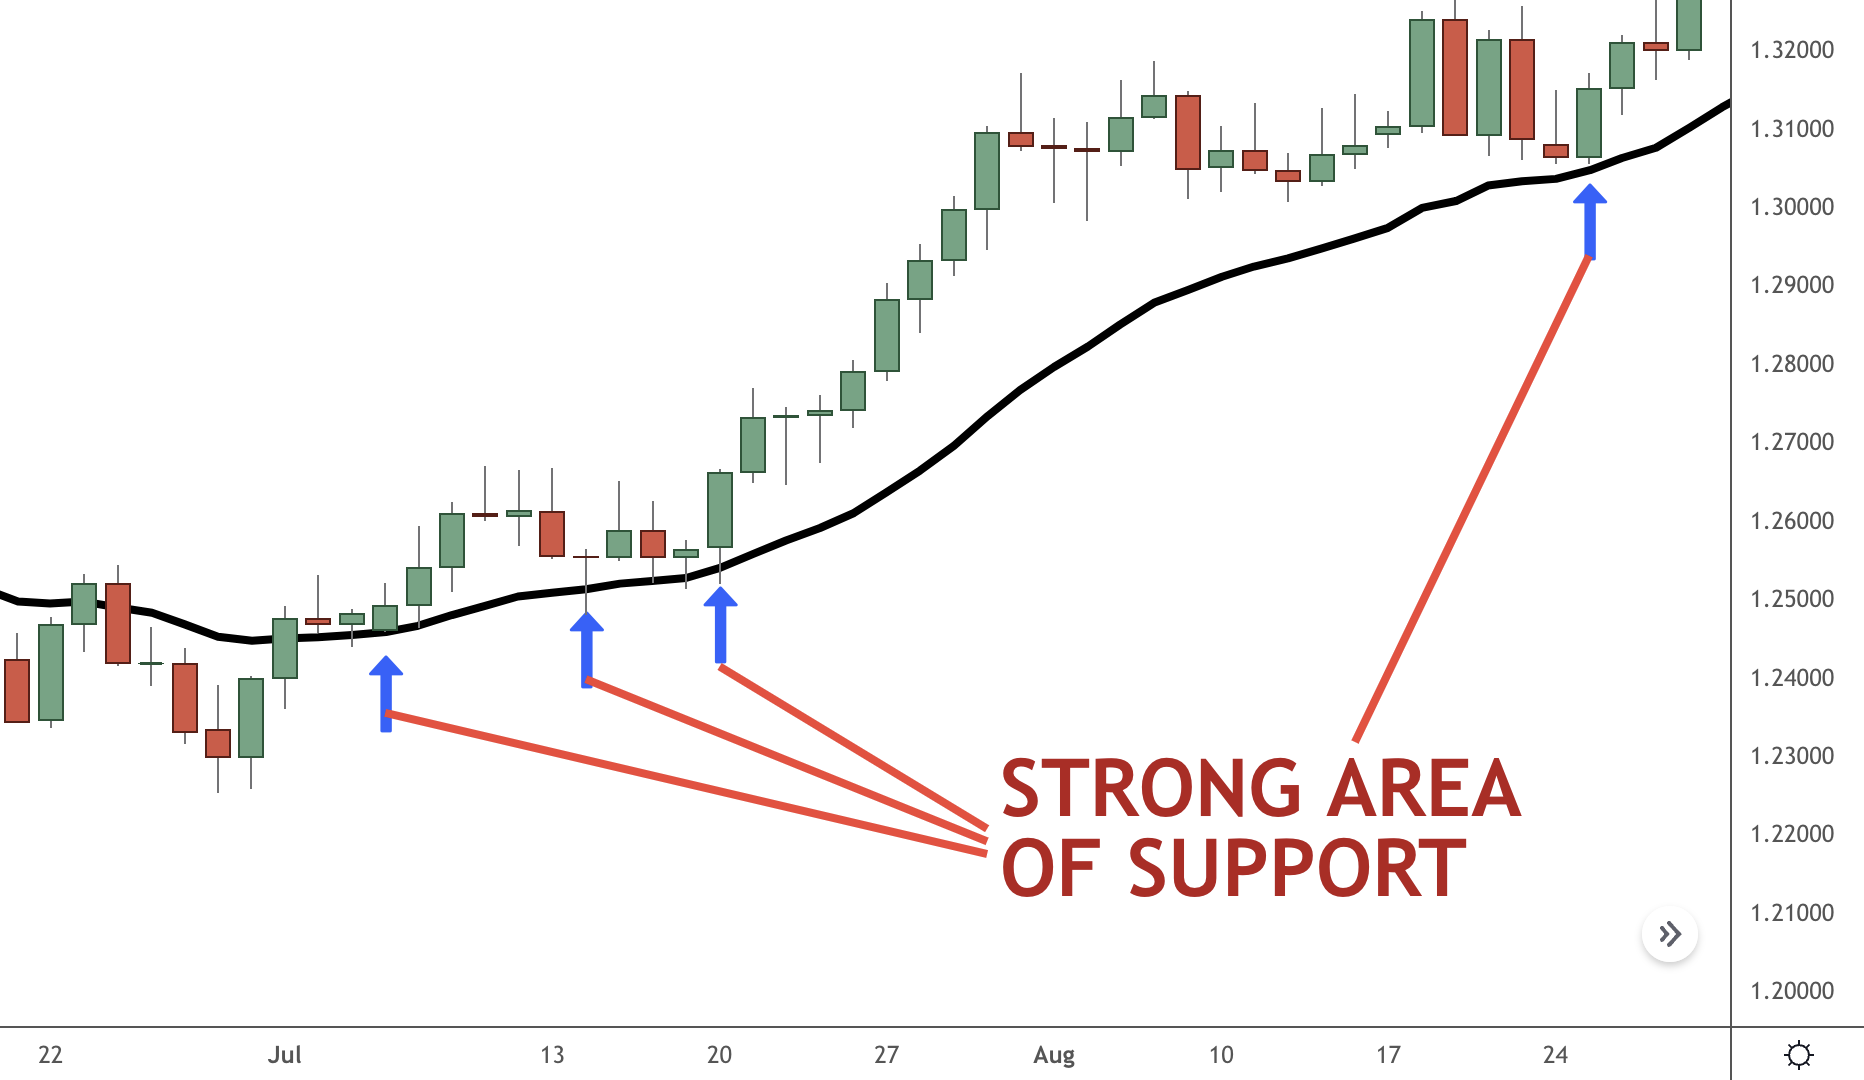
- Strong trend-the area of value is at the 20MA. Therefore, the 20MA is acting as the area of support as illustrated on the chart.
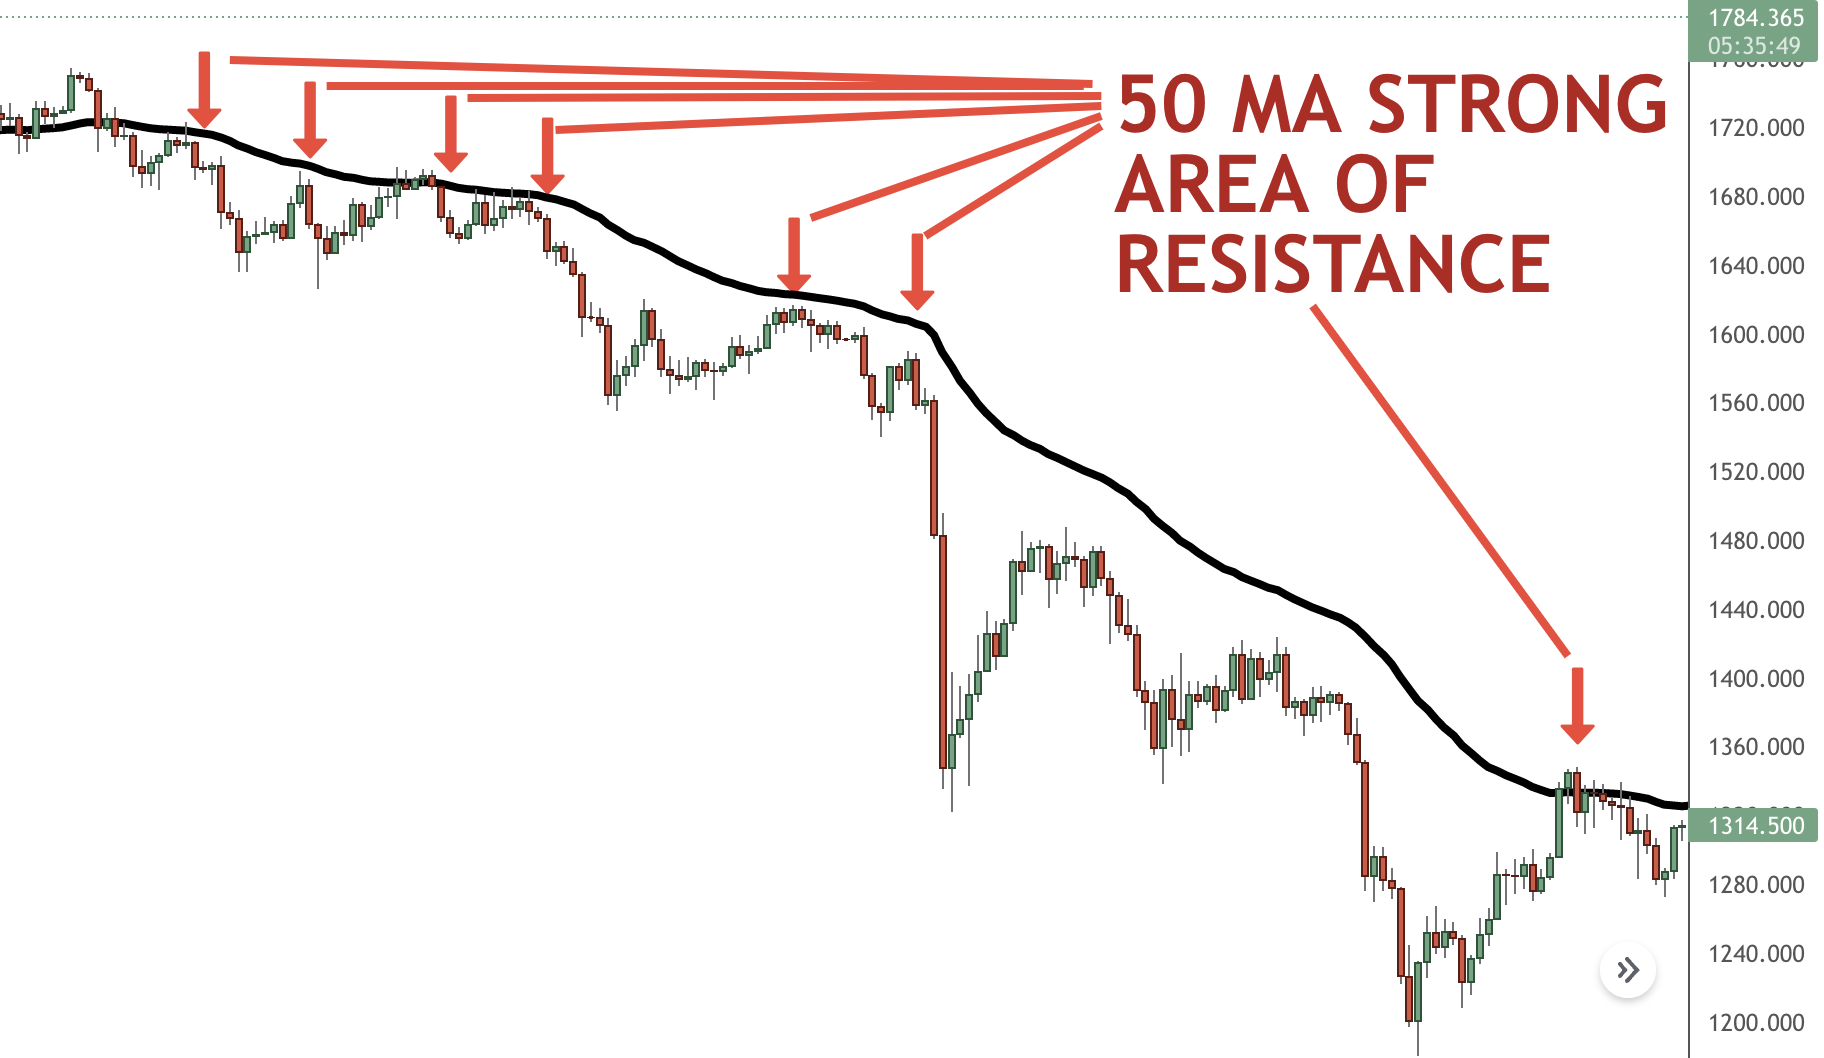
- Medium trend– the area of value is at the 50MA, or the previous resistance turned into support. Thus, the 50MA is acting as the area of resistance as seen in the chart below.
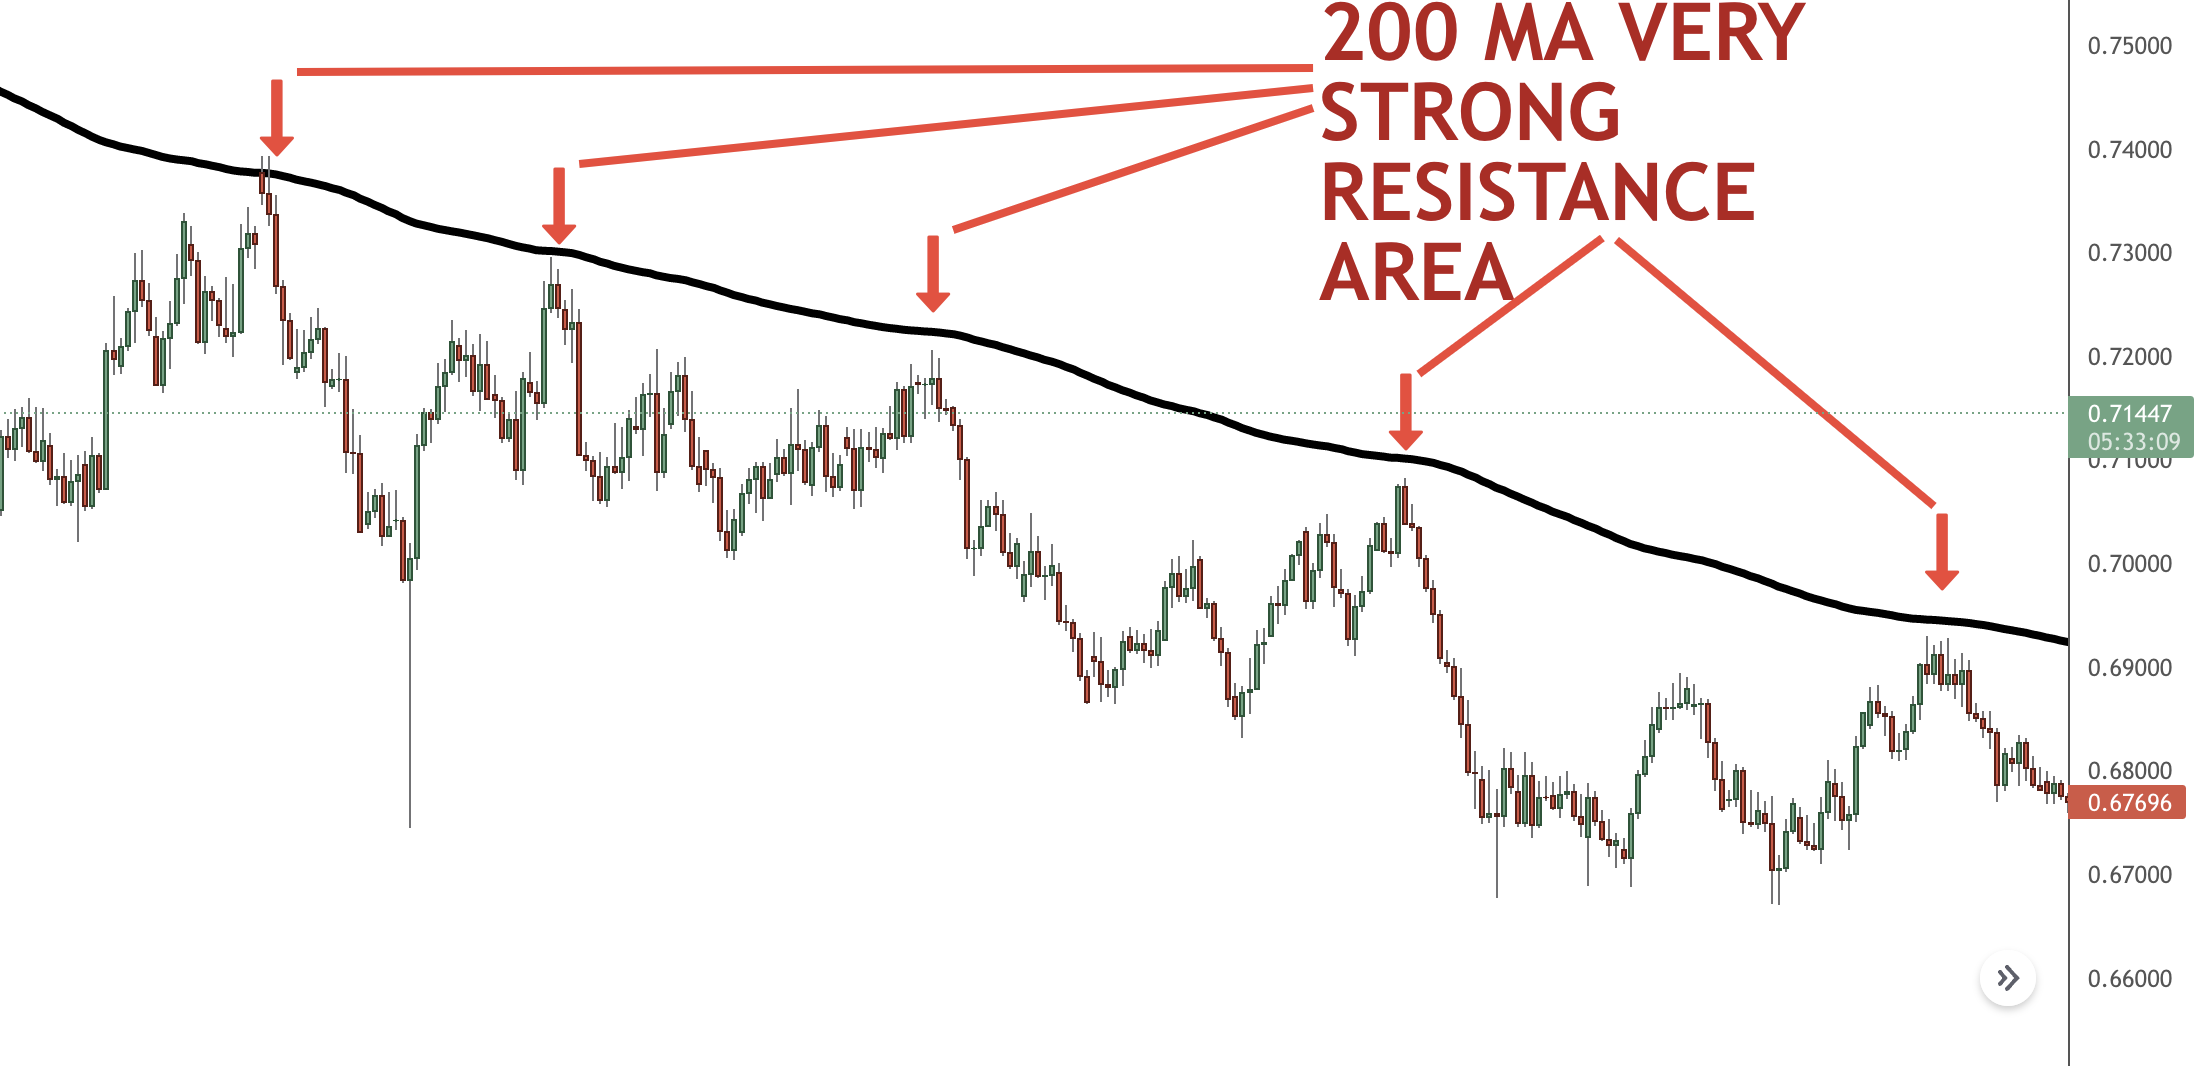
- Weak trend– the area of value is at the support or the 200MA. Here, 200MA acts as the area of resistance. See the graph below.
It is important to note that we are not dealing with a specific price level. So expect that the market might exceed your area of value before reversing it.
Pullback Trading Factor #4: Entry Trigger
At this point, as a pullback investor, your worry is when to get into a trade.
After meeting the first four conditions, you need a pattern to guide you into the trade.
Examples of such patterns include:
- Price rejection
- Reversal candlestick patterns
- Shooting star
- Hammer
- Bullish engulfing pattern
- Bearish engulfing pattern
We will proceed and look at the triggers under the three classifications of trends mentioned earlier:
- Strong Trend: Here, pullbacks are short-lived before the trend reverses. Remember, as discussed earlier, the market has shallow pullbacks for upward trends under this classification. Therefore, it is advisable to buy a breakout of the swing high, as shown below.
- Medium Trend: Pullbacks under this classification have good trends. The pullbacks could reset at 50MA or previous resistance turned support. These are the area triggers for buying. See the chart below for illustration.
- Weak Trend: Here, the pullback could reset at 200MA at the support mainly because it is deep. Therefore, make use of the indicators mentioned above to establish the entry triggers. See below.
Pullback Trading Factor #5: Exit if You’re Wrong
Trade is about gains and losses.
The market could move against you, hence the importance of knowing the exit point of trade on the chart.
You can easily identify your exit points using stop-loss orders.
Note that it is only logical for every trader to exit losing trades.
However, where do you exit?
See below for quick guidance.
- Strong Trend: The area of value is around 20MA. If the price breaks below that, it is time to exit the trade.
- Medium Trend: The area of value could be around the previous resistance turned support. Any price that breaks below the support level indicates that the area of value is compromised hence time to get out of the trade. Below is an illustration on the chart.
Pullback Trading Factor #6: Exit If You Are Right
Suppose the market moves just as you had anticipated.
You need to have an exit strategy to lock on the profits.
Below are guidelines on how to go about it under the three market conditions:
- Strong Trend: Because of the shallow pullbacks, it is advisable to ride the trend since holding on to your win is easy. Use the 20MA to trail your exit and close the trade only if the price closes below it.
- Medium Trend: Under such market conditions, the swing could indicate when to close the trade. Exit before the swing high. Another option is riding the trend using the 50MA but brace for more ‘pain’ due to the deep pullbacks.
- Weak Trend: Market conditions under the weak trend have deeper pullbacks that will likely stop you out of the trade. So avoid riding the trend instead, exit the trade at resistance or the previous swing high.
Pullback Trading Factor #7: Multiple Plans of Attack
We can equate this to having a plan B.
As a trader, you need to have multiple plans of attack in case the market does not behave as you had anticipated.
Thus, this approach still allows you to capture opportunities you would miss out on if the market behaved in the manner you’d like.
Final Thoughts on Pullback Trading
Trading pullback has been tested over time and proven among the most profitable trading strategies.
Its high success rate is because trade is in the prevailing trend.
But, unfortunately, it’s not as easy as it looks, especially for new traders.
Trading pullbacks requires skills and careful consideration of the above seven factors.
To succeed in the trade, you will need an effective trend trading strategy, proper risk management, and discipline to succeed.
Then, combine that with the use of analysis tools independently or together to develop stronger signals.
Pullback Trading FAQs
- Are pullbacks profitable
Yes. Pullback trading is highly profitable. This is because the trading method is in the direction of the prevailing trend.
- What is a pullback in trading
A pullback is a minor temporary movement against a price trend.
- How do you identify pullbacks
Pullbacks can be uptrend or downtrend. Uptrend when the price on the left is lower than those on the right leading to higher highs and higher lows. Downtrend when the price of the left is higher than that on the right resulting in lower highs and lower lows.
- When should l buy pullbacks
The best time to buy a pullback is after security has experienced a significant, upward price movement.