


Supply and Demand Zones (Ultimate Trading Guide)
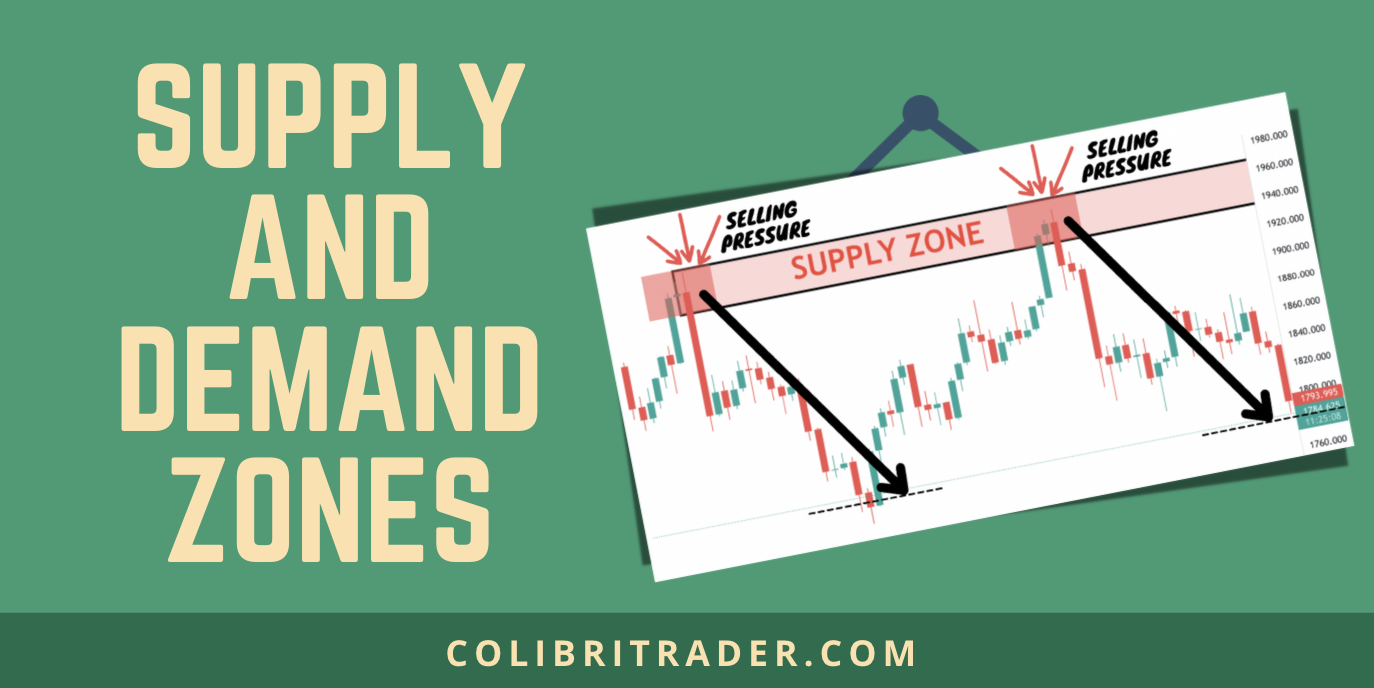
Supply and demand zones are those levels in trading that attract most buyers and sellers.
This is probably the simplest explanation you will find online.
In this article, I will walk you through all of the pros and cons of using supply and demand zones.
I will teach you how to use them and more importantly, I will show you real trading examples as seen through my eyes.
What are we waiting for….
Let’s dig in…
***GET THE ALGO TRADER CHEAT SHEET HERE [FREE DOWNLOAD]
Contents in this article
- What are Supply Zones
- What are Demand Zones
- Supply and Demand Zones And Candlesticks
- Support and Resistance vs. Supply and Demand Zones
- Supply and Demand Zones Variations
- Rally-Base-Rally (Micro Demand Zone)
- Drop-Base-Drop (Micro Supply Zone)
- Recapping the 4 Supply and Demand Zones Patterns
- Supply and Demand Zones- Pulling The Trigger
- Trading with Supply and Demand Zones Benefits
- Wrapping It All Up
What are Supply Zones
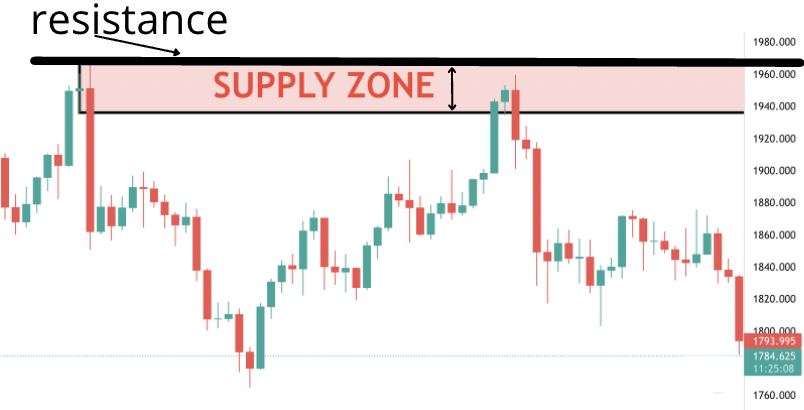
A supply zone is most easily described as a large area of resistance.
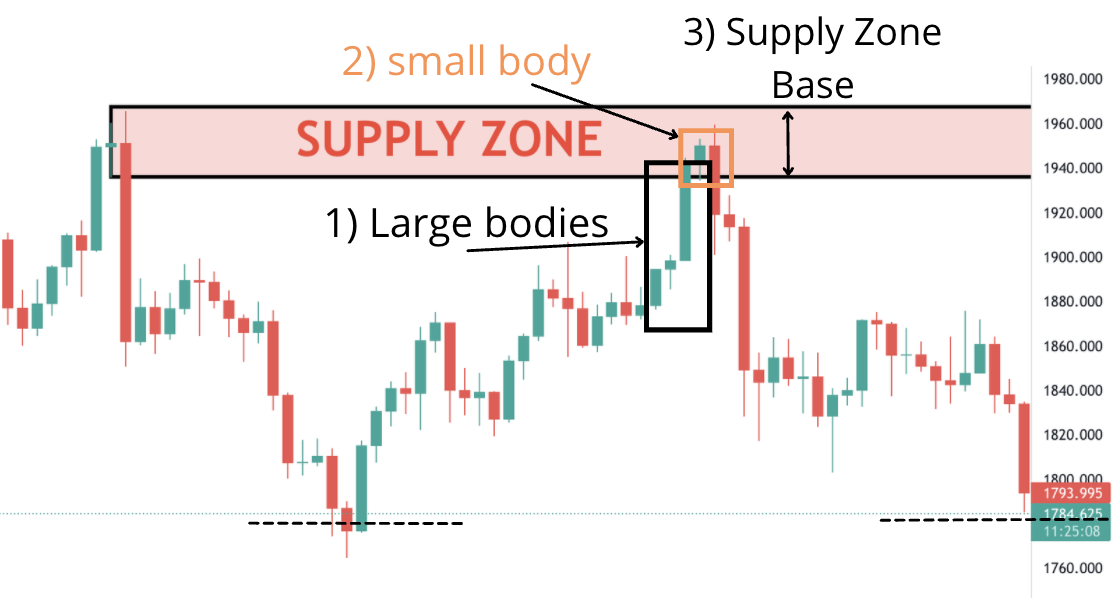
Here is an example of a supply zone:
For a supply zone to be validated, we will need to meet 3 criteria, also known as the triple S (SSS).
- Successive large bullish candles
- Small bodies (bullish or bearish) or wicks (this is where price starts a large move)
- Supply Zone Base (establish where the base is located)
Once you tick all of these three criteria, then your supply zone is established.
Ready to do that?
Here it is, as easy as 1-2-3:
By the way, here is another beginner-friendly article on what are Supply and Demand Zones and how to trade with them.
1) Successive Large Bullish Candles (Beginning of a supply zone)
As you can see from the illustration above, we need a succession of green (bullish) candles (marked with the black rectangle.
Here is the zoomed-in version:
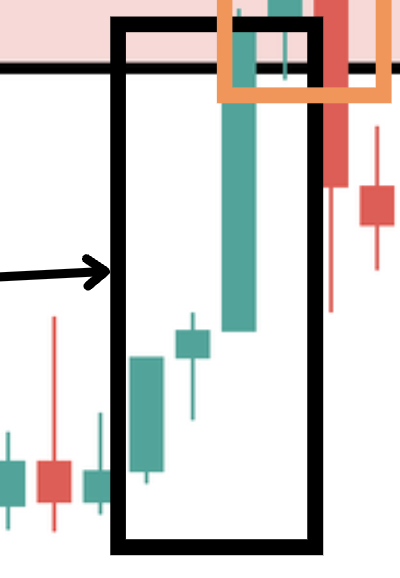
Remember: Sometimes the bullish move can come from just a single large candle.
Other times, there are a few candles appearing one after another.
What you need to know is that there needs to be this final bullish push toward the top.
2) Small Bodied-Candles/Wicks Marking The Beginning of The Supply Zone
From the image above, you can see the orange rectangle that marks this place in the chart.
Let’s zoom in now:
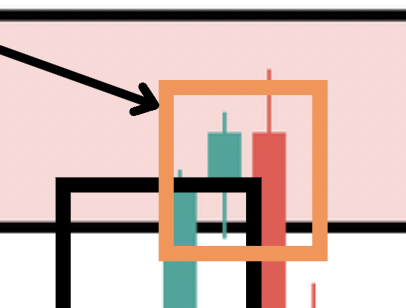
This is the final confirmation that you’ll get before establishing the supply zone.
And in this case, we firstly have a small-bodied candle, that is secondly followed by a long red wick from the next candle’s bullish rejection, which gives an even nicer confirmation.
3) Supply Zone Base- Establish Where The Zone is Located
As we can see from the illustration above, the supply zone is located at the inflection point of the bullish green candle and the small-bodied candle.
It is the best confirmation of the end of an existing trend and the beginning of a new one.
Makes sense?
It is like playing tennis.
The moment where the ball touches the net is the moment where money exchanges hands in the markets.

Turning from bullish to bearish and changing the general direction.
This is the beginning of the supply zone and the end of the previous trend.
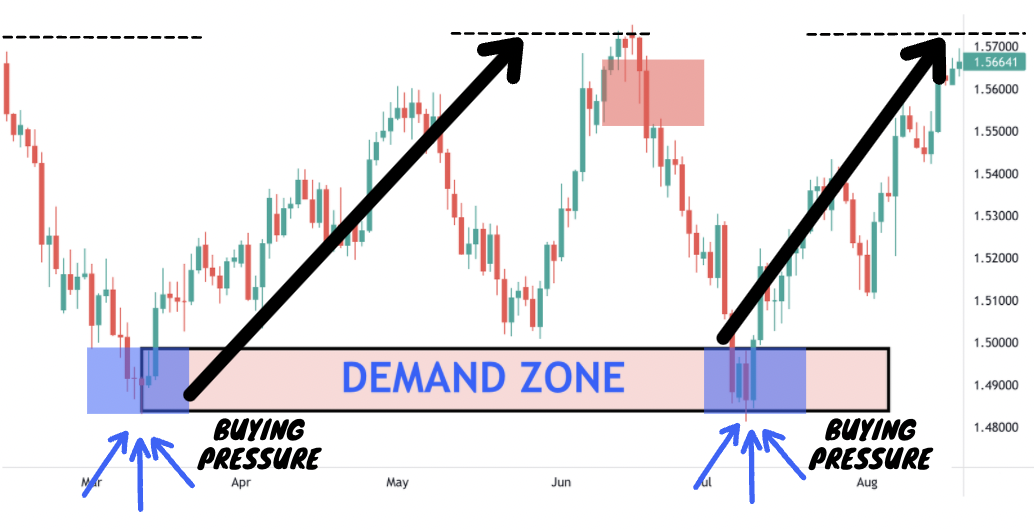
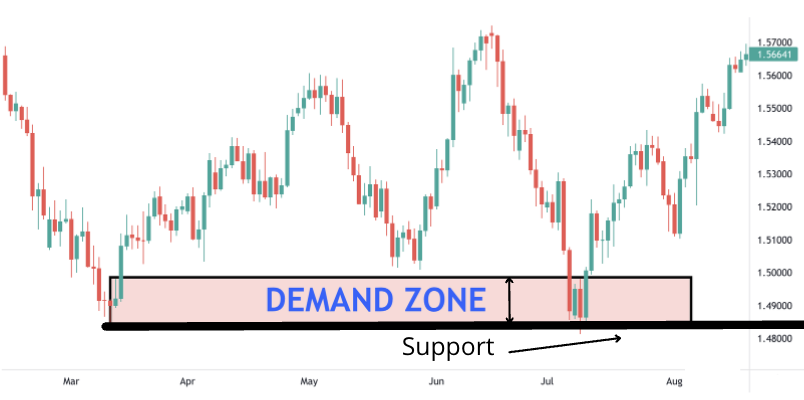
What are Demand Zones
The opposite of a supply zone is a demand zone.
This is an area that has a high concentration of buyers.
It is always very similar to a large area of support.
Demand Zone Example:
For a demand zone to be validated, we will need to meet 3 criteria, also known as the triple S (BBB).
- Bullish Large Candle(s)
- Body Of The Last Candle Needs to be Small (Bullish or Bearish)
- Base Confirmation
Once you have all these three boxes ticked, your demand zone is established.
Let’s get into the details now:
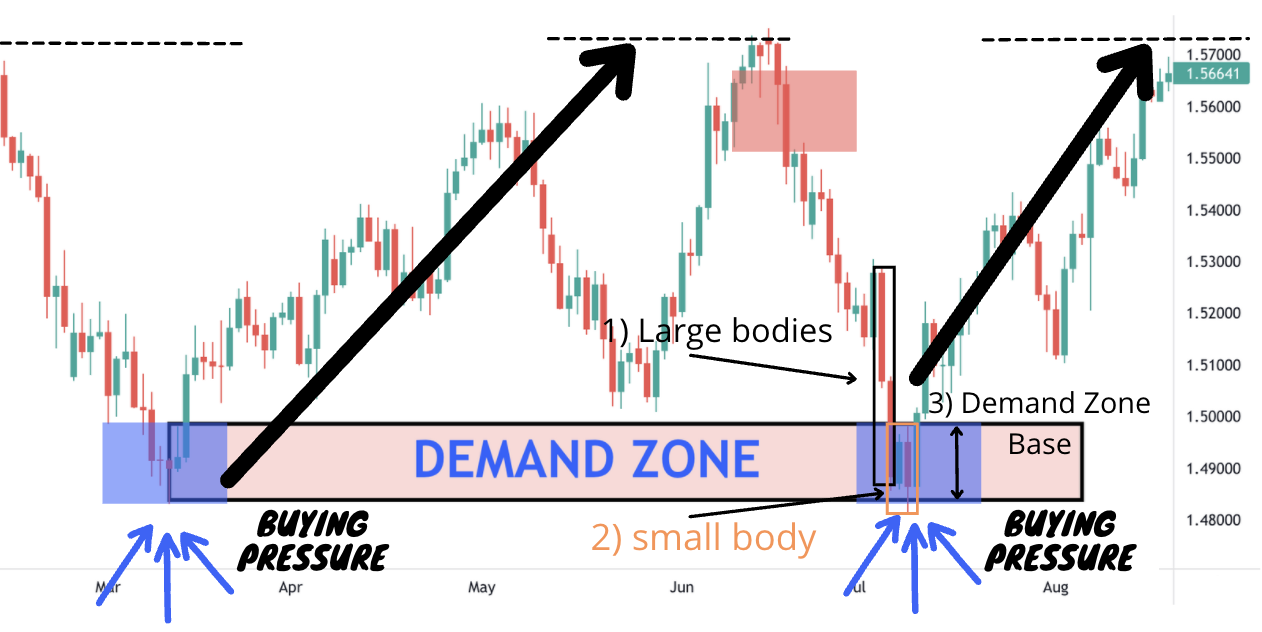
1) Bullish Large Candle
Just like establishing a supply zone, finding a demand zones requires the presence of a large candle.
As you can see from the black rectangle above, there are 2 large bearish candles, which are the first indication of a demand zone.
Here is the zoomed in version:
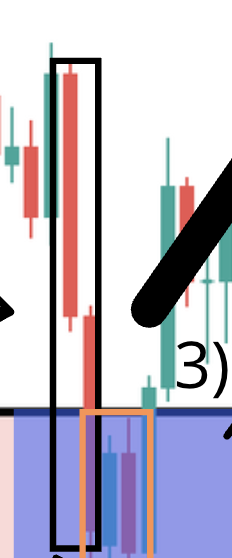
Here, we have the first indication that a demand zone might be imminent.
2) Body Of The Last Candle Needs to be Small (Bullish or Bearish)
As with supply zones, demand zones need this second confirmation to validate them.
The small bodied candle at the end of the move (and sometimes the bearish wicks) is a very important sign of a demand zone.
In this example, we have both: 1) a small-bodied candle and 2) bearish wick
Let’s see now:
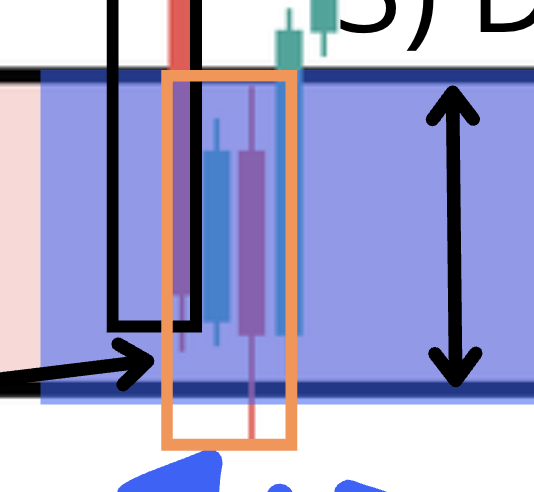
All is present and the last bit of information we are looking for is the base.
3) Base Confirmation
As we can see from the illustration above, the demand zone is located at the inflection point of firstly the bearish red candle and secondly the small-bodied candle.
Remember the tennis example from above?
This is the moment, when you can clearly see where the demand zone is based.
Acting like a magnet for buyers, this zone is what will move price, acting almost like a magic field.
Supply and Demand Zones And Candlesticks
Knowing how to read candlesticks comes very handy when trading with supply and demand zones.
As you have seen from above, understanding candlesticks is the same as understanding the psychology of the market players.
I have a full dedicated article on CANDLESTICKS in case you need to refresh your knowledge.
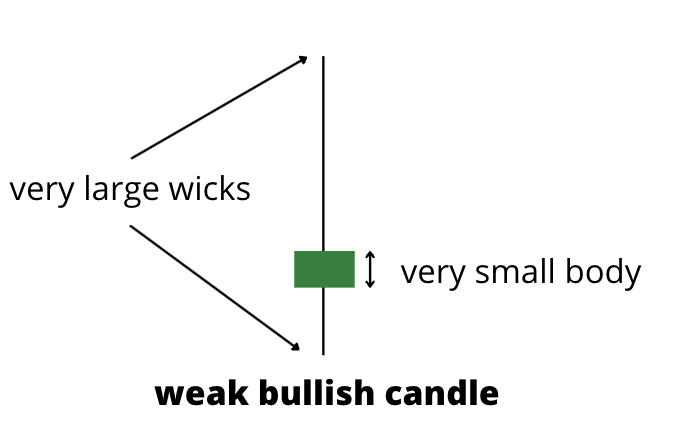
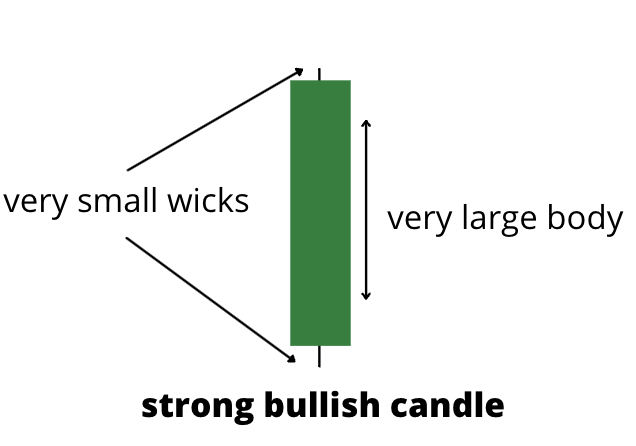
Quick tip #1: A large bodied candle means that there is a lot of interest (buying or selling).
Quick Tip #2: A small-bodied candle means that the interest is diminishing.
When you combine both, you have a very powerful trading tool in your hands.
Here are a few candles, which could come handy when trading with Supply and Demand Zones:
I strongly recommend that you familiarise yourselves with those candlesticks, since they are the most commonly used ones amongst supply and demand traders.
Here is just a quick glance at the structure of a candle:
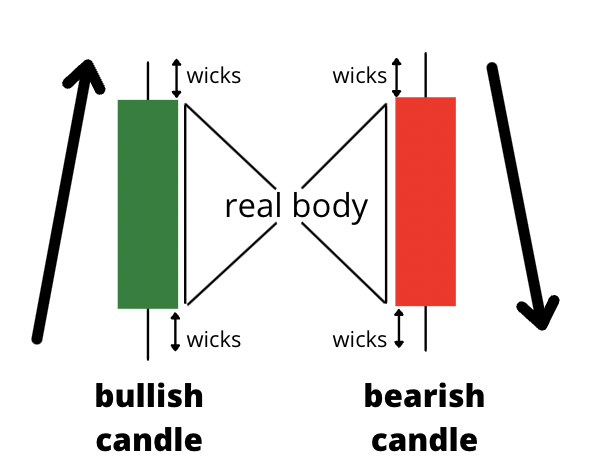
For the ones of you who are familiar, please jump to the next section.
Example #1: This is a very small candle, which is also synonymous with weak market action:
Example #2: Here is a very large candle, which is synonymous with a very strong market sentiment.
Make sure you know the difference, because for finding the right supply and demand zones, it is essential that you can read the market behaviour.
Support and Resistance vs. Supply and Demand Zones
When it comes to differentiating between support and resistance and supply and demand zones, there is one major difference.
Support and resistance are a SINGLE LINE.
Supply and demand zones as the name implies are ZONES.
This is best shown with an image:
Same is valid for a demand zone and a level of support:
Apart from that, there are no major differences.
On the other side, there are different variations of both.
For example…
Some traders prefer to use the close of a candle… whereas others prefer to use the high/low of a candle.
Supply and demand traders are facing the same issues.
So what is the right answer?
There is not an easy answer. It really depends on the market conditions and the place of the chart where those levels occur.
I do spend a lot of time teaching how to identify those levels the right way in my Ultimate Supply and Demand Course.
Supply and Demand Zones Variations
So far, I have covered the most common supply and demand zones.
But as with anything else trading related, there are different ways to trade with supply and demand.
After defining the two main types of supply and demand zones, let’s explore a few more variations of these levels.
Are you ready?
Rally-Base-Rally (Micro Demand Zone)
Here is an example of a rally-base-rally.
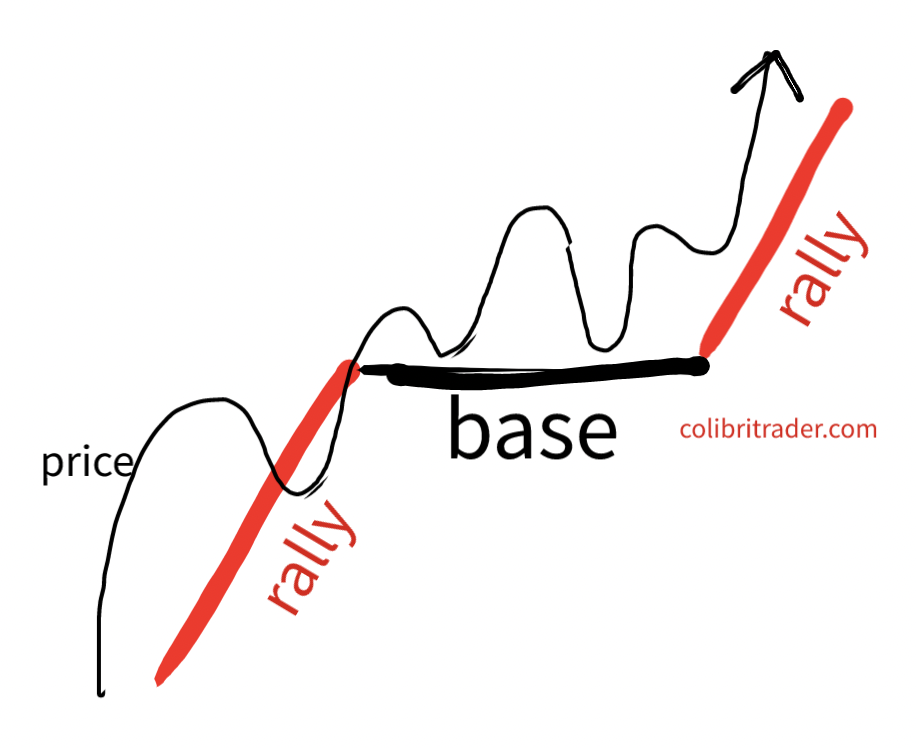
This is the third most famous type of a demand zone application.
Let’s have a look at a real price chart and put this into context:
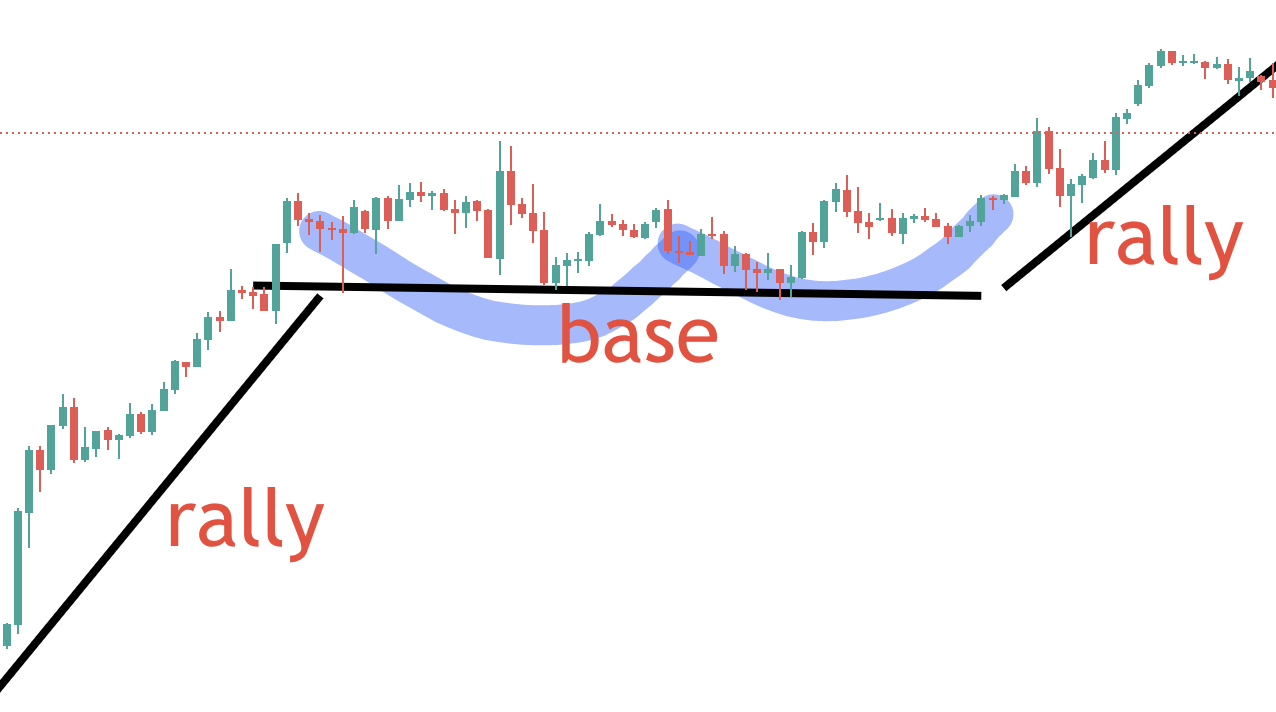
This is known as a rally-base-rally pattern or also known as a micro demand zone.
We have a chart that is in an uptrend.
Then, after a while, the uptrend makes a natural correction.
This is where some trading opportunities make themselves available.
Et voila!
Real Trading Example Below:
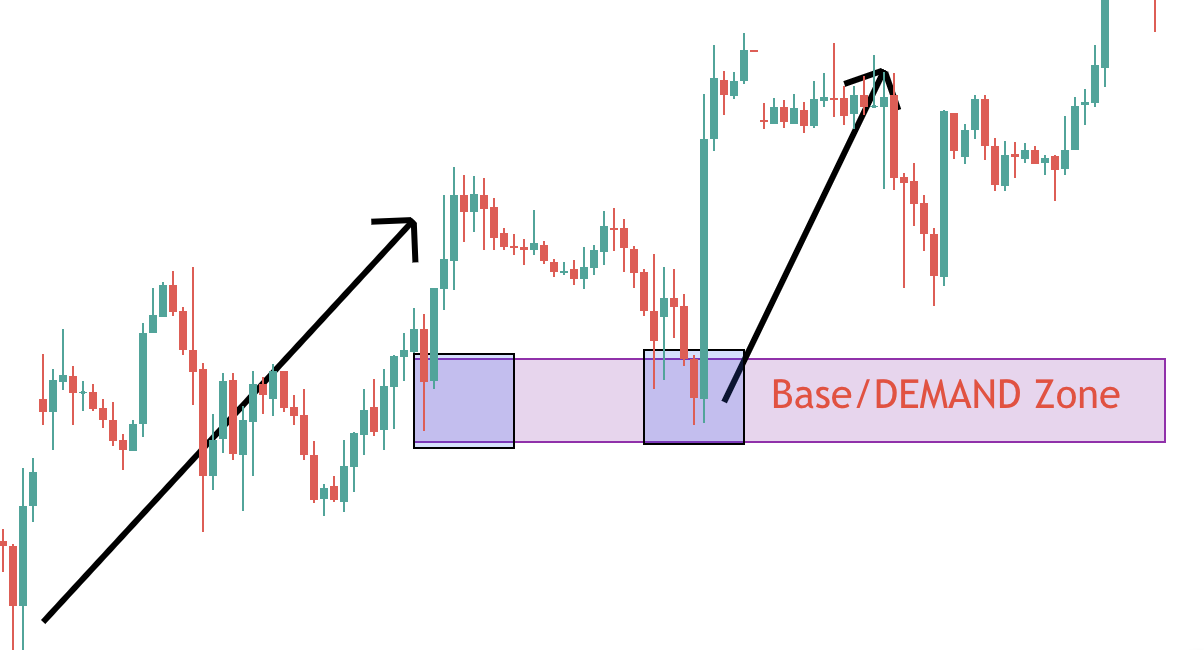
In this example, we have an uptrend and a bearish wick, which is the beginning of the demand zone establishment.
From here, price re-tests one more time the demand zone and then skyrockets forming a rally-base-rally pattern.
Drop-Base-Drop (Micro Supply Zone)
Very similar to the rally-base-rally, the drop-base-drop is a supply zone pattern.
It does form in downtrends.
Here is how it looks:
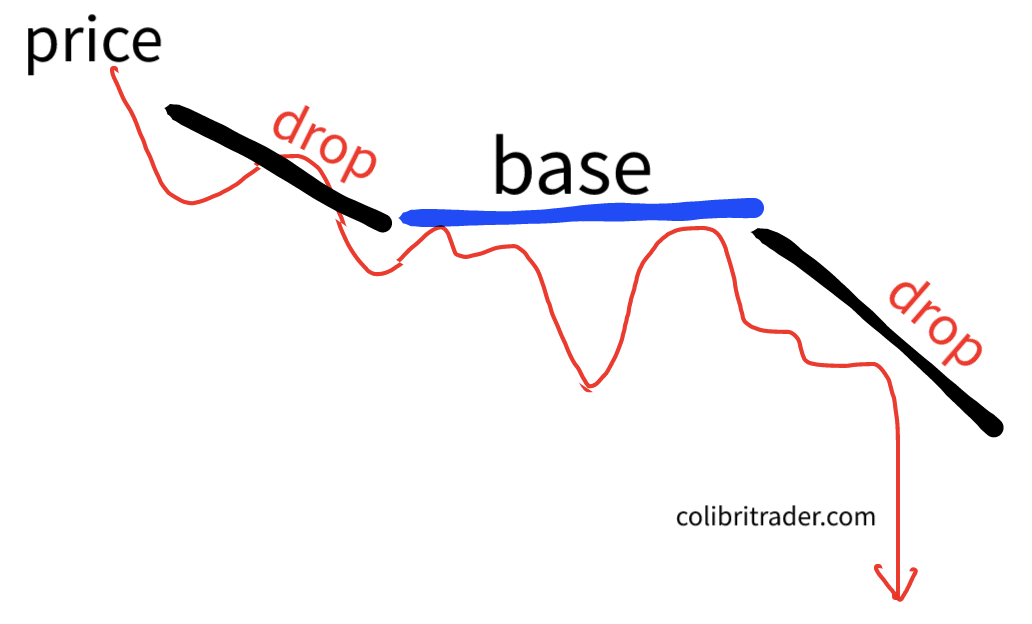
This is the last fourth variation of trading with supply and demand zones.
It is essential that we have a downtrend.
After the price has built some momentum, it makes a correction and this is where you will find the opportunities.
The micro supply zone will form in this area.
Being the first to spot it can pay back very high dividends.
Real Trading Example Below:
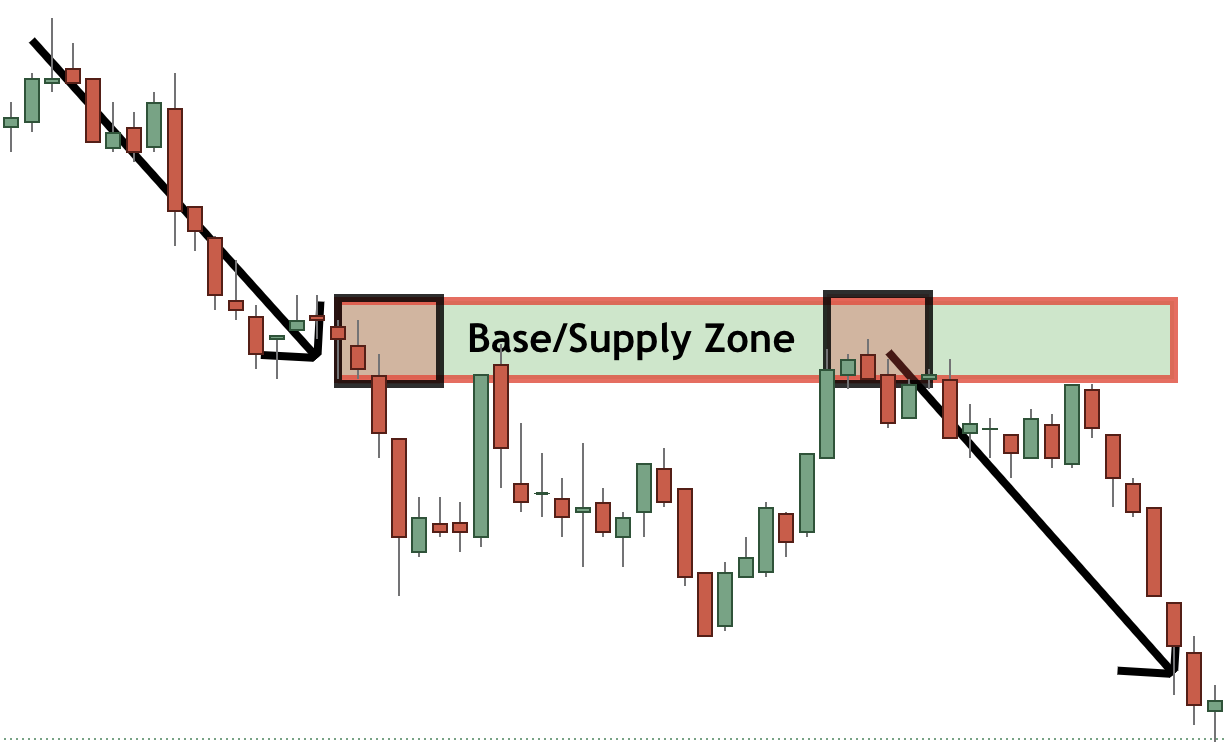
In this example, there is a downtrend.
After the price makes a correction, it forms a base by a few small-bodied candles, which are followed by large red candles.
This gives enough confirmation, so that one can establish the base of this micro supply zone.
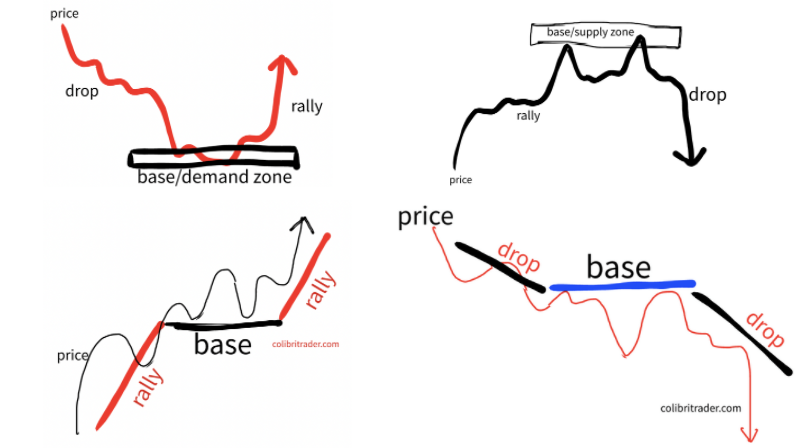
Recapping the 4 Supply and Demand Zones Patterns
We have examined so far 4 different patterns in supply and demand trading.
As you can see, there is a lot to absorb, but once you get the logic behind, it all fits in nicely.
Quick tip: Always look for large candles followed by a small-bodied candle or larger than usual wicks.
These are the so-called “inflection points” and they are the building blocks of the supply and demand zones.
Just to recap, the 4 major types of supply and demand zones are:
1) Major Supply Zone– REVERSAL
2) Major Demand Zone– REVERSAL
3) Rally-Base-Rally (Micro Demand Zone)- CONTINUATION
4) Drop-Base-Drop (Micro Supply Zone)- CONTINUATION
Supply and Demand Zones- Pulling The Trigger
Making a trading plan when trading with supply and demand zones is not an easy task.
There are a lot of factors to consider.
Firstly, there are different ways to approach trading with supply and demand zones.
Some prefer to use price action methods (like myself).
Or even better, here is how you can master price action trading with supply and demand.
Others are incorporating indicators (which I have never find very profitable).
Whatever method you pick, you will need to adhere to strict money and risk management rules.
“Never risk more than 1-2% on a trade!”
I am sure you have heard this already trading maxim already.
Do not want to sound repetitive, but it is as important as it is a cliche.
Supply and Demand Setup
First things first!
Find the supply or demand zone and dig your way from there.
Let’s take an example of a price chart.
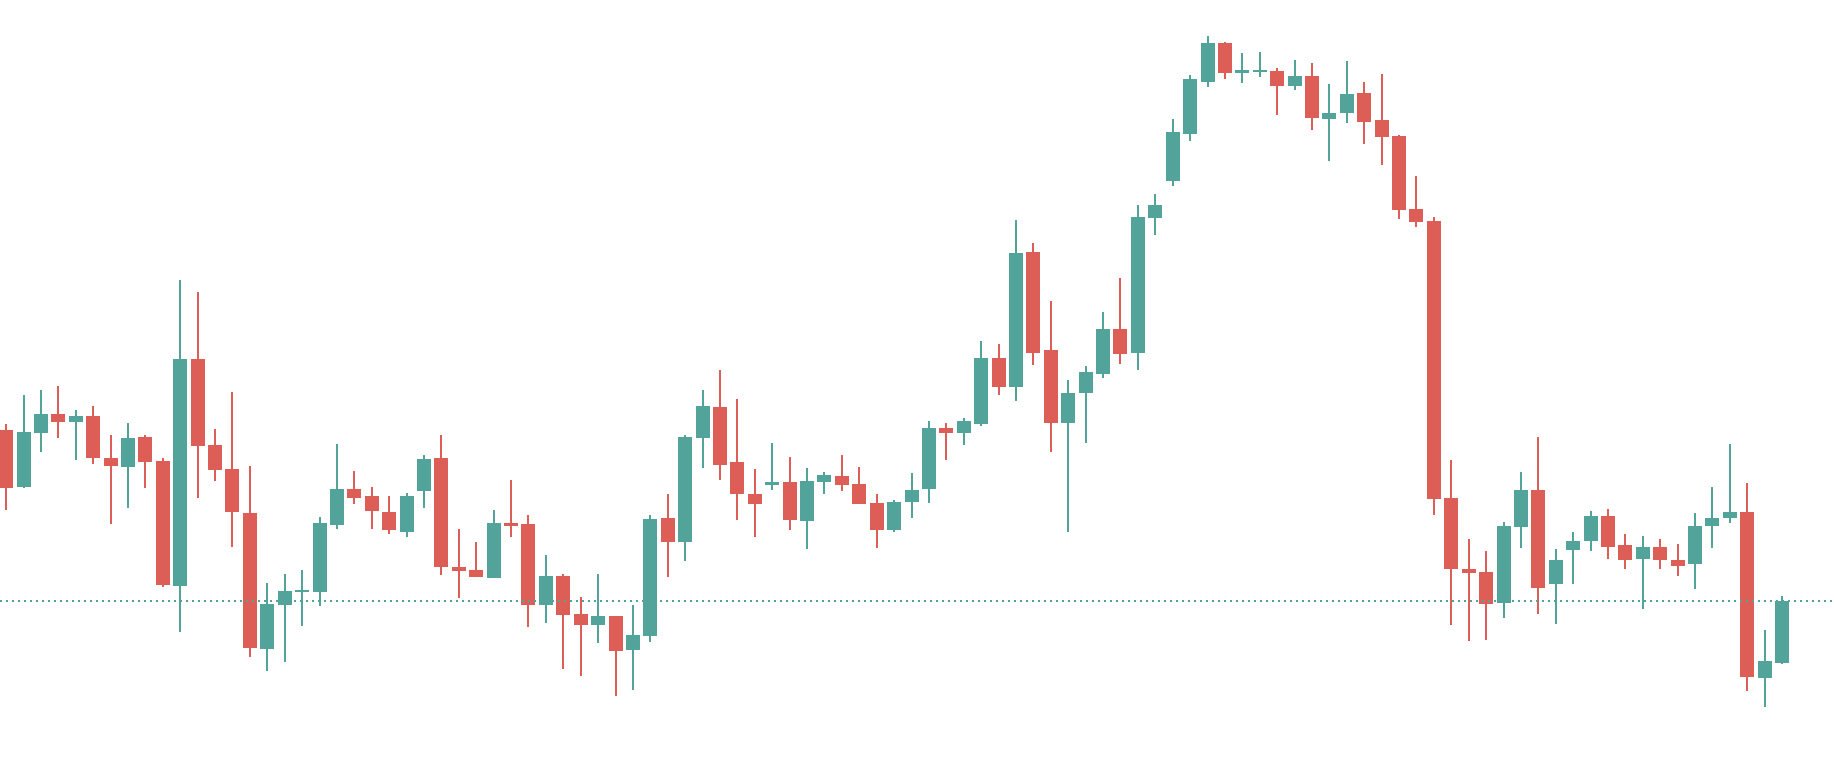
Here is the price chart of Dow Jones.
Where is the demand zone on this chart?
Here is the solution:
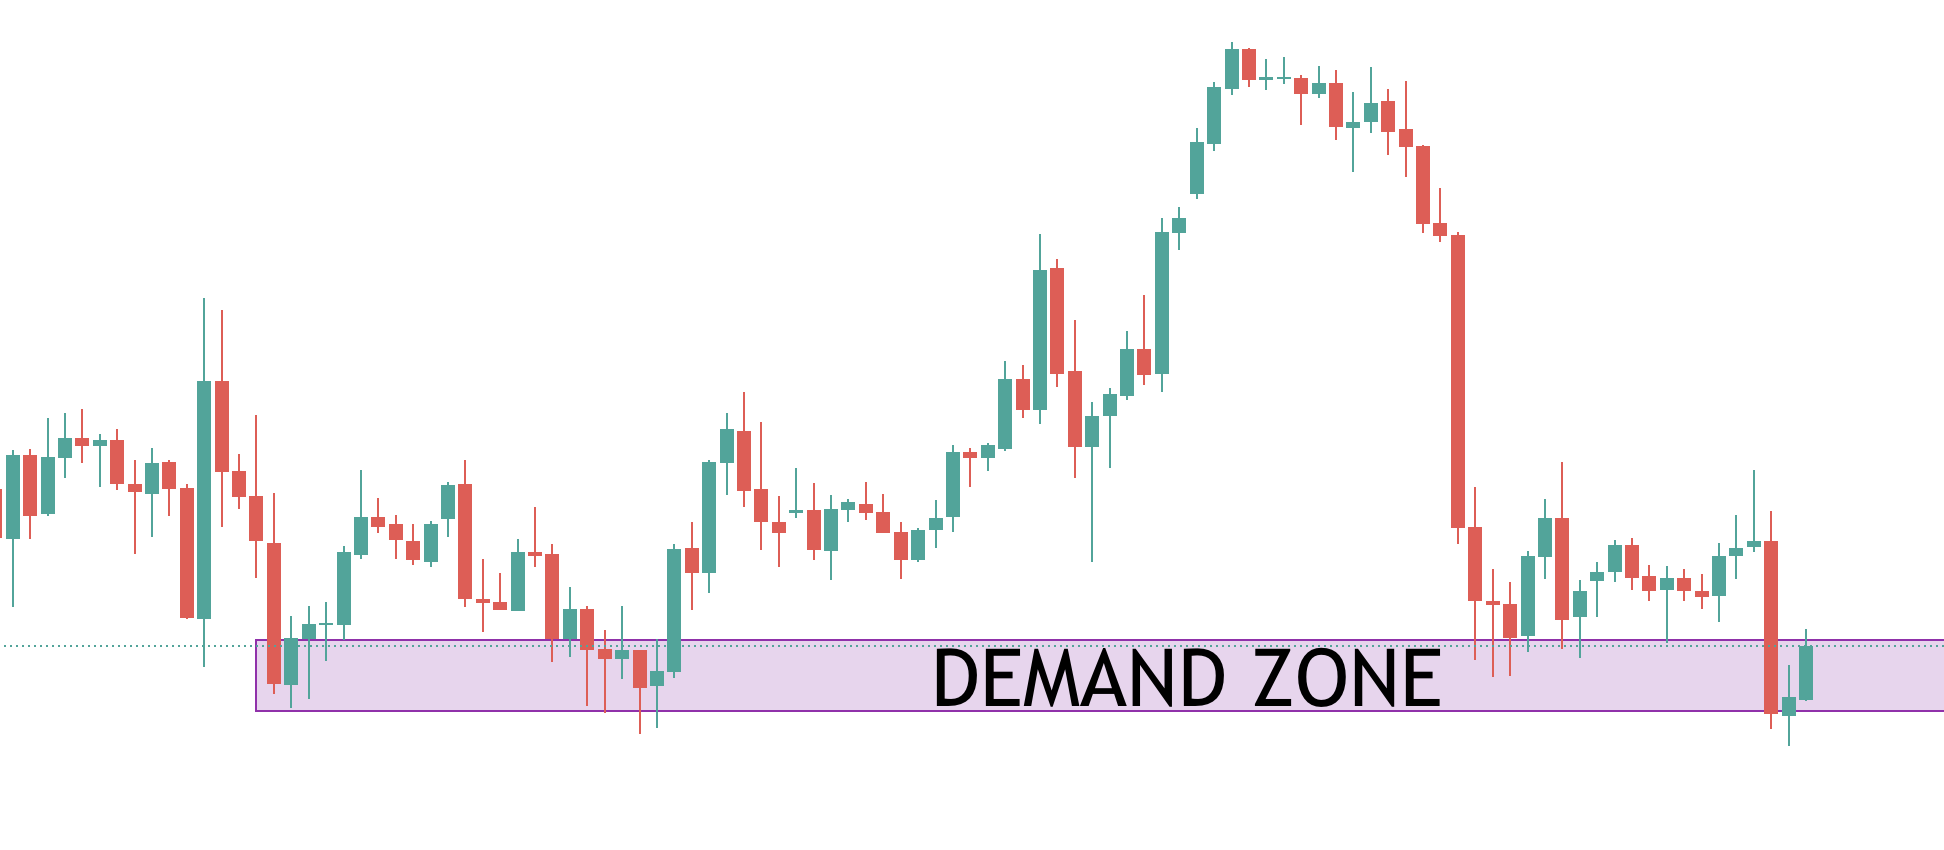
From this chart, you will need to pinpoint a place, where you can enter into a long trade.
Pro tip: Demand Zone equals bullish behaviour (pro traders are buying only when all the stars align)
Supply and Demand Entry
From here, it is up to us to decide where to go long.
We have established the demand zone and next thing is to have a confirmation from price action (or the indicators in use).
Since, I am a price action trader, I will go with the latter option.
For that, I am switching to a lower timeframe and looking for my trigger.
This appears right here, where an inside bar has nicely enfolded itself into the previous candle.
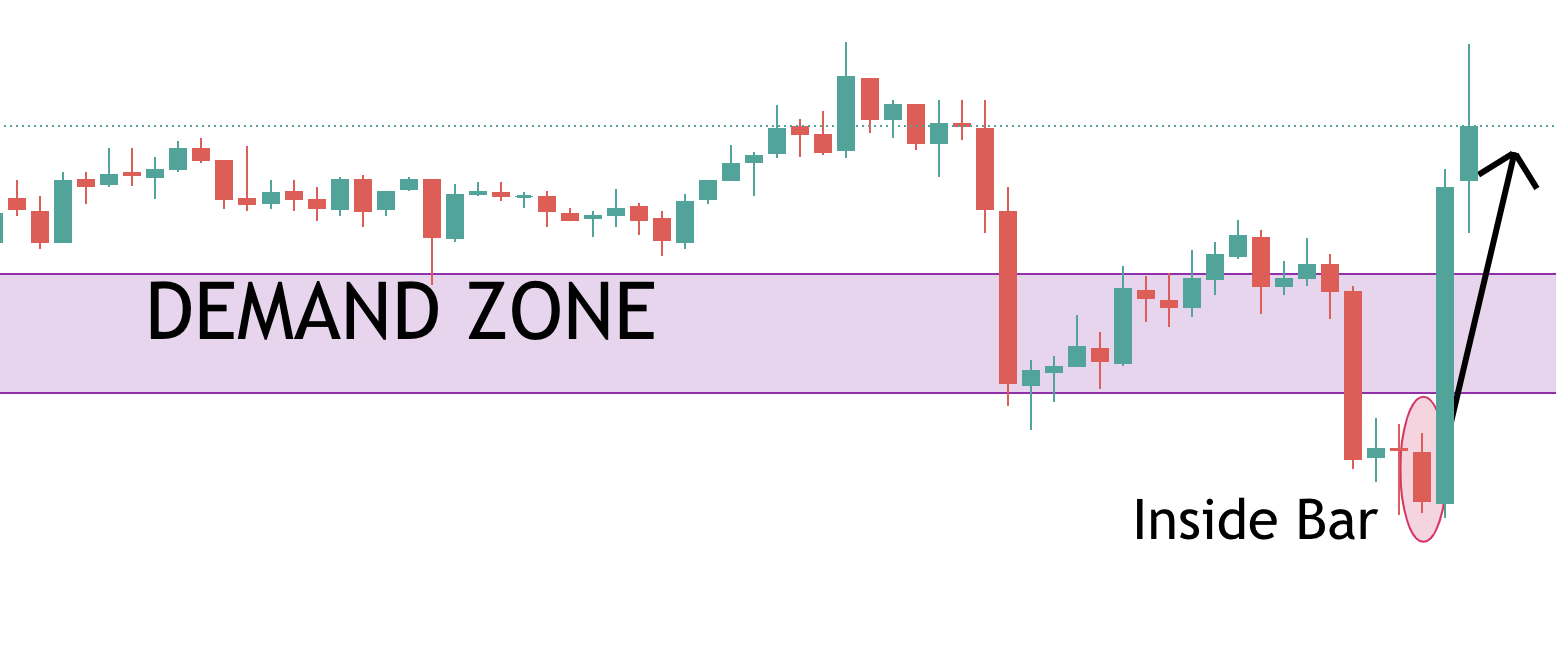
Wow!
Price does not wait for a long time to confirm this demand zone.
We have a trigger!
Lastly, we need to answer two questions:
Question #1: What is our target?
Questions #2: Where is our stop loss?
Trading Targets with Supply and Demand Zones
Here comes the interesting part.
Profit taking!
On this particular chart, we have two major levels that supply and demand traders will be looking at.
Let’s see which ones are they:
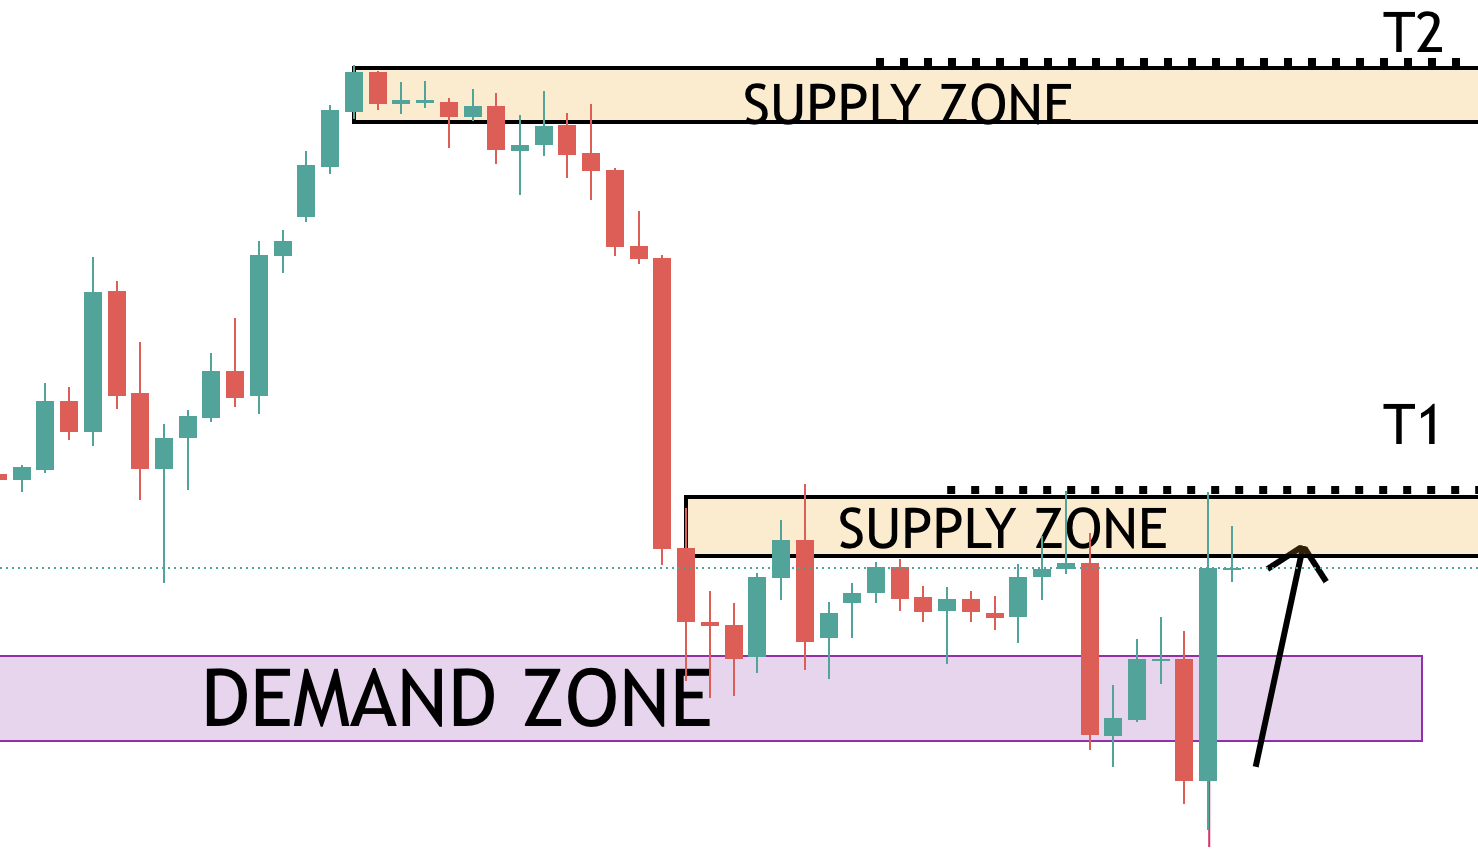
Level T1 is the first target, which is a micro supply zone
Level T2 is the next major supply zone.
It would depend on the rules of a system, but most typically these are the two major levels that supply and demand trader will be looking at.
What about stop losses?
Stop Loss With Supply and Demand Trading
Let’s have a look at the lower timeframe, where the inside bar occured.
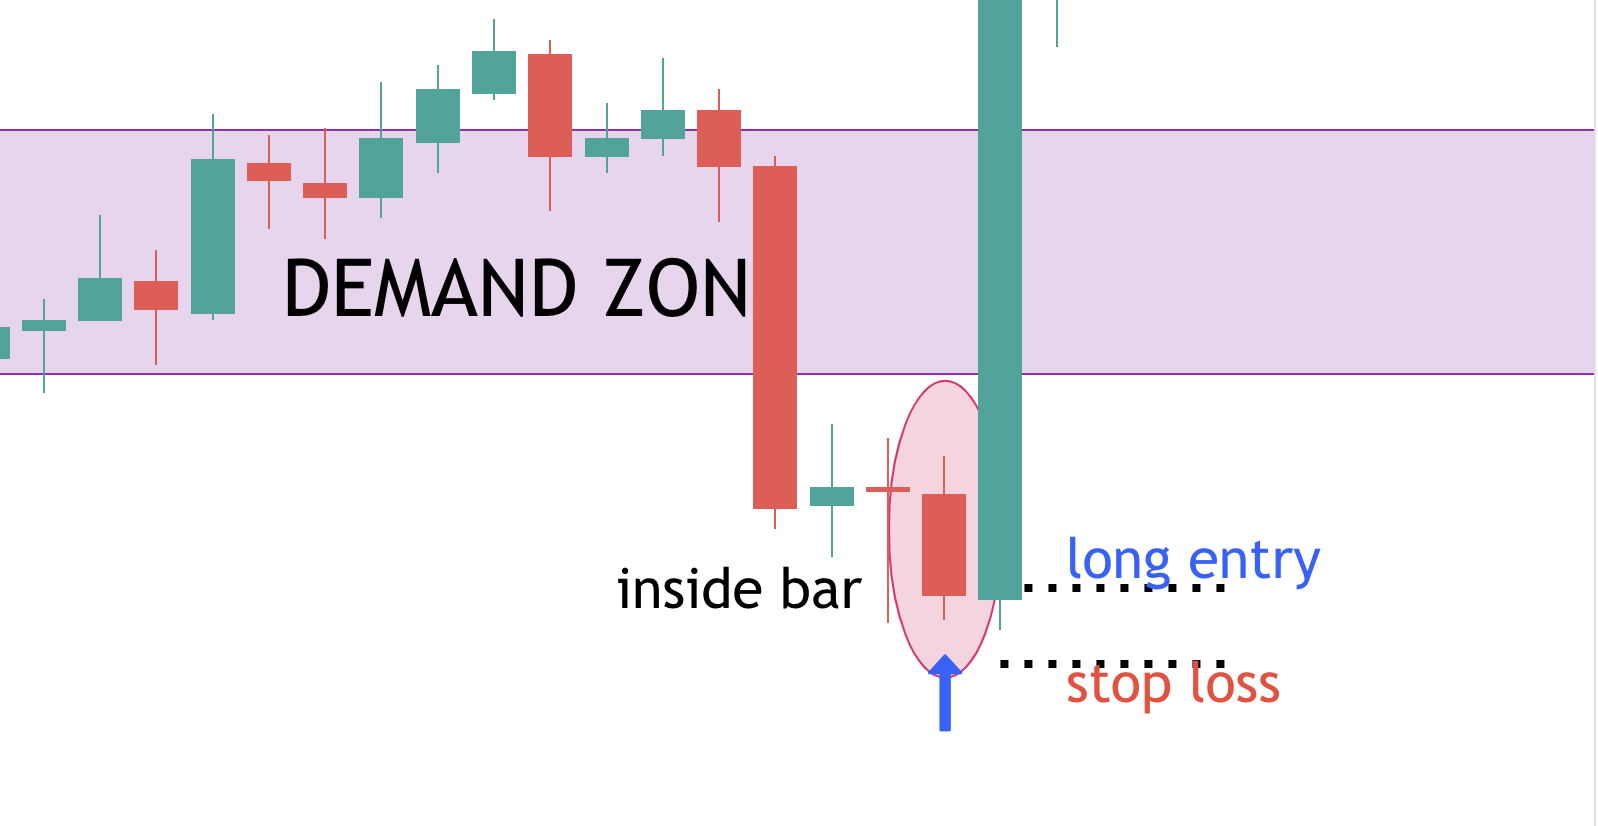
Thanks to the nature of this candlestick pattern, we can minimise our risk on the trade.
The close of the red candle is very close to the low of the candle and this allows for some very high returns to be achieved, while keeping the losses limited.
With this particular entry, the stop loss is placed 10 points below the “long entry”.
If we hold the position open even only to the first target, this would materialise into:
13R
Not an easy return to achieve!
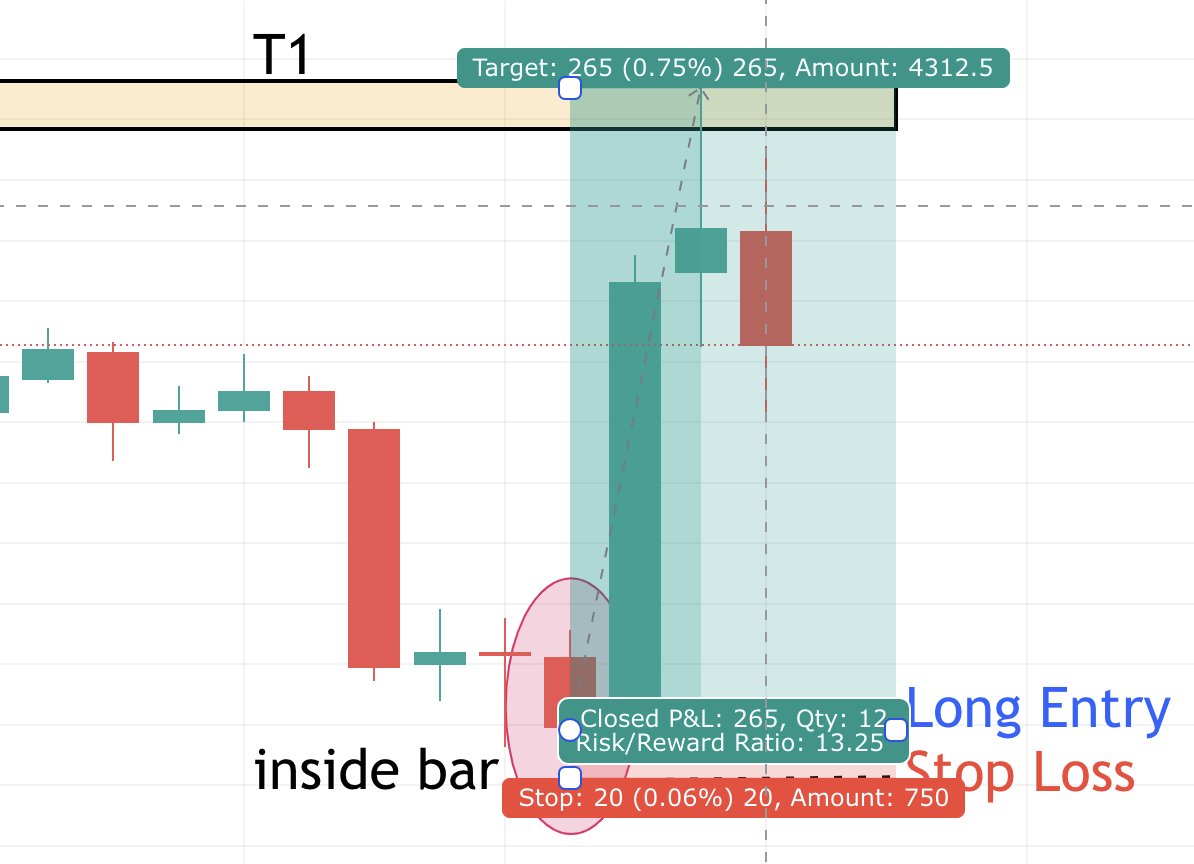
Here is given a screenshot of this hypothetical return on this particular entry.
Trading with Supply and Demand Zones Benefits
If a supply and demand trading strategy is used with the right rules in place, it can be extremely profitable.
As you can see from the example above (and numerous others on my website), the risk:reward ratios could also be fantastic.
One of the major challenges to overcome when trading with supply and demand zones is our own psychology/discipline.
It is sometimes proving quite challenging to wait for a specific zone to be tested.
It might take a long time before we can place a trade.
But if you are a patient trader, this might be just the right trading approach for you.
If so, you might try my Ultimate Supply and Demand Trading strategy, where I am going into a lot more details.
Wrapping It All Up
Understanding supply and demand zones is essential when it comes to two things:
1) Finding the best risk:reward trading opportunities.
2) Getting out of a position at the right time
These zones are very highly concentrated places of buying and selling activity.
In this article, firstly I walked you through the three steps of spotting the good from the bad supply and demand zones.
Secondly, I have shared with you the 4 main supply and demand patterns.
And finally, I showed you an example of a trade and covered everything from entry to trading targets.
And if this is not enough, I have given you enough information if you want to continue your trading journey in this field.
In case you want to go to part #2 of this article, check out my Advanced Supply and Demand Zones Trading Guide.
I hope you have enjoyed it and found it easy to digest.
As always, I am very glad to help!
Happy trading,
Colibri Trader
p.s.
Check out my Ultimate Trading Strategy if you want to get to the next level of supply and demand zones
p.p.s.
Please let me know if you have any questions in the comments section below.