


The Double Bottom Pattern Trading Guide
The double bottom…it’s time to work on the trading arsenal!
Are you looking for a solid method to build your trading strategy around?
Bonus Material: Download The Double Bottom Pattern Trading Guide PDF HERE
Most traders use chart patterns in some form or another.
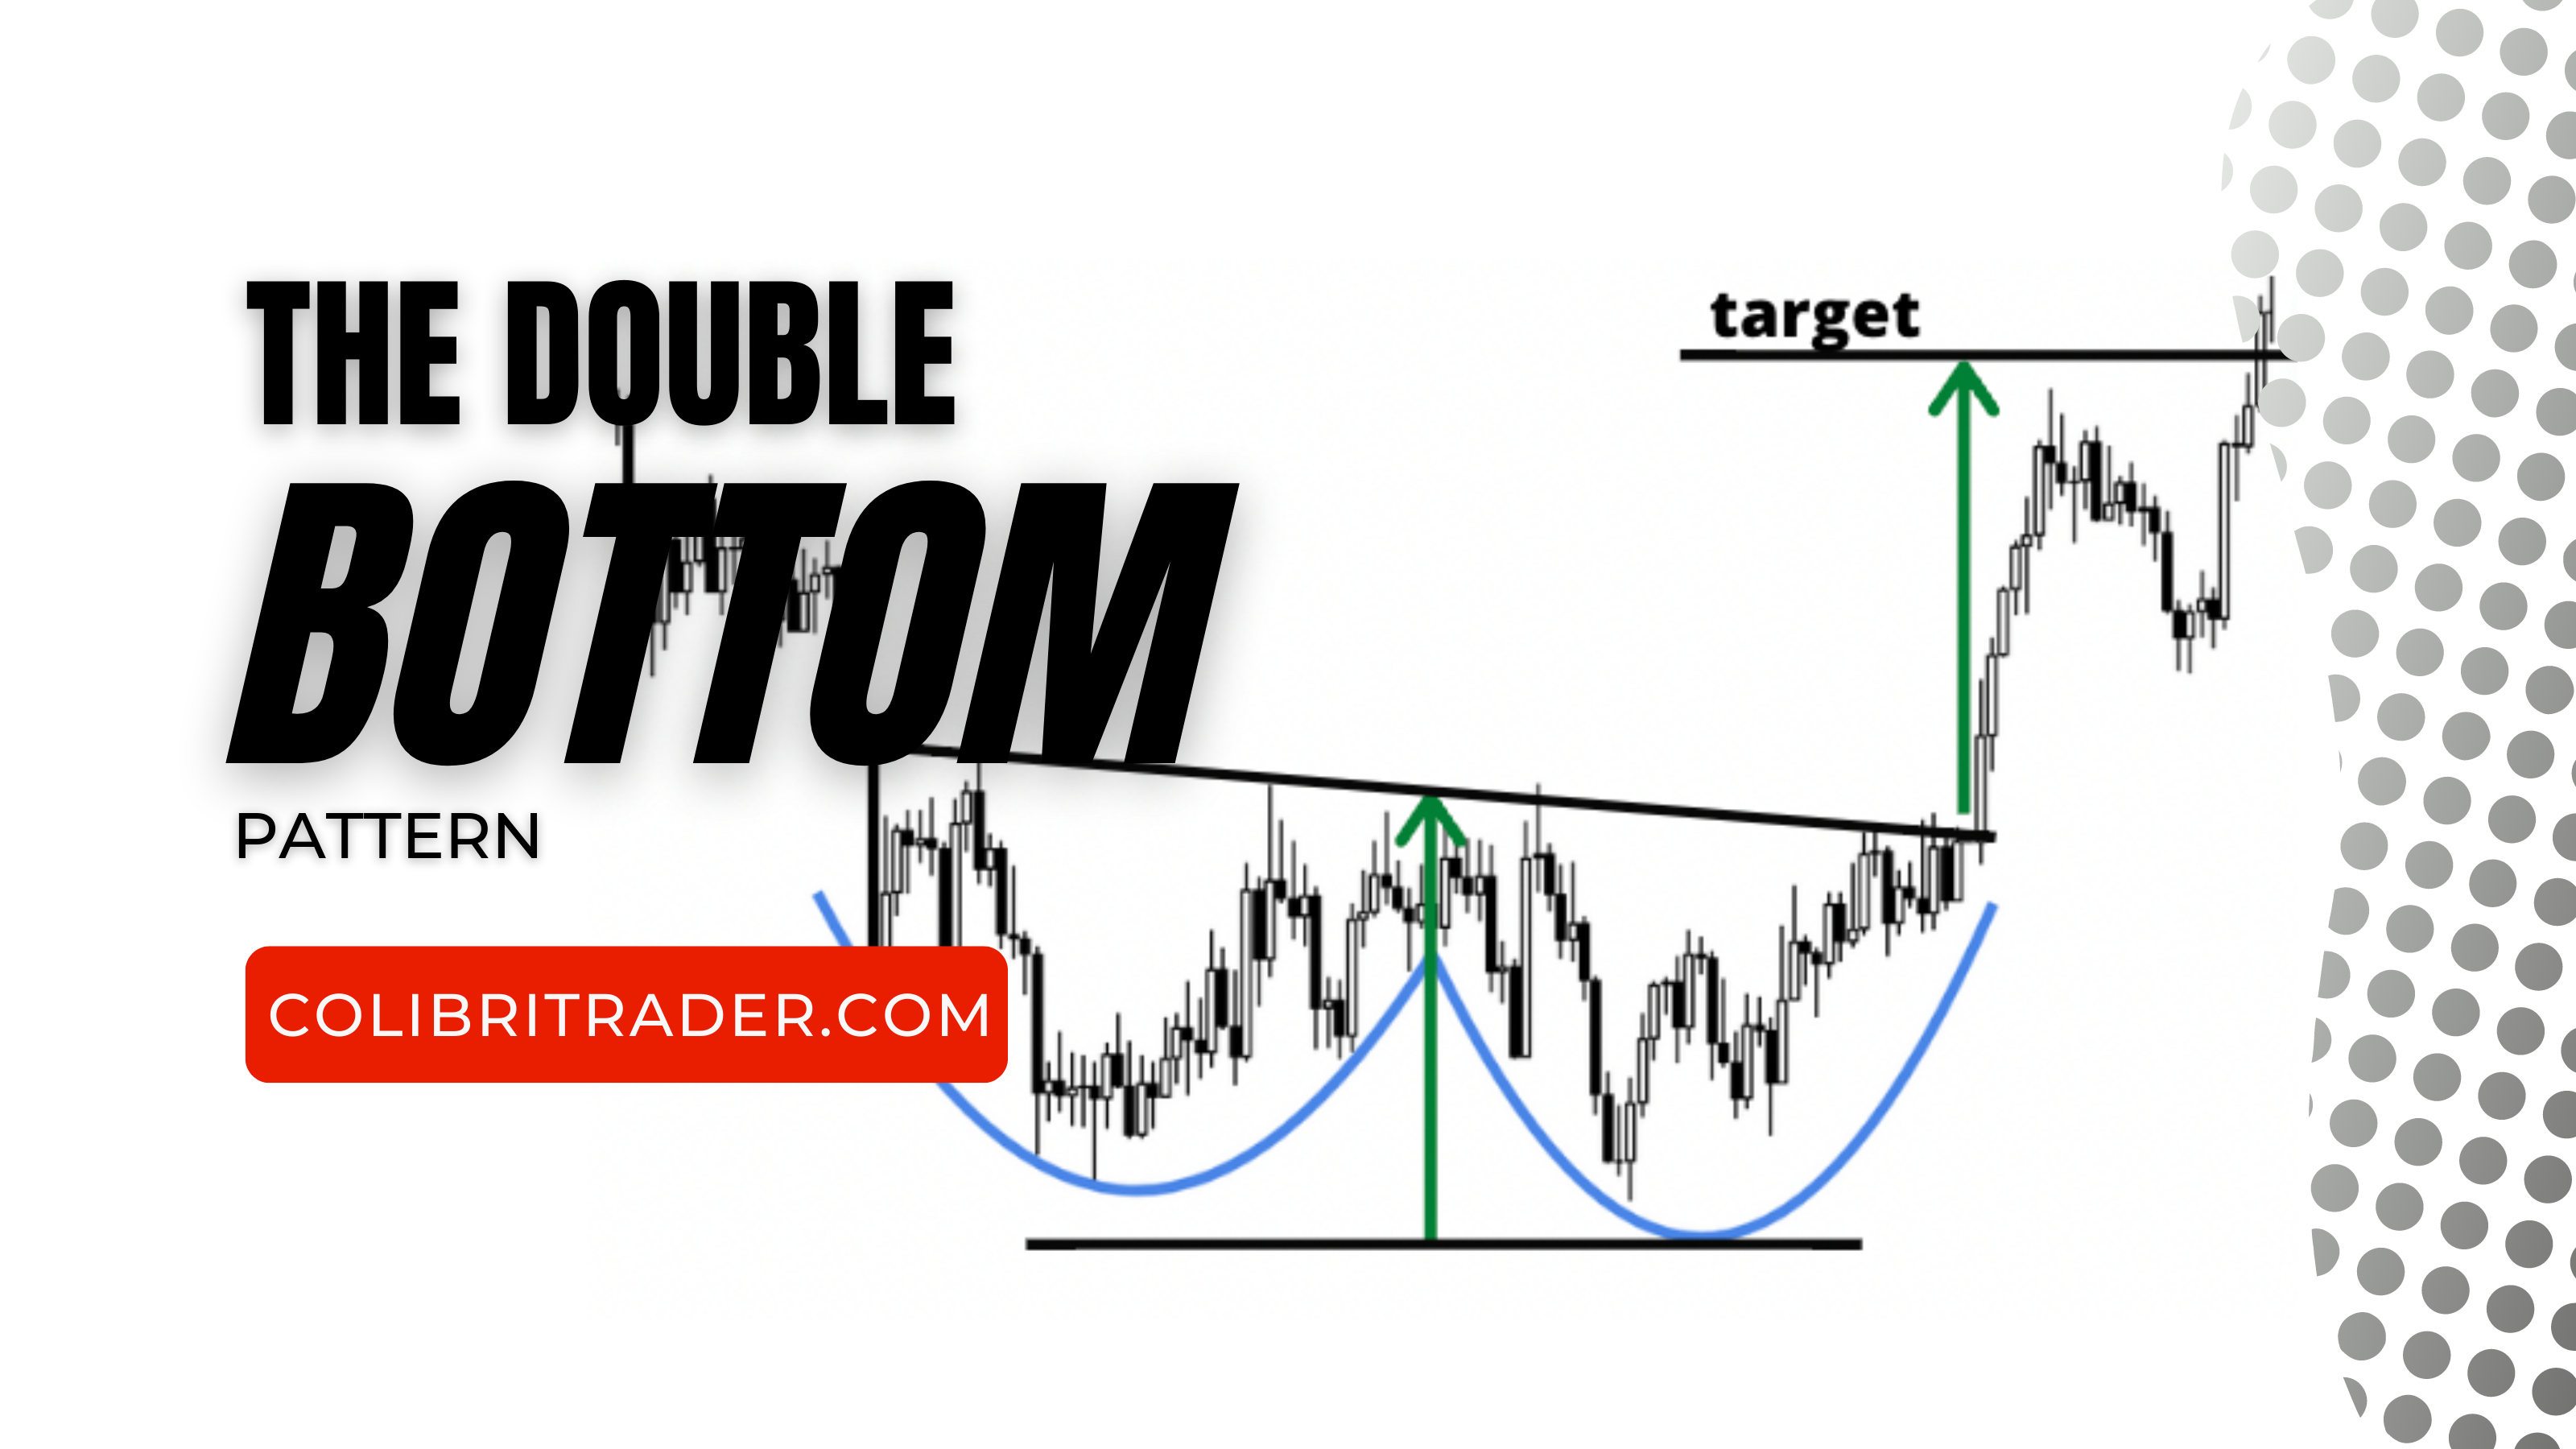
This article will cover in details one of the most straightforward ones – the Double Bottom Pattern.
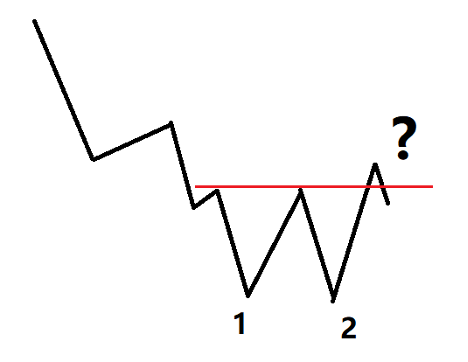
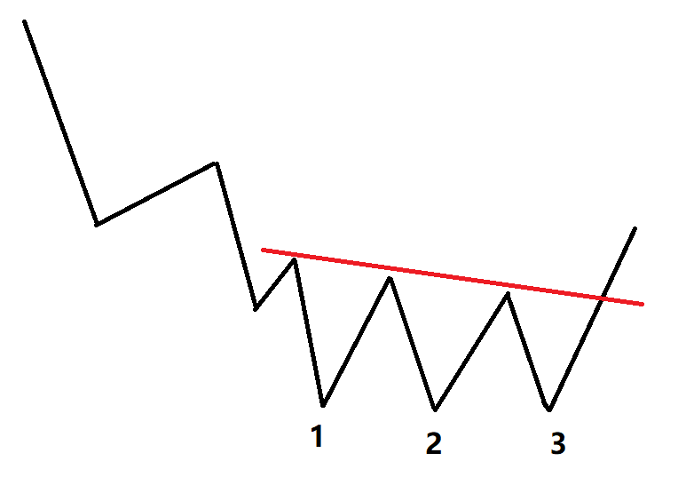
Here’s what it looks like:
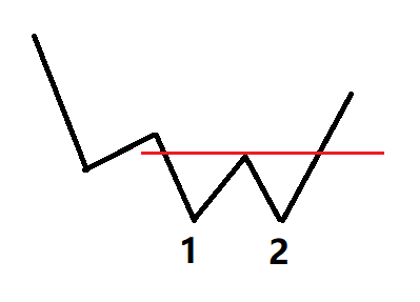
The pattern consists of a downtrend, followed by two swings, testing the same price area.
When the price gets above the neckline (see the red line in the chart above), we get the buy entry.
Also, we’ll discuss the mirrored setup – the Double Top Pattern, which provides a bearish signal.
Like any other chart pattern, it doesn’t work all the time.
So, you must not bet the farm once you see two valleys on the screen.
Instead, with the right risk and trade management, you can expect consistent positive results at least after a hundred trades.
What’s so special about those two down-swings?
Why does anyone looks for swing form anyway?
Read on to find out as we cut to the chase the principles, tactics, and other features of the setup.
Contents in this article
- How do markets reverse
- Is the double bottom pattern bullish
- How do you find the double bottom pattern
- How strong is a double bottom pattern
- How do you trade a double bottom chart pattern
- Triple bottom pattern
- What happens after a double top pattern
- How do you use technical indicators to trade double bottom
- How to trade double bottom with Measured Move
- Double bottom summary
How do markets reverse?
First of all, why would we be bullish on the market?
Well, there is a pattern, many would say.
So, what?
Not every grey cloud makes it rain!
You need a solid logic behind a market view.
We know that prices grow or decline depending on the excess of buying volume or selling volume, respectively.
Let’s extend on that.
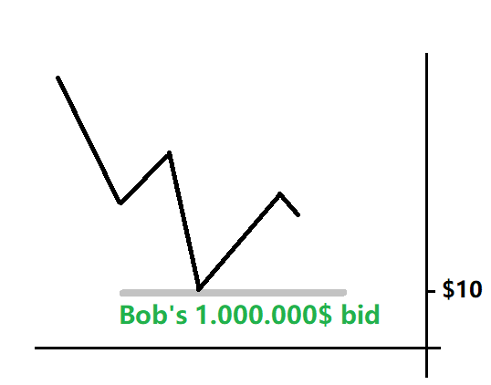
The example of a swing formation
Imagine Bob wants to buy $1.000.000 worth of stock at $10, but there’s only $500.000 of supply at that price.
What will happen?
If the market has been in a downtrend prior to Bob’s bid, the decline will stop at $10, as Bob is gladly grabbing all sales.
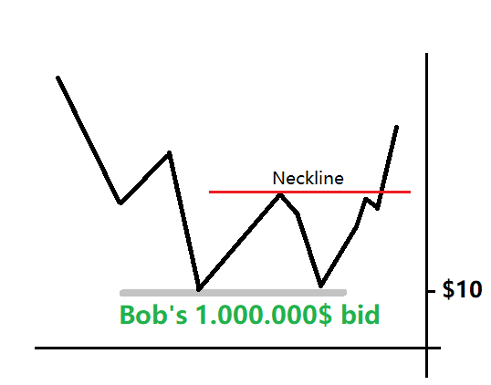
Next, others may guess that Bob is buying for real, and they’d try to buy, say, at $10.05.
Why would they buy?
If big sellers step in, bulls can sell to Bob or at the best market price right after a $1.000.000 bid is out.
In this way, the risk is limited, while the upside potential is there.
Eventually, Bob may also want to try to grab whatever’s possible above $10.
Such competition propels the prices higher, forming a downswing on the chart.
Is the double bottom pattern bullish?
If the market bounced off support and is trying to recover, we have a reason to be bullish.
How much more should we look to the upside if the market made two downswings, testing the same price area?
If prices approached the support again and failed to break it, the odds of the lack of supply would be even more evident.
Thus, a double bottom pattern means the market stalled twice in the same demand zone.
Then the upside is the path of least resistance; that’s why the double bottom pattern is bullish.
The breakout of the neckline is another factor adding to the odds of a price surge.
What makes a difference?
The neckline forms because some sellers still believe the market will keep declining.
The bears usually hide their stops above the neckline.
So, when the neckline breaks, the stops are triggered, causing an impulse to the upside.
When the double bottom is NOT bullish?
Often what seems like a double bottom pattern doesn’t mean much.
The reason?
One of the most precious skills of a trader is to read between the lines – get the market context right.
For example, if the neckline is not broken but, instead, the prices got back below it, we should reevaluate.
You see, the market changes, and you should weigh the odds of various scenarios when the market tells you something.
Also, suppose a double bottom has formed for two days.
We shouldn’t expect that short-term price action would start a reversal of a multi-month trend!
Usually, it must take a while to reverse a trend that has formed for a while.
In this case, if you look for a major reversal, a two-day double bottom is not bullish.
The recent example below shows bitcoin forming double bottom patterns (see the blue arrows).
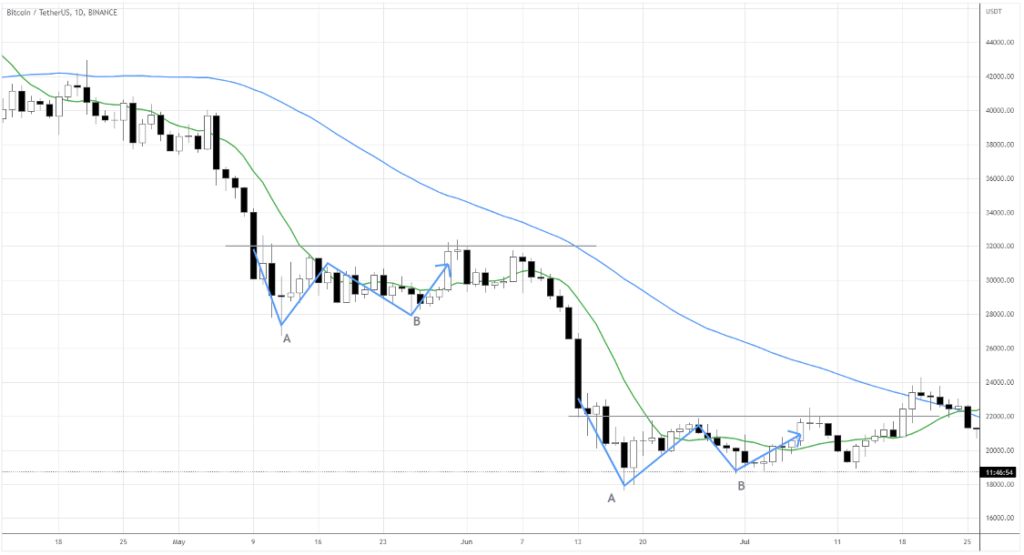
Although each pattern had formed for a couple of weeks, the prices are still far below the 50-day Moving Average (blue line).
So, the big picture tells us that the market has been in a solid downtrend.
Traders should be particularly critical of any bullish setups in such an environment.
How do you find the double bottom pattern?
Before you look for the double bottom pattern, make sure there’s a clear downtrend.
Double bottom is a reversal setup, so there must be something to reverse!
Once you have identified the trend, there are three things that will help you find the pattern.
Next, let’s look at those closer.
Two downswings
Here’s a no-brainer – look for those two swings like you saw on the pattern sketch.
Train your eyes to notice those two valleys after a move down.
How?
No, don’t stare at the same chart a hundred times.
Instead, expose yourself to as many market contexts as possible.
After some practice, you’ll get an intuitive ability to distinguish what’s really worth the risk.
Below is an example of what you should look for.
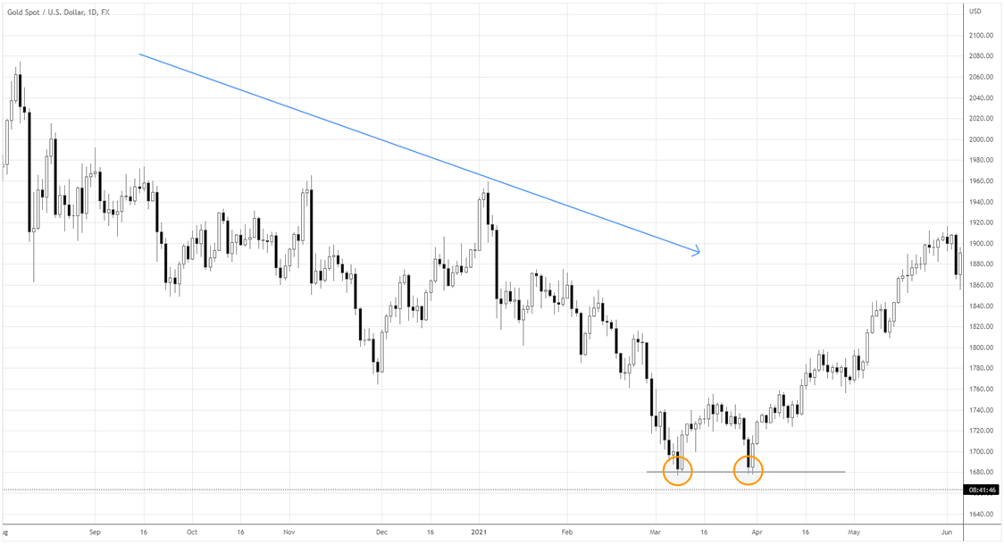
The gold chart above has been in a downtrend since August 2020.
Then there were two swings (see the orange circles) that tested 1680.0 in March 2021.
Yes, we might consider the pattern quite short-term.
However, if we expect at least some retracement of the 2021 move, it makes sense to give it a try.
Two candlesticks
If you want more of a generalised view of the price action, look for the double bottom candlestick pattern.
Go to the higher timeframe than you normally analyse and peer into single candlesticks.
You want to find at least two candles with down wicks touching more or less the same price.
Here’s an example.
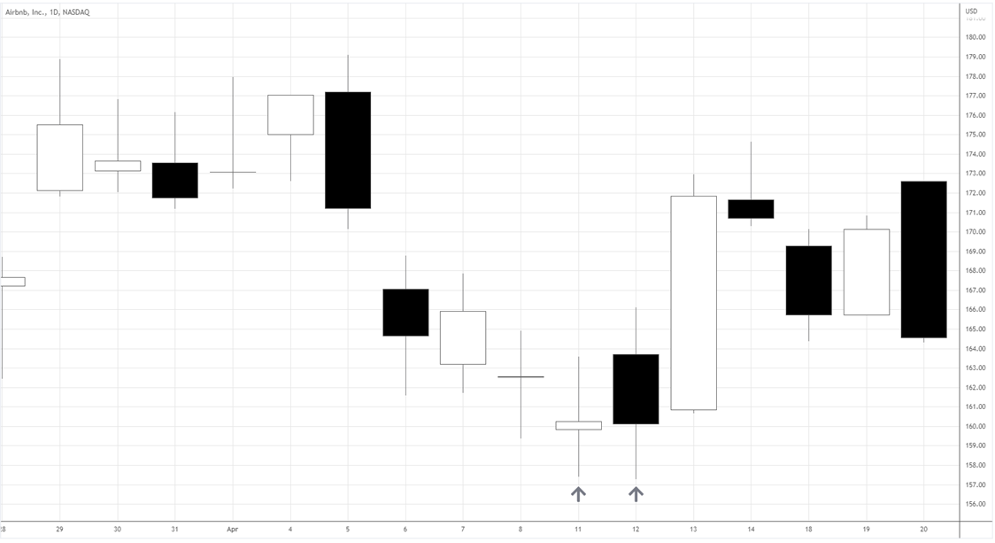
The Airbnb chart shows two candles with wicks testing prices around 157.5.
You can even make a double bottom entry from such a high timeframe.
However, to improve your risk-to-reward, look at the lower timeframe.
Here’s the 1-hour chart of Airbnb.
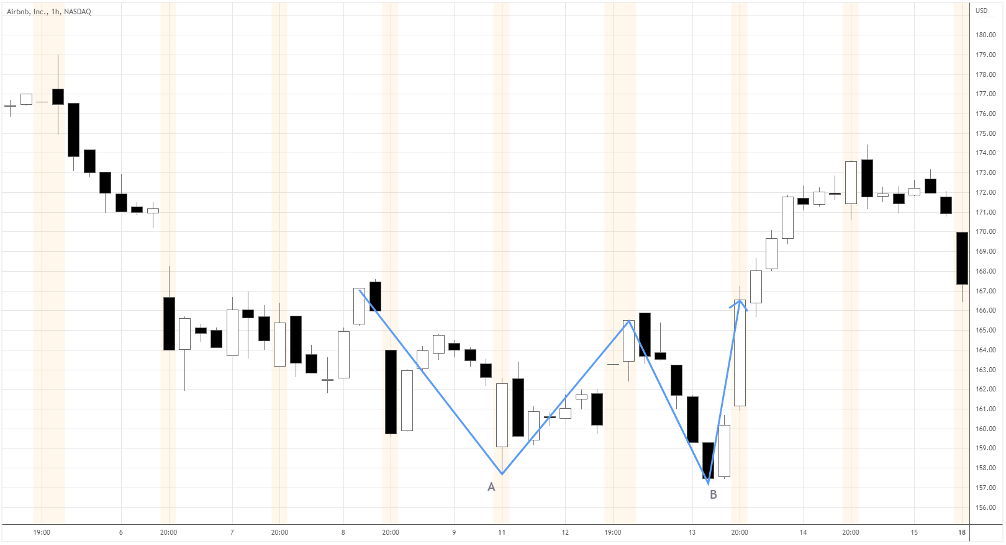
What looked like only two daily candles is already a familiar two-swings-setup on a one-hour chart.
Price levels
Double bottoms tend to form around significant demand zones, and often, those are exact prices.
We can expect the setup to appear around certain prices if we can identify strong levels.
How easier it gets when you can prepare in advance for the upcoming signals!
It’s crucial on the lower timeframes, as things change fast.
Due to the density of bids around the level, there is a reason for the market to struggle to go lower.
Usually, such a “struggle” would manifest in numerous retests of the critical area.
No wonder double bottom entry often shows up!
Let’s see the example.
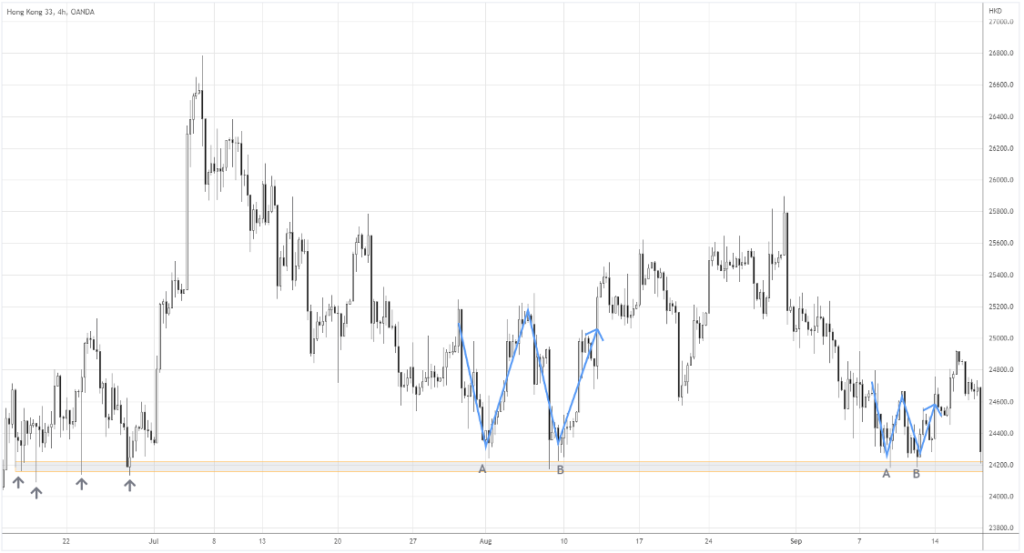
In the Hong Kong index chart above, the market formed the strong 24200 demand zone in June.
Look how the prices bounced off aggressively, forming the long down wicks (see the grey arrows).
Eventually, the market approached the support again in August and September, forming double bottom patterns.
When you see a level is tested like that, mark the price and set an alert around there.
You’ll thank yourself later when the long-forgotten chart provides you with a new quality setup.
How strong is a double bottom pattern?
Oddly enough, the strength depends on the context.
The double bottom is one of the market’s most frequently occurring setups.
At the same time, the pattern has a high winning rate.
Some pattern-nerd sources suggest an above 70% chance the price will reach the objective after the double bottom is complete.
Between the double top and double bottom, the latter has slightly higher odds.
Note the data is usually taken from the setups on daily and weekly charts.
Expect the odds to be lower on intraday charts, as random events have more impact on price action.
Think about news releases in forex!
Every speech, meeting, or economic data has the potential to screw up a beautiful technical pattern.
So, no wonder the probability is lower.
How do you trade a double bottom chart pattern?
We can talk a lot about the “what, why, and when” of the double bottom pattern.
However, the execution makes all the difference between an amateur and a professional trader.
Next, we’ll touch on everything you need to know to make the most out of the setup.
Let’s get to it!
Get the market context right
First, you should define where the setup stands in relation to the recent price action.
There are two types of double bottom patterns, depending on the market context: major trend reversal and continuation.
Suppose you expect the major trend to reverse.
The following example shows how the downtrend (the blue arrow) gets negated after a massive double bottom (A and B swings)
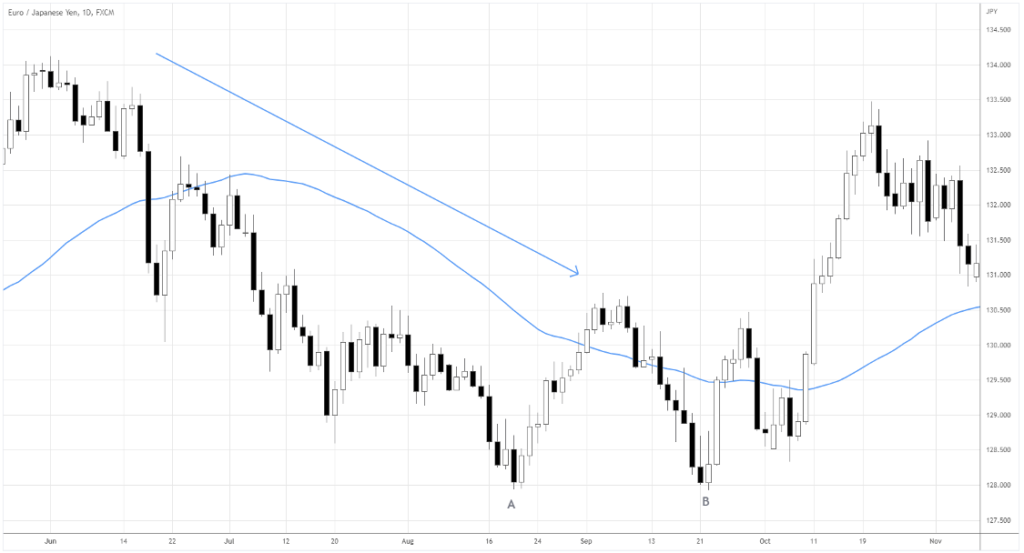
For such a reversal, the pattern needs to form for a considerable time.
The stronger the downtrend, the lengthier the setup should be to reverse it.
Another type of double bottom pattern is the major trend continuation.
In strong, long-term uptrends, we can see corrections as brief downtrends themselves.
Makes sense?
The USDJPY example below shows a short-term downtrend that culminates in the double bottom A) and B) around 121.50.
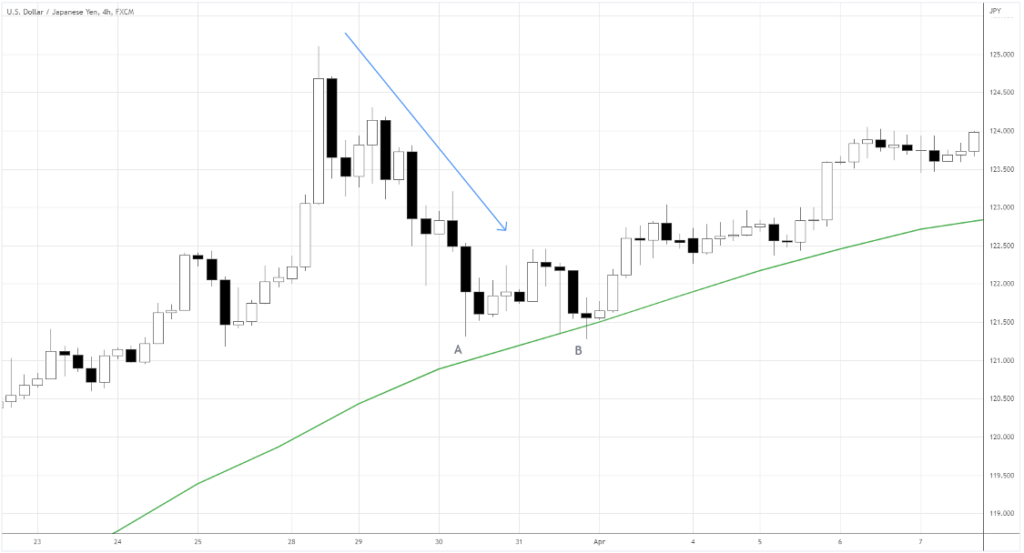
At the same time, notice how the quality double bottom tends to form near the Moving Average (green line).
Such a double bottom pattern means we follow the long-term trend, stacking odds in favor of bulls.
Depending on each context type, your trading tactics should vary.
Double bottom trading tactics
After fitting the setup into a big picture, we need tactics of where exactly to buy and sell.
Let’s dive into what should happen to enter and exit the market.
Entry areas and the price action triggers
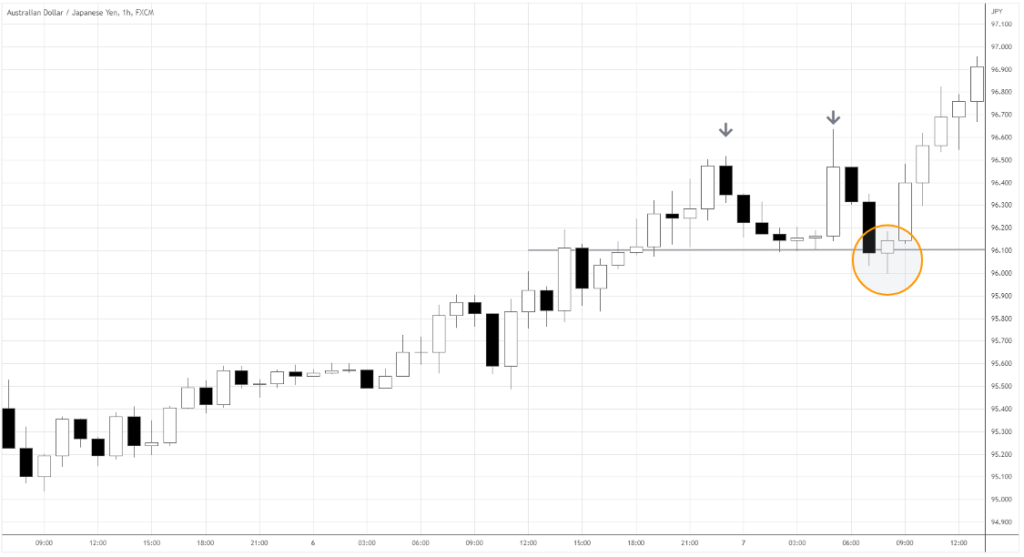
The AUDJPY chart below portrays the double bottom with the three possible entry areas.
Each type of double bottom entry has specific logic behind it.
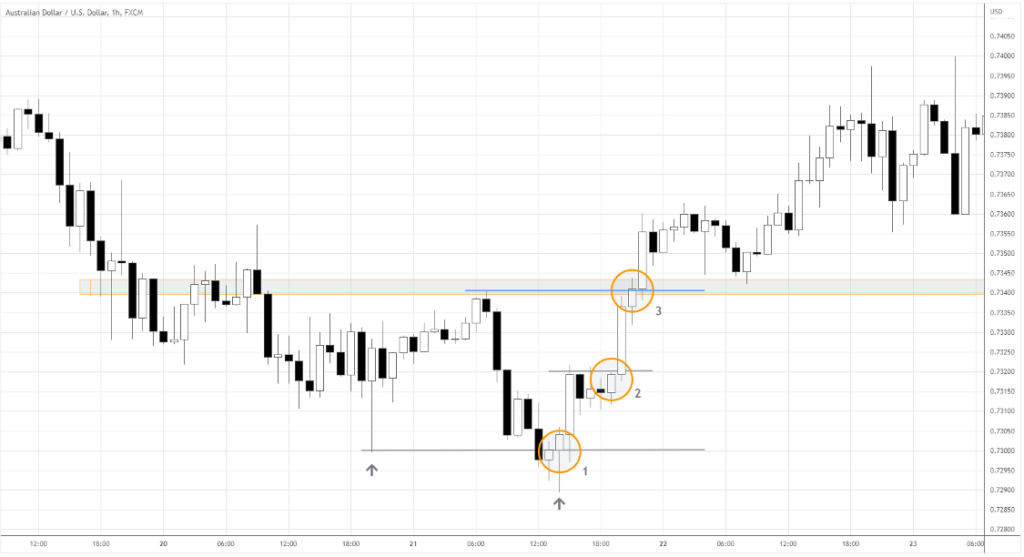
Let’s look closer at each setup.
Entry #1
The setup comes up when the candle reliably closes above the support level of 0.7300.
Notice that the second dip of the double bottom is lower, pulling-in unsuspecting sellers.
The idea is to ride the impulse from the triggered stops of the short-term bears as they capitulate.
Entry #2
Here is a combination of short trades liquidations and big players accumulating long positions.
What makes us think somebody is accumulating longs?
The candles’ lows above 0.7310 suggest a density of bids.
So, in this setup, we expect loss-takers and definite bulls to push the market higher.
Buy once the price above this short-term consolidation, around 0.7325
Entry #3
The signal represents a classic neckline (see the blue line) breakout – the most conservative signal.
Here we have short liquidations of short-to-medium-term bears and new swing traders buying the market.
At this point, the odds that a major move is reversing are increasing, so it’s a great environment to be long.
On the downside, the downward shake-outs are likely as the market has already been growing for a while.
When do you buy it?
Traders can go long after the price gets above the local swing high (above the blue line).
Stops and targets
We’ve come to the most critical part of the trading tactic – where do we set a stop?
Limiting losses is essential for your survival as a trader.
The stop loss, once triggered, should invalidate the setup, so the reason to be in a trade disappears.
The red areas in each setup below show the risk for the trade.
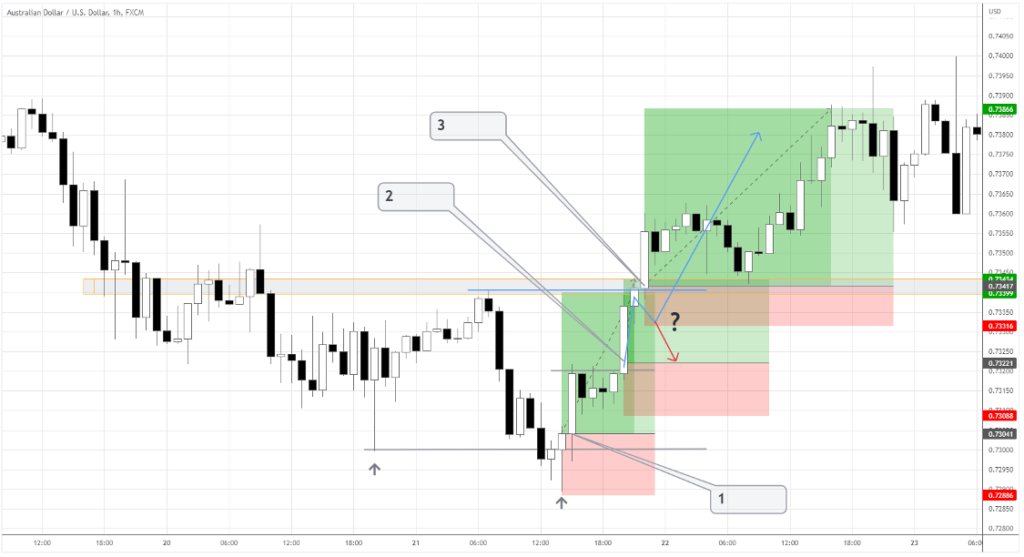
The green areas are expected profit potential per setup.
Each target is based on the nearest significant local high.
The classic target for the double bottom equals the height of the pattern added to the neckline.
So, the swing-based move potential for entry #3 coincides with the classic target.
What a coincidence!
Pro tip: Look for the targets that match the ones found through other methods of analysis.
Entry #3 note
The illustration above shows quite an attractive risk-to-reward for the third entry.
However, the odds of the stop being hit are also high, as the market has already made a decent upward move.
Short-term bulls may just want to take some profits, along with bears going short from the local supply area (grey rectangle).
You can go on, being mentally prepared to be shaken out and re-enter afterward.
Or, set your stop around entry #2’s.
In both cases, adjust your position size so you’d still be betting the expected amount on the trading idea.
Triple bottom pattern
When one more similar valley appears after the DB, we get the extended setup – the triple bottom pattern.
Here’s how it looks.
The setup is quite rare yet still has a winning rate above 70%, according to Bulkowski.
The variations among the lows of each valley should not be big.
Similarly to the DB, the triple bottom is considered completed when the prices break above the neckline.
The target is the height of the pattern added to the neckline.
What happens after a double top pattern?
The double top pattern is the opposite of the double bottom.
The setup consists of an uptrend and the two upswings testing the same price area.
The trading tactics resemble the double-bottom ones.
Here’s an example.
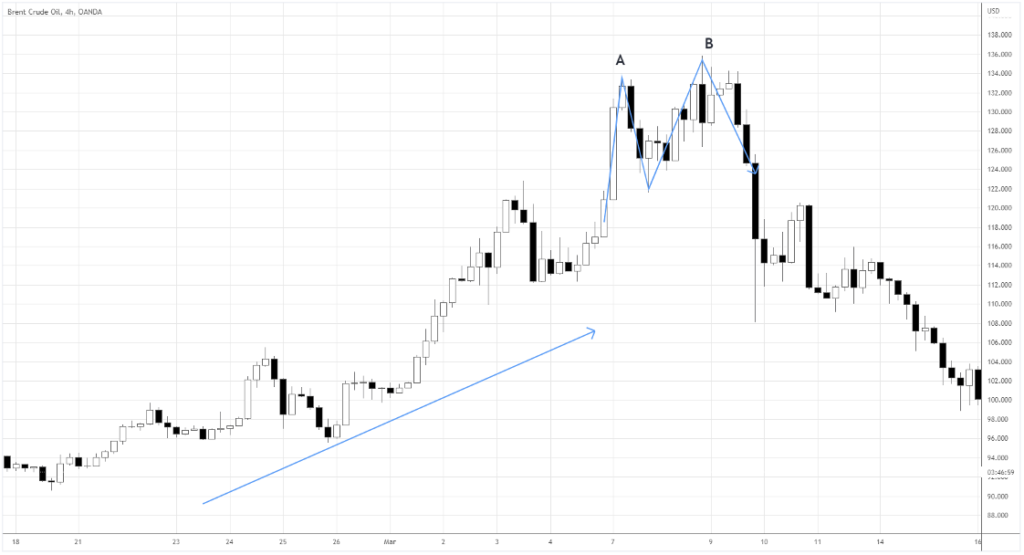
In March, Brent re-tested 134.00 twice, forming the double top.
The riskiest entries are closer to 134.0.
The main short setup would be at the breakout of the neckline around 122.0-124.0.
Pro tip: Focus on forex and commodities when trading double tops.
The equity markets are designed for raising capital, so they naturally tend to grow over time.
Scenarios
So, what exactly can you expect after the double top pattern completes?
Below we’ll look at the three possible scenarios after the prices get below the neckline.
When trading, keep in mind what may happen and how you’ll respond to each scenario.
Mental preparation is the key to avoiding regrets, greed, and other destructive behaviors affecting your trading.
Major and minor reversal
The major reversal occurs when the trend gives up at least half of the gains.
Often market comes back to the price from which the uptrend acceleration started.
Consider the already familiar Brent chart below👇🏽
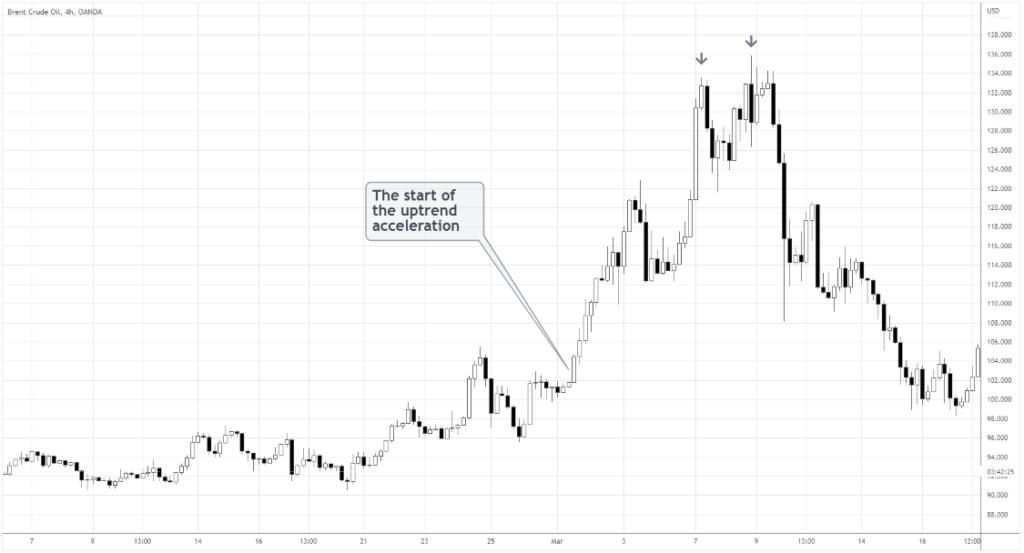
Brent came back to $100.0, from where in March the market was soaring with consistent big white candles.
When you expect a major reversal, consider a wider stop, likely above the trend’s top.
Markets don’t always crash right away like there’s no tomorrow.
Pro Tip: Usually, there are several more attempts to continue the preceding trend before the final reversal.
Be ready to hold tight during those throwbacks!
The minor reversal is usually a beginning of a short-term pullback.
The move potential is quite limited, as buyers are rushing to buy the dip.
Some traders focus on high win rates and small gains, trying to “fade” momentum.
As you see in the gold chart below, the minor reversal provided some fast gains.
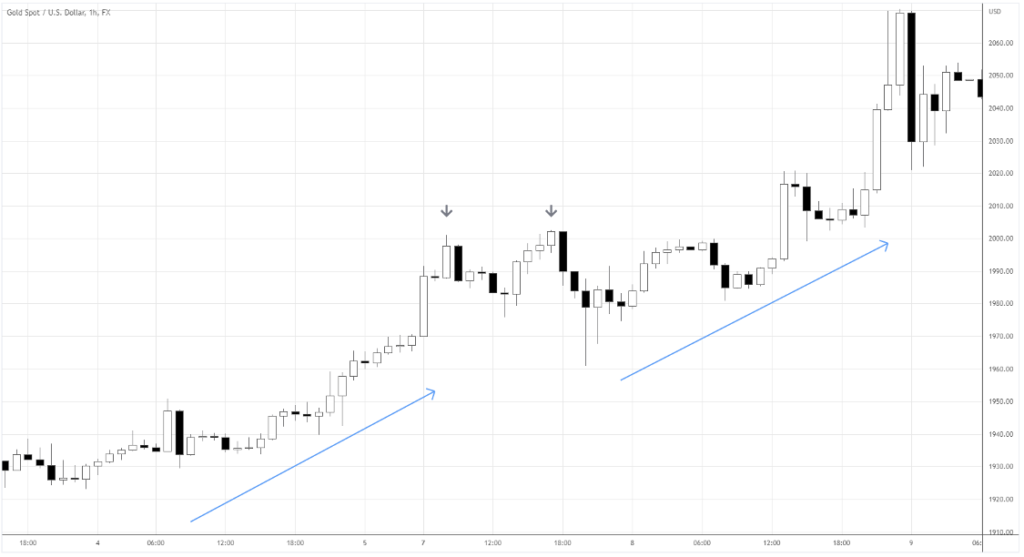
Although, one must be extremely disciplined in taking profits, as a strong uptrend usually quickly recovers after a sharp decline.
Keep the right expectations in mind and follow strict risk management.
Bear trap
If the market quickly recovers above the neckline not long after the double top neckline breakout, bears may get “trapped.”
Here’s an example👇🏽
If the candle closed above the neckline, it’d be a good idea to close a short position taking a tiny loss.
Next, wait and see what happens – if the candle closes under the neckline again, short it one more time.
Often the market would keep aggressively climbing up as bears are closing short positions.
Don’t hold the bag; get out before your stop loss is hit.
Your average losses will get smaller if you consistently cover shorts when you see a bear trap.
Yes, it’s uncomfortable.
But that’s what most wouldn’t do; instead, they choose to take a full loss.
You know, it’s another story if there’s no bullish signal.
However, the bear trap gives you the reason to get out.
Hot mess
One of the nastiest things happening after a double top is the pattern morphing into a tricky range.
Often the market goes for stops several times before moving in either direction, if anywhere at all.
It can happen in any double top, so decide in advance how many times you’d be willing to try shorting the asset.
Look how ugly it got in Exxon Mobil stock.
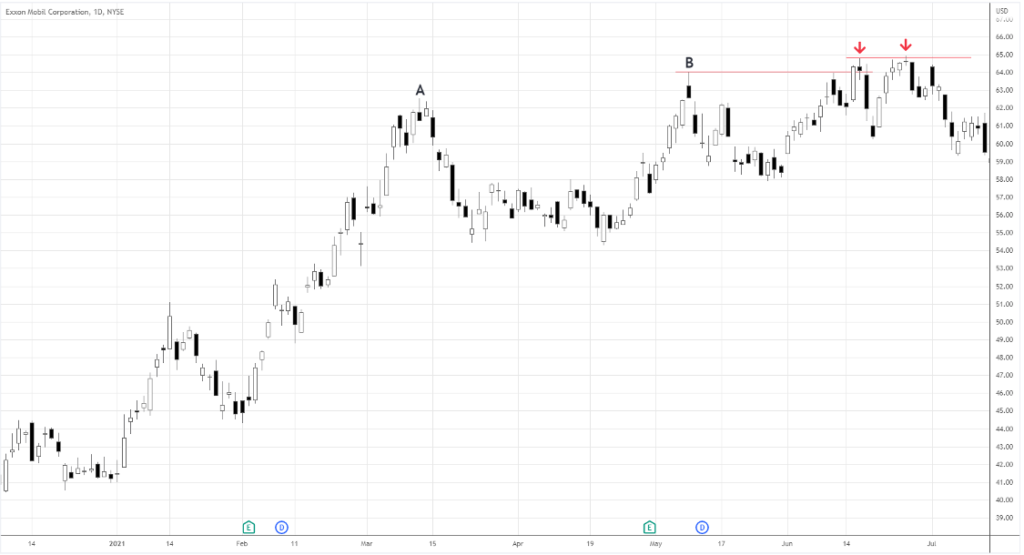
As you see, the hot mess can happen even on high timeframes like daily.
Suppose one wanted to short Exxon after a possible “A-B” double top with a stop loss above the trend high.
A short-seller would hit their stop loss at least twice without any meaningful move.
That’s fine if it’s part of your plan.
However, you may get frustrated if you concentrate all your risk on only a couple of attempts.
How do you use technical indicators to trade the double bottom?
Making trading decisions based on the chart has one serious downside.
Technical setups are subject to hindsight bias.
Patterns are tricky at times as traders’ perceptions can be affected by many factors.
Emotions, physical state, and experience (or lack of it) impact how we see the markets.
How do we bring more objectivity to chart analysis?
Technical indicators provide a concise way to quantify price action.
Thus, we’ll learn how to utilize such tools to improve the profitability of the double bottom pattern.
Still, indicators are not a one-fit-for-all approach.
You should still develop a set of rules for using signals from indicators.
The efficiency depends on the market, trading style, etc.
It’d be best if you backtest the use of an indicator before trading live.
In this way, you’ll get a rough picture of the performance and get used to executing the signals without second-guessing.
Let’s look at a couple of the most popular indicators below.
Moving Average (MA)
Moving average simply plots a line of average prices over a specific period on the chart.
The MA’s period defines the sensitivity of the indicator.
Pro Tip: The longer the period, the lower sensitivity is.
At the same time, a longer period of MA produces more reliable signals.
Remember: The best bullish signal comes up when the market crosses above the MA while completing the double bottom.
That’s what EURGBP did in 2020.
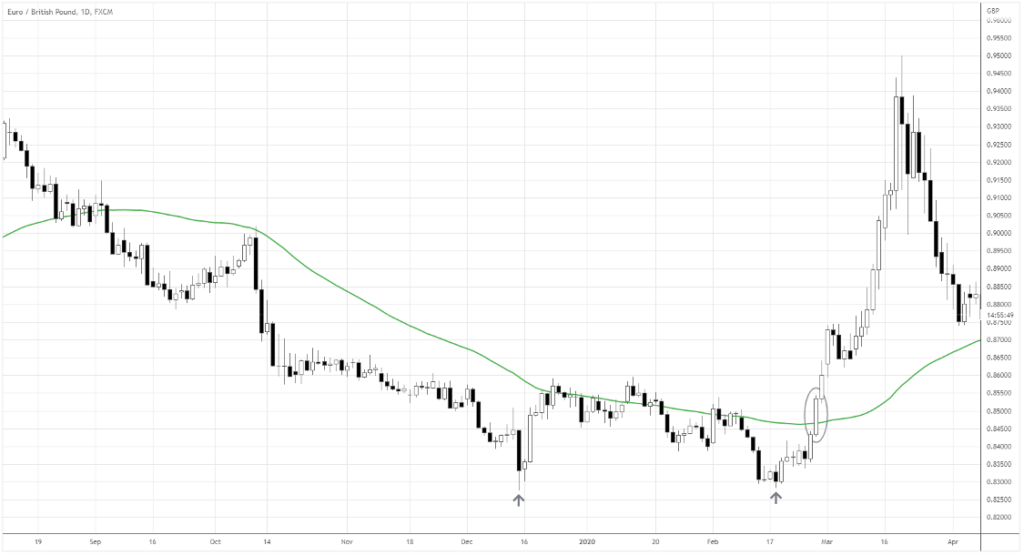
The market broke above the 50-day MA and completed the double bottom not long afterward.
Above is the kind of over 70% win-rate patterns we discussed before.
Moving Average is a great signal filter, sifting through market noise and generating only the best setups.
Relative Strength Index (RSI)
Here’s the tool that measures the extent of the price movement relative to the defined past period.
When RSI reaches 30 or 70, traders consider buying or selling, respectively.
Below, EURCHF formed a double bottom, while RSI touched 30.
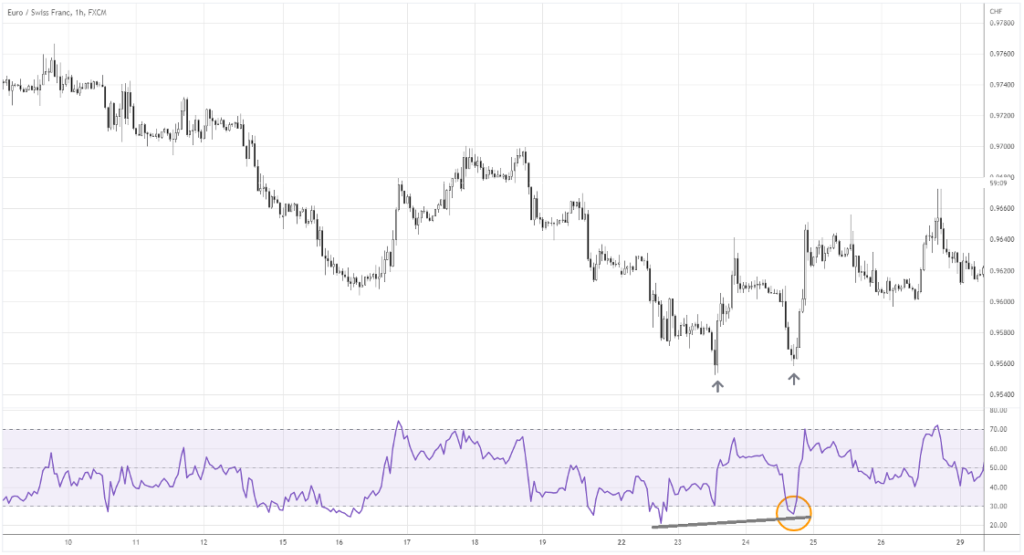
A classic RSI-based signal is to buy immediately after the indicator gets back above 30.
Another signal, more commonly forming with DB, is divergence – price makes a lower low, while RSI makes a higher low.
Uncomfortable with hectic markets?
No worries!
RSI works best for choppy trends!
How to trade The Double Bottom with Measured Move?
Measured move is the concept of symmetry in the markets.
One wave’s length tends to be similar to the next one.
Self-fulfilling prophecy?
Maybe!
Pro Tip: What matters is that it’s a valuable tool for calculating the market’s probable turning points.
In the USDJPY uptrend below, the three upward legs (see blue arrows) have a similar length.
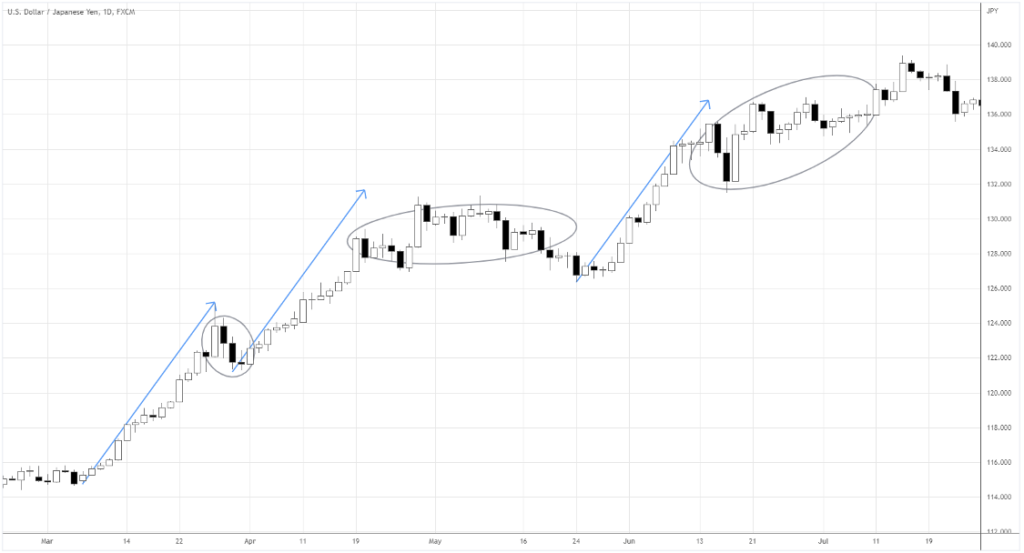
After the expected length was achieved, the market stalled in one way or another.
Following the symmetry, we can expect where to take profits or try to short the market.
Does the Double Bottom fit in Measured Move?
The concept of symmetry is also helpful in confirming a double bottom.
For example, considering the length of the declines, we can project where the “B” valley may form.
Check out the USDCHF chart👇🏽
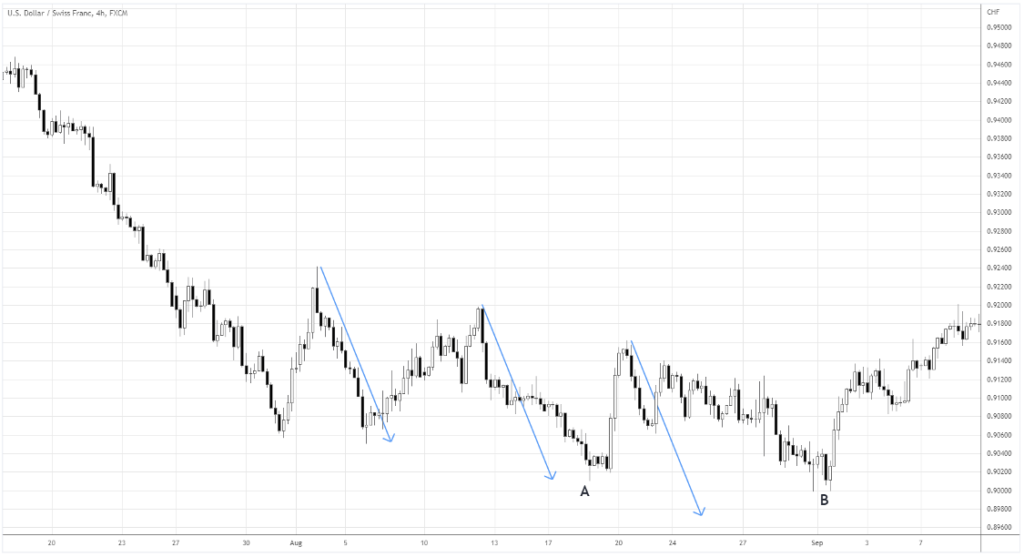
The measured move concept adds to the validity of the double bottom.
Some traders participating in the price action above might not even think about a “double bottom.”
If they saw a measured move there, they might still buy.
The point is traders look at charts and make decisions based on different reasons.
The more reasons there are to go long, the more people will be involved, adding fuel to the move.
Double bottom summary
Double bottom is a classic setup that is frequent and has a high winning rate.
It’s critical to look for the pattern in the right market context.
As a reversal pattern, the double bottom needs a preceding downtrend, something to reverse.
Otherwise, you risk being caught in a range without the market going anywhere.
It’s helpful to have a couple of strict criteria to filter the best setups – indicators may do the job.
When you want to execute a trade, plan your actions for various scenarios after your entry.
Markets aren’t obligated to behave in a certain way just because there’s some pattern, even a super high-probability one.
Anything can happen!
So, whatever trading tactics you use, make sure you know how to manage risk well.
Bonus Material: Download The Double Bottom Pattern Trading Guide PDF HERE
Frequently Asked Questions
#1: Is double bottom bullish?
A double bottom pattern means the market stalled twice in the same demand zone. Then the upside is the path of least resistance; that’s why the double bottom pattern is bullish
#2: How accurate is the double bottom pattern?
A double bottom pattern means the market stalled twice in the same demand zone. Then the upside is the path of least resistance; that’s why the double bottom pattern is bullish.
#3: How accurate is the double bottom pattern?
The setup is quite rare yet still has a winning rate above 70%. This is 40% higher than 90% of the other chart patterns.
#4: How do you play a double bottom pattern?
First, you should define where the setup stands in relation to the recent price action. There are two types of double bottom patterns, depending on the market context: major trend reversal and continuation.
#5: Which pattern is best for trading?
-Double top.
-Double bottom.
-Head and shoulders.
-Rounding bottom.
-Cup and handle.
-Wedges.
-Pennant or flags.
-Ascending triangle.
-Triple top
#6: Is triple bottom bullish or bearish?
The setup is quite rare yet still has a winning rate above 70%. It is considered to be a bullish pattern.
Happy trading,
Colibri Trader
P.S.
Here are some related articles:
15 Chart Patterns in Forex Trading That Every Serious Trader Should Know