


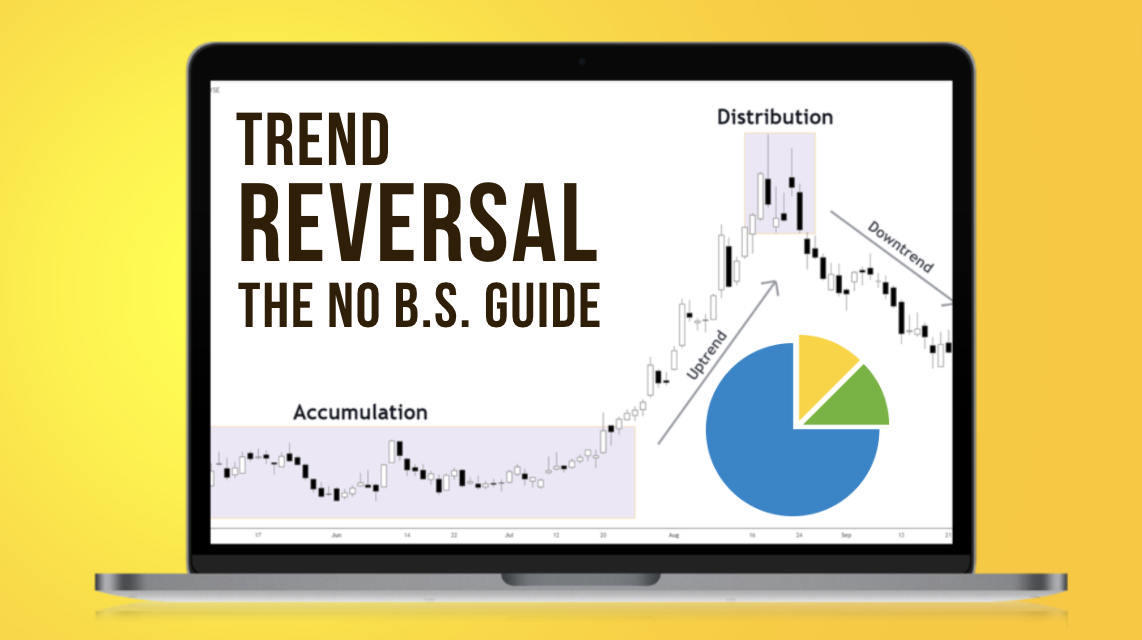
Trend Reversal- The NO B.S. Guide
Every trend stops at some point, digesting a correction or turning into a complete reversal.
Why?
It’s just how human nature is.
How can you take advantage of such an inevitable market stage?
In general, the classic trading advice is to follow the trend.
However, is it that difficult to trade reversals?
Let’s find out!
Contents in this article
How the market moves
What makes the market turn around?
You should know the basics of how and why the market moves to have an edge in trading reversals.
First, let’s look at ways to view the market stages.
How does it help?
After getting the big picture of the trend reversal, you’ll easily digest the actual execution tactics.
Four market stages and the problem of finding a trend reversal
Below is the most common interpretation of the market stages.
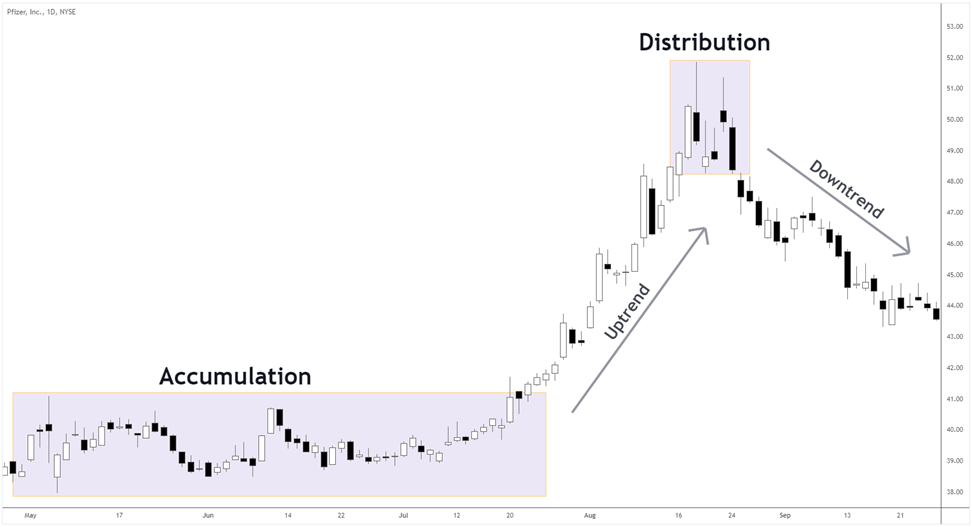
Let’s see how each stage forms.
1. Accumulation
The supply and demand volumes are similar, forming a directionless market that often looks like a rectangle.
Bulls try to buy closer to the lower border of the range, and bears strive to dump near the upper boundary.
The longer the range lasts, the more people may be involved, hiding the stop losses beyond the channel.
At some point, if buyers overweigh sellers, the breakout occurs, triggering an impulse driven by stops activation.
As more bulls join the initial impulse, the market may proceed to the next stage.
2. Uptrend
If enough participants (and the volume) join the up-move, the market will keep forming higher lows and highs.
The uptrend is sustained due to demand surpassing supply, propelling prices higher.
3. Distribution
After the uptrend develops and reaches “high” prices, early buyers would want to take some profits, thus sell.
Short-sellers, seeing the beginning of the decline, might join the move.
On the other hand, some people still believe that the uptrend will continue.
So, optimists would see the decline as an opportunity to buy at better prices.
As supply and demand sides are incentivized to engage, they may establish a new equilibrium in prices, forming another range.
As more and more people sell the asset, the range can be broken to the downside.
4. Downtrend
The initial down-impulse may develop in a downtrend if sellers keep adding to the supply, absorbing all demand.
Basically, it’s the opposite of what happened in the first stage.
Alternative view
The main idea behind the four stages described above is recognizing the distribution and joining the reversal.
How practical can it be?
Although the previous interpretation is logical, we face some dilemmas.
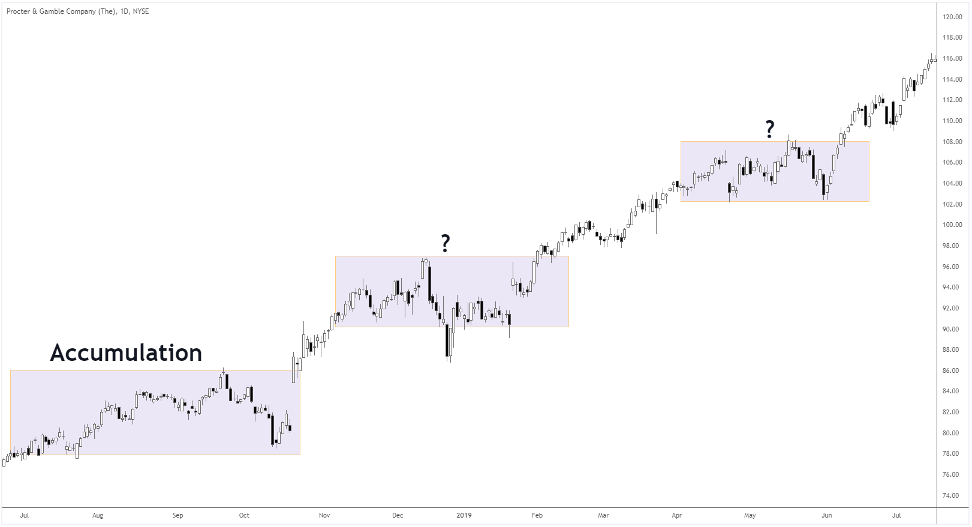
The idea behind the four market stages implies looking for the distribution stage to trade a trend reversal.
Consider the image above. How do you know if the next consolidation is a distribution?
The market may often keep grinding up, accumulating at each pause.
Eventually, those attempting to trade a trend reversal after each consolidation feed the trend as they take losses.
Let’s put on the mindset that anything can happen, but each scenario has different odds.
Let’s take an example.
If a range has certain properties, the likelihood of it turning into a trend reversal is higher.
Let’s build on that.
We’ll look at the market as constantly changing from range to trend.
The trend direction would depend on various factors that we’ll discuss below.
How to bet on a trend reversal?
Why do people lose money trading a trend reversal?
We already mentioned certain reasons for a range to be viewed as a reversal.
What is it like without the reasons?
Here is an example:
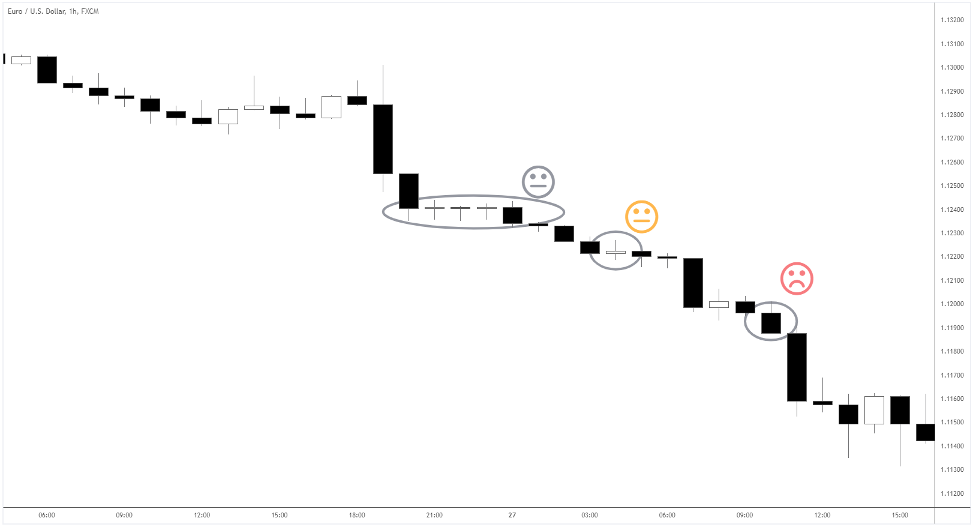
For those buying around grey and orange emojis, an excuse to get in is a few spinning tops.
The downtrend is strong, with no other evidence for it to stop.
Why would you think it should reverse due to several stalling candles?
The buyers at the black candle around the red emoji would often get in out of frustration or revenge trading.
There are more people like that than you think!
A trend starts for a reason and reverses because of a sufficient reason, too.
Meditate on that.
It’s time to study the factors that will stack the odds in your favor.
Let’s get to it!
What consolidation to consider as a trend reversal
Congrats! You’ve patiently gone through the basics and by now should have a rough picture of how markets move.
Now it’s time to get armed with some key concepts to maximize the odds of catching a trend reversal.
The reversal is likelier if you see a consolidation that coincides with the one below.
Here is the list of signs to consider.
- Overextended move
- Critical price levels: supply and demand areas, Fibonacci levels, round prices
- Broken trend structure
- Volume
- Strategic times
Next, we’ll go through specific examples of how each factor looks in the market.
Wait till they make money: overextended move
The further market moves without significant pullbacks, the more early-comers are incentivized to close positions and cash in.
If there are enough people taking profits, the market may reverse.
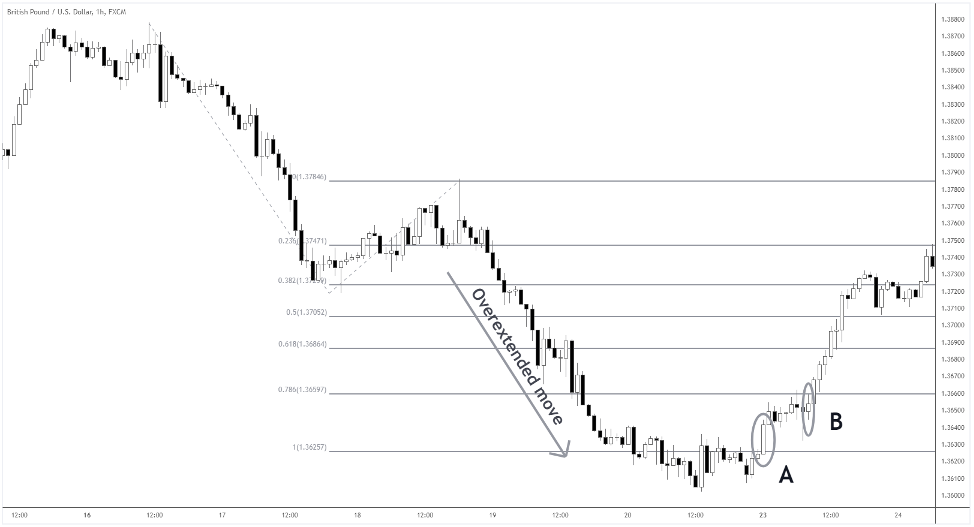
Look at the GBPUSD example above.
After the overextended move, the market started slowing down the decline, as early sellers got enough and started taking profits.
When and where: strategic times and critical price levels
Also, the circled candles “A” and “B” formed at the opening of Tokyo and London sessions, respectively.
Notice how the beginnings of Asian and European sessions triggered the trend reversal.
During any market’s first and last hour, the price action often defines what will happen next.
Look for the clues of the market direction at those strategic times.
Finally, a trend reversal is likely at the critical price levels.
Such levels can be in an area or a specific price – especially Fibonacci and the round ones.
Our GBPUSD trend reversal almost reached the round price – 1.36, while the consolidation was around 1 Fibonacci extension.
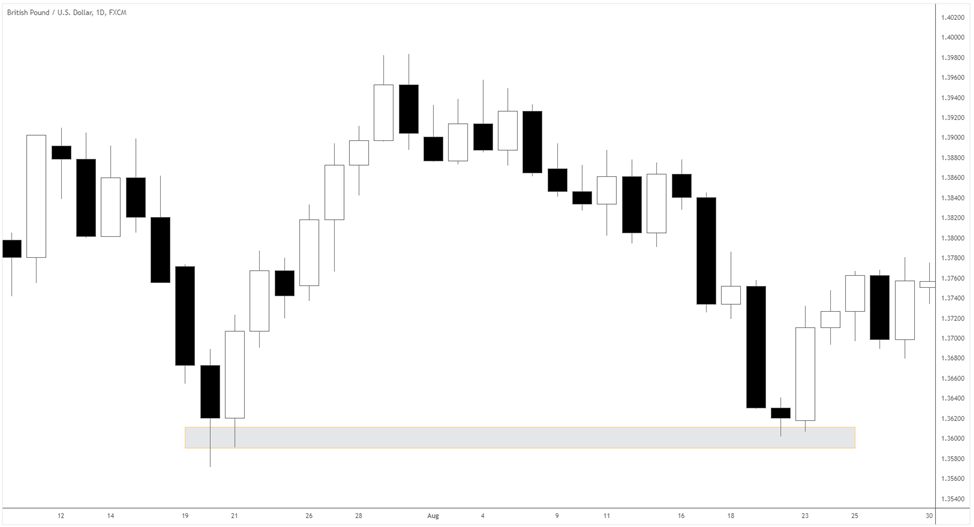
In the daily chart, the reversal happened in a support area (see the daily chart above).
Trend reversal logic – structure and volume
A healthy uptrend has higher highs and lows, while the opposite is true for the downtrend.
If such an order is violated, we get a warning sign that supply and demand forces have shifted.
We see a broken trend structure when the uptrend declines below the higher low.
In a downtrend, the prices should get above the last lower high.
Here’s an example.
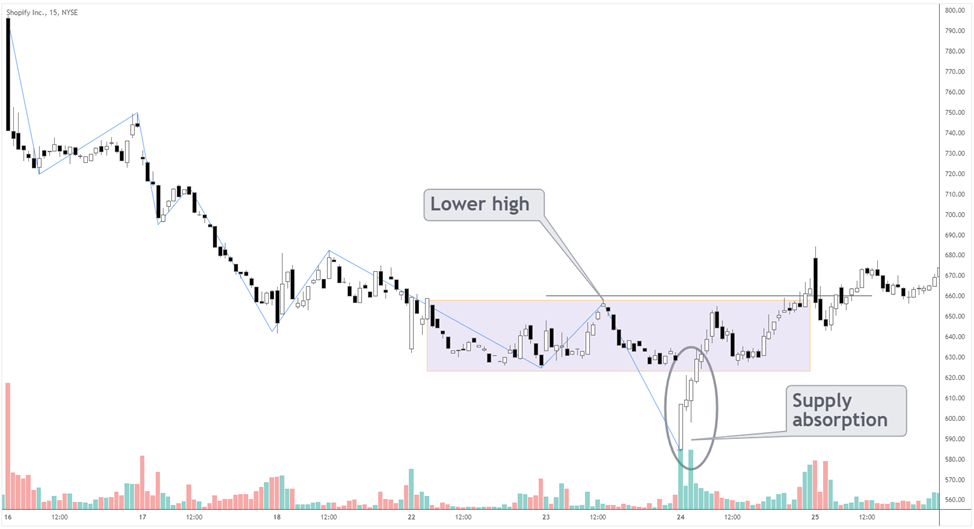
Spotify’s downtrend in the chart above suggested a trend reversal when the market broke above 660.0, the lower high.
The blue line highlights a downtrend swings sequence.
When we look at the volume, the spikes give more evidence for a reversal.
Why is it important?
We should always look for proof of big players entering the market, i.e. smart money trading.
In the Spotify example, the buying volume (see the histogram under the circled area) was extremely high, absorbing the remaining supply.
The buyers were so aggressive in the first hour after opening that they even managed to close the gap down.
Trend reversal chart patterns
What are price action setups?
Once we have identified the appropriate market context, we can look for specific sequences of price fluctuations to place a trade.
Why should we do that?
Understanding the logic behind short-term moves makes it easier to time the entry with a small risk and maximum reward. (This is what the Day Trading Course is about)
You can even find a potential point of “no return.”
Thus, you won’t likely see the market going against you after opening a position.
However, keep in mind that patterns don’t mean anything if the market context is wrong.
Let’s look at the classic chart formations.
H&S
Head and shoulders (H&S) is an extremely popular setup.
At the same time, people tend to see more in it than there is.
H&S is simply an uptrend, where the market failed to make a new high but instead broke the last higher low.
The trend is still viable when we only see the left shoulder (LS) and the head (H).
Then comes the right shoulder (RS) – a failed attempt to continue the trend.
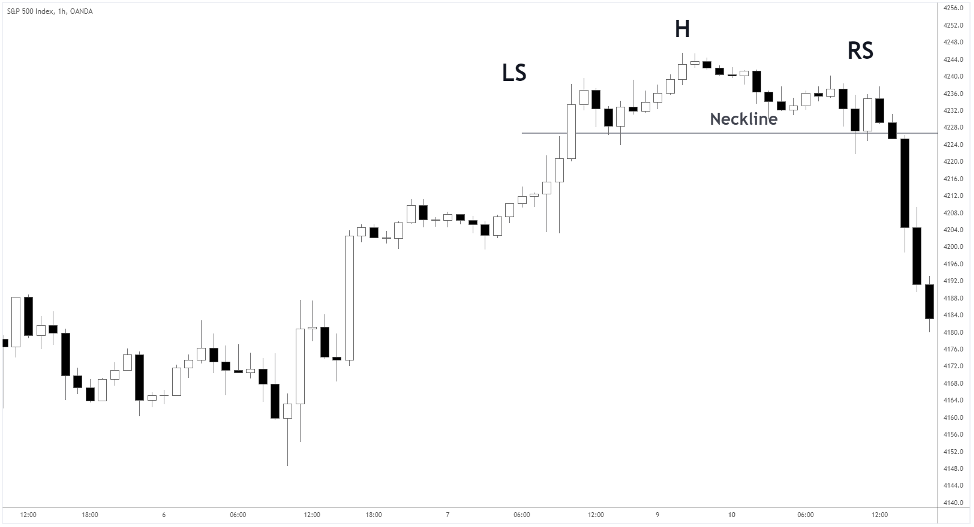
The final step is the disruption of the trend structure, as the market gets below the neckline (see the image above)
You can short-sell once the price breaks below the neckline, with a stop loss above the right shoulder.
The opposite is true for the bullish reversal after an inverse H&S.
Remember, before looking for the pattern, make sure some other significant factors, such as an overextended move, are present.
Failed retest
Here’s a setup that can manifest in a variety of ways.
The idea is the market gets to a specific price and bounces off.
After the prices make a second attempt to make a new high and fail, we conclude the supply may prevail.
The highest quality signal forms when the market gets above the high and sharply falls below, “piercing” the level.
Such a price action often results in a candle with a long wick.
Piercing tells us about the sellers’ zeal to dump an asset asap, providing more evidence of a trend reversal.
Here is an example.
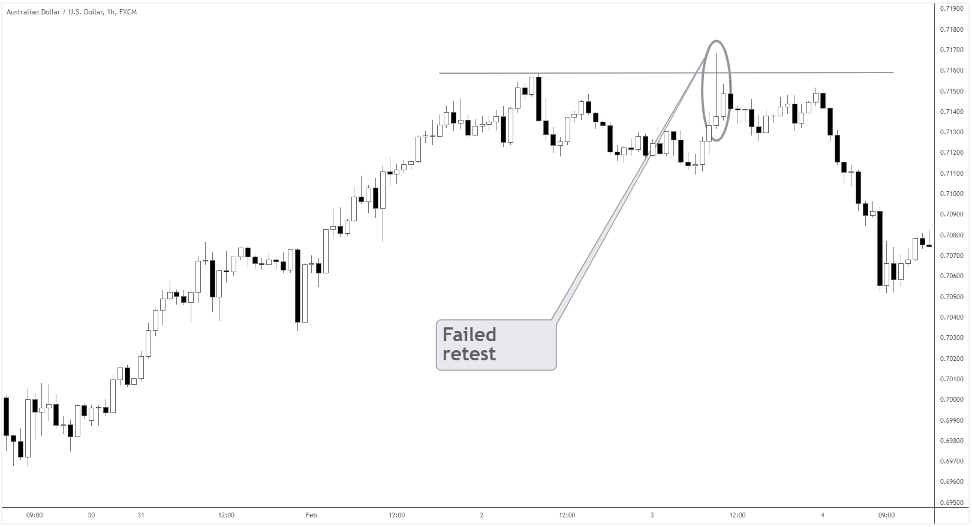
You can sell when the piercing candle closes or at the breakout of one of the local lows.
The opposite logic applies to bullish setups.
Trend reversal candlestick patterns
Japanese candlestick charts give a generalised view of what’s happening in the market.
We can get reversal signals when candles appear with specific properties, such as wick length or candle body size.
One pattern may contain up to five candles.
How does that help?
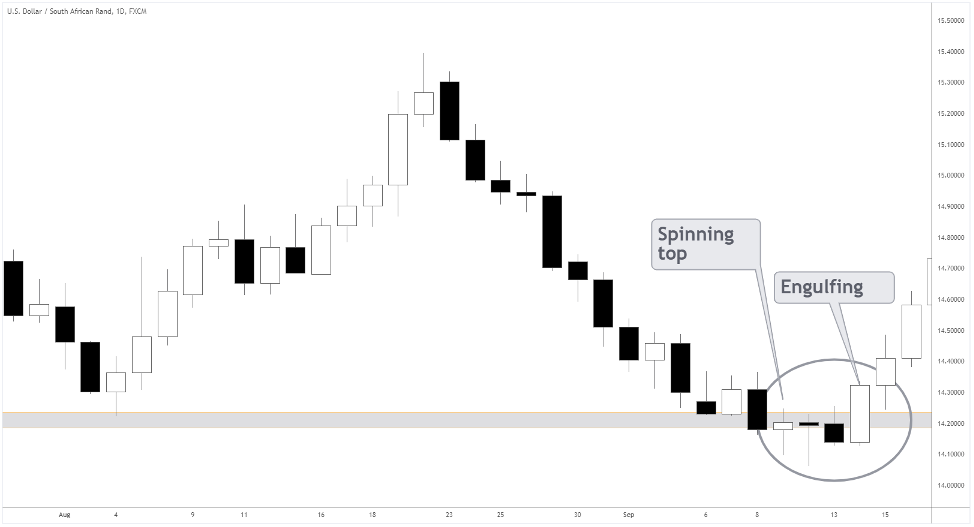
In the example above, the circled area highlights several candle patterns.
The spinning top (small body with similar upper and lower wicks) shows indecision among market participants.
The bullish engulfing (a big white candle that “engulfs” the previous one) signals entering a long trade.
Notice that both formations came up at the demand zone (a grey area) around 14.2, which adds credibility to the reversal.
A pattern is considered complete when its candle closes.
You can buy at the close or the breakout above the upper wick.
Set the protective stop below the pattern’s low or a local one.
Makes sense?
For the bearish setups, the opposite logic applies.
Risk/reward and psychology in a trend reversal
One of the primary trading objectives is to balance the size of losses and profits.
Plan your strategy in the way that over a significant sample of trades, you would end up in profit.
Often, individual trades seem to make sense, but after a hundred of them, the net result is a loss.
How to prevent it?
Let’s find out.
What is RR and why it matters
Risk (R) is the distance between your entry and the stop loss.
Use a logical place to place the protective stop; otherwise, your R wouldn’t be objective.
Does the market invalidate your trading idea after reaching your stop loss?
The critical concept to measure the performance of a trade is a Risk/Reward ratio (RR).
Strive to get at least 1:2 RR – if it’s lower, you’ll have to be right more than 60% of time (to justify broker fees), which is very challenging.
Keep in mind the wider the stop is, the smaller an appropriate RR tends to be.
Below is the example.
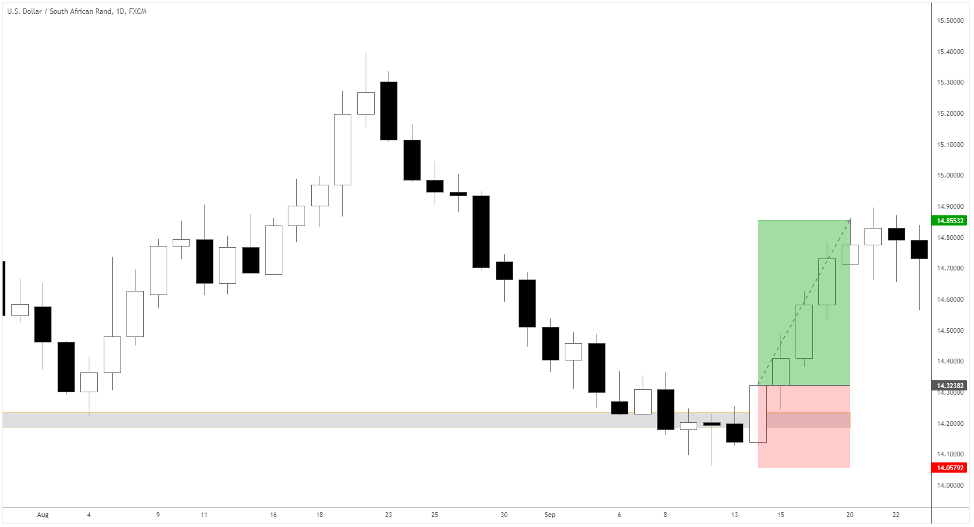
Here we buy USDZAR at the close of the engulfing pattern and set the stop loss below the whole swing low.
The objective RR is around 1:2.
You’d get the maximum confirmations of the setup validity, sacrificing RR instead.
Let’s look at the alternative.
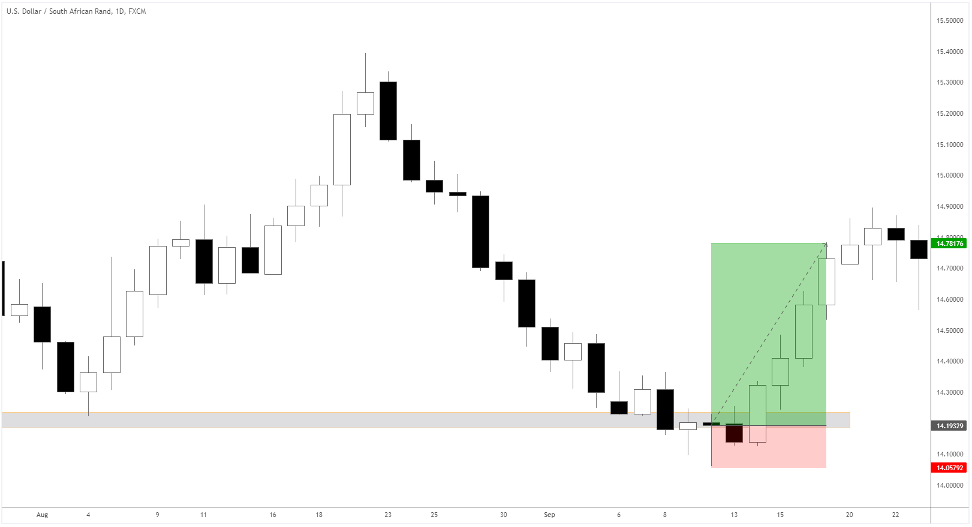
The same situation but a different approach – we buy at the first signs of reversal, disregarding significant confirmations.
In this case, the RR is bigger, but the win rate is likely to decrease.
How psychology can affect your trade management
Imagine you’re employing a high RR approach, say, 1:3 or higher.
With such an RR, you can expect the win rate to be under 40%.
Therefore, statistically speaking, at some point, you’ll face eight trades losing streak over a big sample of trades.
Can you handle that?
The psychology drastically changes after a series of losses.
If you’re not prepared mentally, you risk not being able to hold on to the position when the market pulls back against you.
Also, the fear of missing out (FOMO) may kick in, affecting the quality of the next setup you pick.
A word about exits
Most people pay the closest attention to entry techniques.
However, we make (or lose) money in a trend reversal when we exit the market, not enter it.
Think about it!
Start building your trade management framework by defining what moves you seek.
Is it a brief stop-hunting impulse or a full-scale trend reversal?
Do you expect any deep retracements against you, or it must be a smooth move?
Stay flexible when holding a position, as the market can present new compelling evidence.
We often think the market would do one thing but act like it’s doing something else.
Look at the trend reversal setup below.
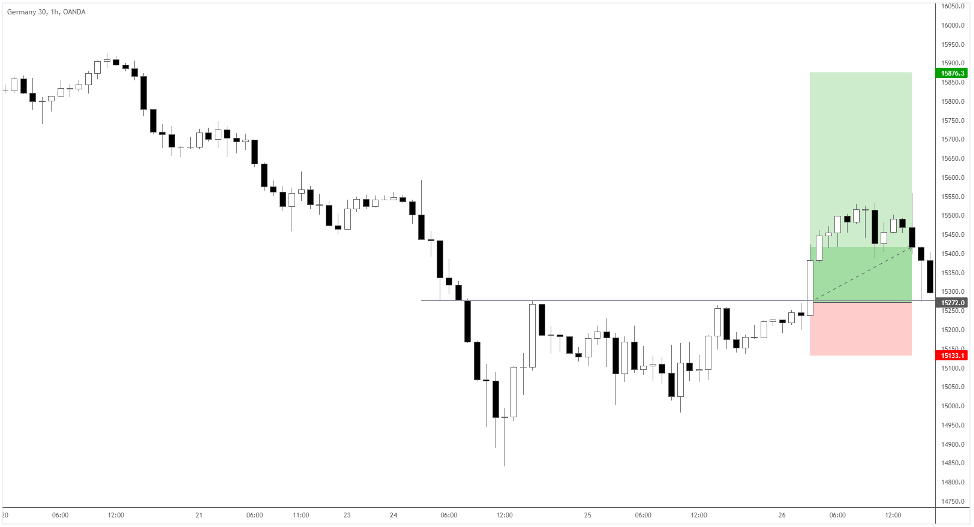
Suppose you’re holding the long trade, and the market shows a failed retest around 15550.
You witnessed a reversal signal against you.
Do you still believe the market is going higher?
If yes – get ready for a deep correction; if not – close the trade.
Avoid cognitive dissonance, and you’ll do well.
Manage your expectations trading a trend reversal
The asset where you’re trying to catch a trend reversal impacts overall profitability.
What makes a difference?
Some markets trend more than others; thus, genuine reversals are rarer.
Volatility is different even within instruments of the same asset class, so you also want to consider it.
The market you’re trading
The sole purpose of the stock market is to grow over time, which can’t be said about forex.
Here is a screenshot the technology index, Nasdaq.
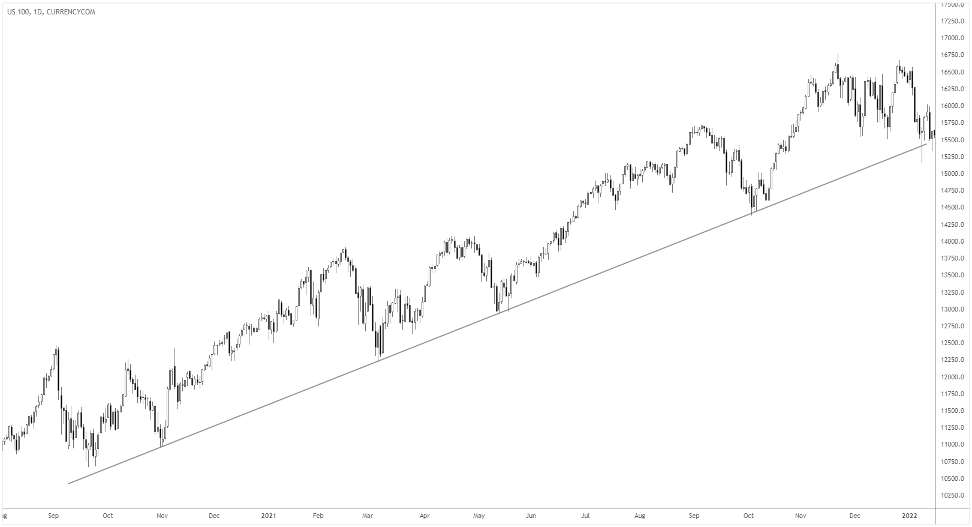
There are retracements, but the asset is in an uptrend most of the time.
Compare it with EURUSD for the same period.
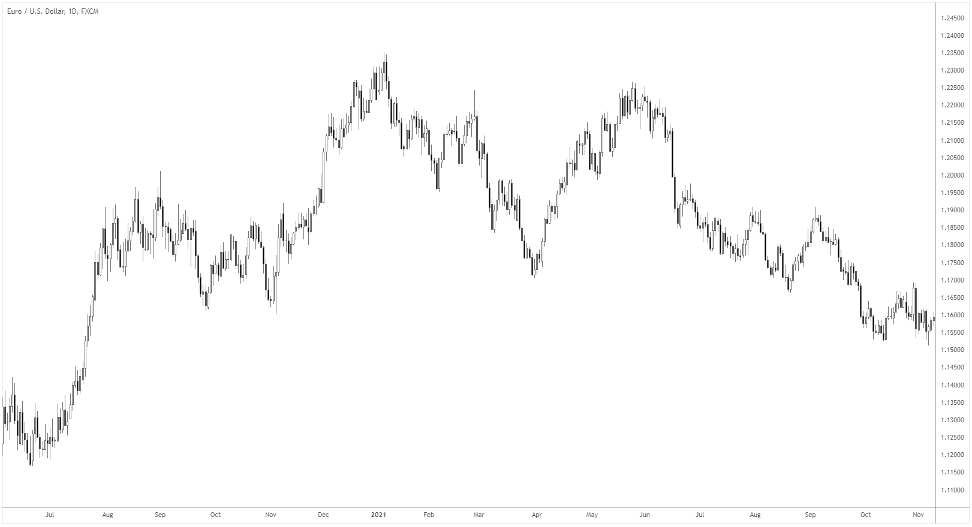
It’s choppier and thus, trend reversals are likelier.
ATR
Average True Range (ATR) shows how far the market moves on average for a given period.
When considering a reversal setup ask if it it has really run out of steam.
If you’re a day trader, look at the average daily move.
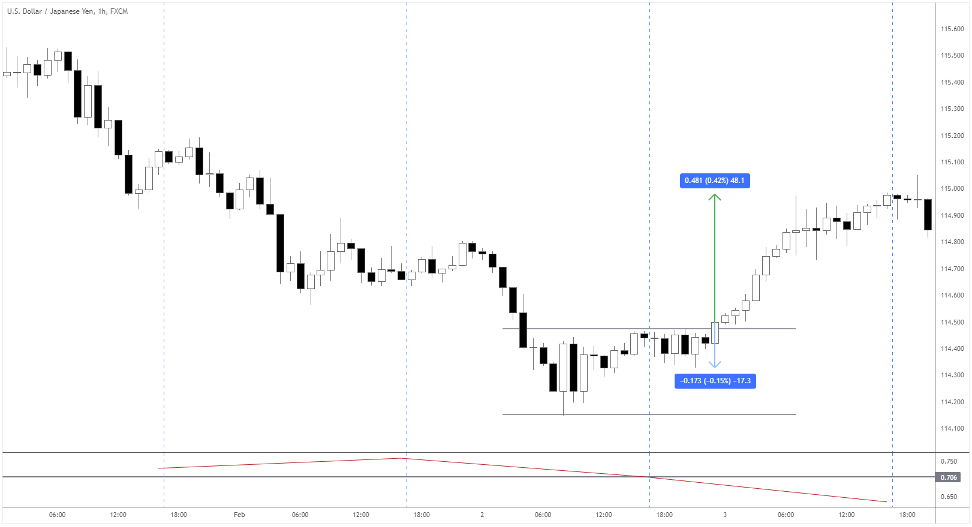
In the example above, we would enter the trend reversal around 114.5, the horizontal level breakout.
While before the entry, the market moved 17.3 pips on that day, the average volatility is 70.6 pips (see the ATR window).
Thus, a potential move is 70.6-17.3=53.3 pips.
Make sure that you always have such stats stacked in your favor.
Of course, if there are important news releases, the market may go a lot further.
Trend reversal summary
There’s no certainty in the markets. What seems to be orderly can change at any time.
There are two market states: trend and range.
In general, what we call a trend reversal is the transition between the two.
We looked through the clues of the prices’ next step.
The more evidence of the reversal you can gather, the better.
However, avoid perfectionism.
You’ll already do excellent finding at least a strong critical level that’s approached by the overextended market.
Finally, take your mental framework seriously, defining your objectives and expectations.
Key Articles Used:
How to Trade With Supply and Demand Zones