Dow Jones Trading Analysis 09.11.2022
Dear traders,
Last time I shared with you my EURUSD trading analysis.
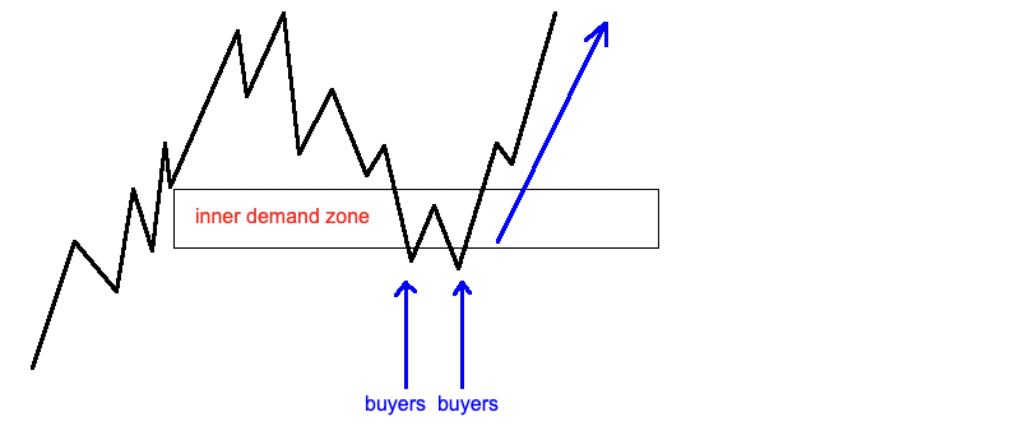
Price initially went down and found an internal demand zone.
This acted as a bullish signal for a lot of supply and demand traders and the price went back up.
Here is a quick illustration of how an inside supply and demand zone looks in practice:

This is exactly what happened with EURUSD this week.
After an initial sell-off, we saw the price bouncing back up to where the sell-off started from.
This is a very typical pattern when it comes to internal demand zones.
If you want to get more in-depth understanding of these and a lot more supply and demand patterns, you can check out the Ultimate Supply and Demand course HERE.
Dow Jones Trading Analysis 09.11.2022
Today is all about Dow Jones.
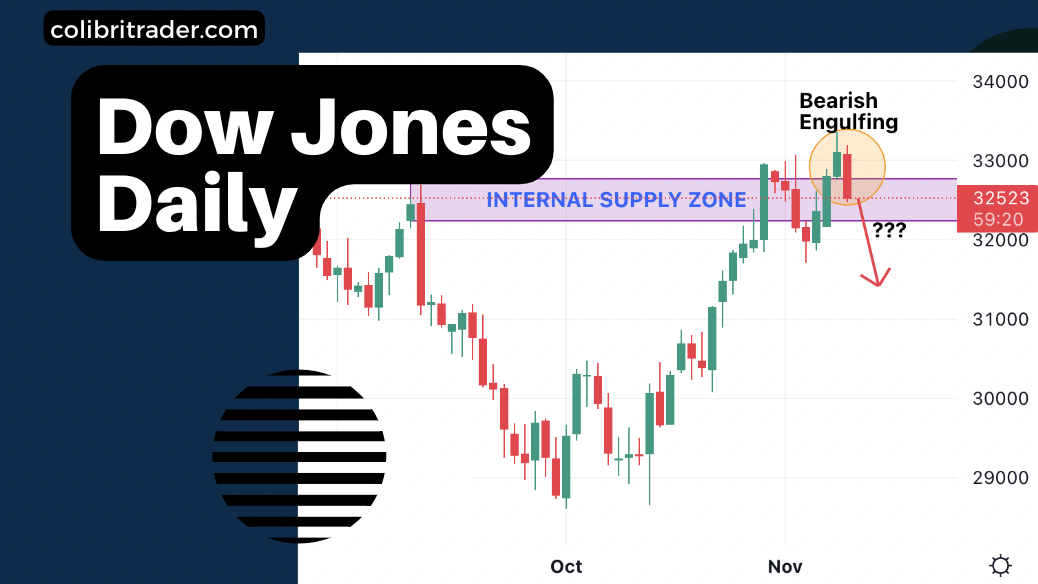
There is a bearish engulfing pattern that formed on the daily timeframe.
This coincided with an internal supply zone as indicated in the screenshot.
Very identical scenario to the EURUSD setup, this pattern is more bearish than bullish.
I will be looking for further confirmation during tomorrow’s session.
What I will be looking for is a confirmation from the 4H chart.
This could be either a bearish engulfing, pin bar or an inside bar.
Happy Trading,
Colibri Trader
P.S.
Have you read my article on 5 Dow Jones Real Day Trading Examples


