7 Powerful Price Action Trading Strategies for 2025
Unlock Market Secrets with Price Action
Tired of complex indicators and confusing analysis? Price action trading offers a streamlined approach, focusing purely on price movements to make informed decisions. This method empowers traders to understand market sentiment directly from the charts. In this article, we’ll explore seven fundamental price action trading strategies you can start using today. You will learn practical techniques covering Support and Resistance, Pin Bars, Inside Bars, Engulfing Patterns, Breakouts, Trend Lines, and Price Channels. Mastering these concepts provides a clearer path to interpreting market behavior and identifying potential trading opportunities without relying on lagging indicators.
1. Support and Resistance Trading
At the heart of virtually all price action trading strategies lies the fundamental concept of Support and Resistance (S&R). It’s arguably the most foundational and widely used technique, making it the essential starting point for understanding how markets move based purely on price history. Support and resistance trading involves identifying key horizontal price levels on a chart where the market has historically shown a tendency to stall or reverse. Support acts like a price floor, an area where buying demand is typically strong enough to overcome selling pressure, causing prices to bounce upwards. Conversely, resistance acts as a price ceiling, where selling pressure tends to overwhelm buying demand, leading to a price decline. Understanding and utilizing these levels allows traders to anticipate potential turning points and make informed trading decisions directly from the price chart.

How it Works:
The formation of support and resistance levels stems from market psychology and order flow. When prices fall to a level where buyers previously stepped in aggressively (creating a swing low), those buyers (and new ones recognizing the level) may defend it again, creating support. Similarly, when prices rise to a level where sellers previously dominated (creating a swing high), those sellers (and new ones) might re-emerge, creating resistance. These levels are identified by looking at historical price data, specifically significant swing highs and swing lows where price reversed direction.
Why This Strategy Deserves the #1 Spot:
Support and Resistance trading earns its place as the cornerstone of price action analysis due to its simplicity, universality, and direct reflection of supply and demand dynamics. It provides a clear framework for interpreting price movements without relying on lagging indicators. For novice traders, it offers an accessible entry point into technical analysis, while experienced traders continuously rely on it for context, entry/exit points, and risk management. It forms the basis upon which many other price action patterns and strategies are built.
Key Features and Benefits:
- Clear Visual Cues: S&R levels are represented by horizontal lines or zones drawn directly on the price chart, providing straightforward visual reference points.
- Historical Significance: These levels gain strength and reliability the more times they are tested and respected by price. Levels identified on higher timeframes (like daily or weekly charts) tend to hold more significance than those on lower timeframes.
- Role Reversal Principle: A crucial feature is the concept of role reversal. Once a resistance level is decisively broken to the upside, it often transforms into a new support level. Conversely, when a support level is broken to the downside, it frequently becomes future resistance. This phenomenon provides ongoing trading opportunities.
- Objective Decision Points: S&R levels offer relatively objective points for planning trades. Traders can look to buy near support or sell near resistance, providing clear logic for entry.
- Risk Management Framework: These levels are invaluable for setting stop-loss orders. For instance, a trader buying at support might place their stop-loss just below that level, defining their maximum risk on the trade.
- Versatility: This strategy is applicable across all financial markets (stocks, forex, commodities, crypto) and across all timeframes (from intraday scalping to long-term investing).
Pros:
- Simple to Understand and Identify: The core concept is intuitive and levels can be visually identified on almost any price chart.
- Universally Applicable: Works across different markets and timeframes.
- Provides Clear Entry/Exit/Stop Levels: Offers concrete reference points for trade planning and risk management.
- Combinable: Easily integrated with other technical indicators, chart patterns, or candlestick analysis for added confirmation (confluence).
Cons:
- Subjectivity: While the concept is simple, pinpointing the exact level can be subjective; different traders might draw slightly different lines. Using zones instead of precise lines can mitigate this.
- False Breakouts: Price may temporarily pierce through a level only to reverse sharply (a “fakeout”), trapping traders who entered on the breakout.
- Less Effective in Strong Trends: In powerful, one-directional trends, price might slice through minor S&R levels with little hesitation, making pullback entries more suitable.
- Requires Patience: Trading S&R often involves waiting for price to reach a pre-identified level, which demands discipline and patience.
When and Why to Use Support and Resistance Trading:
This approach is particularly effective in:
- Ranging Markets: When price is oscillating between clear upper (resistance) and lower (support) boundaries.
- Trend Pullbacks: Identifying potential entry points during corrections within an established trend (e.g., buying a pullback to a former resistance-turned-support level in an uptrend).
- Defining Risk: Setting logical stop-loss orders just beyond S&R levels.
- Setting Profit Targets: Using upcoming S&R levels as potential areas where price might stall or reverse to take profits.
It is a foundational element of price action trading strategies because it helps traders gauge the market’s structure and anticipate areas where buying or selling pressure might intensify, purely based on historical price behavior.
Examples of Implementation:
- Trading the Bounce: An asset is in an overall uptrend but experiences a pullback. A trader identifies a key horizontal support level (perhaps a previous swing high that broke and became support). As price approaches this level and shows signs of rejecting lower prices (e.g., bullish candlestick patterns), the trader enters a long position, placing a stop-loss just below the support zone.
- Shorting at Resistance: A stock has tried multiple times to break above $50 but failed, establishing strong resistance. When the price approaches $50 again and forms bearish reversal patterns (like a pin bar or engulfing pattern), a trader might initiate a short position, anticipating another rejection, with a stop-loss just above the resistance zone.
- Breakout and Retest: Price breaks convincingly above a long-standing resistance level. Instead of chasing the breakout, a patient trader waits for price to pull back and retest the former resistance level, which should now act as support. If the level holds, the trader enters long.
Actionable Tips for Success:
- Use Higher Timeframes: Identify major S&R levels on daily, weekly, or even monthly charts first, as these hold more weight. Then, use lower timeframes for precise entry signals.
- Think in Zones, Not Lines: Price rarely reverses at an exact pixel-perfect level. Draw S&R as narrow zones or areas to account for minor overshoots or undershoots.
- Look for Confluence: S&R levels become more reliable when they coincide with other technical factors, such as Fibonacci retracement levels, moving averages, trendlines, or pivot points.
- Confirm with Volume: A bounce off support accompanied by increasing volume suggests strong buying interest. A rejection at resistance with high volume indicates significant selling pressure. Low volume reactions might be less convincing.
- Note Level Strength: The more times a level is tested and holds, the more significant it becomes. However, be aware that repeated tests can also weaken a level, making it more susceptible to eventually breaking.
- Watch for Role Reversal: Actively look for opportunities where broken support becomes new resistance, or broken resistance turns into new support.
Support and resistance analysis, championed by technical analysis pioneers like John J. Murphy and Martin Pring, remains a vital skill for anyone employing price action trading strategies. Its mastery provides a solid foundation for reading market dynamics and making more informed trading decisions.
2. Pin Bar (Pinocchio Bar) Pattern Trading
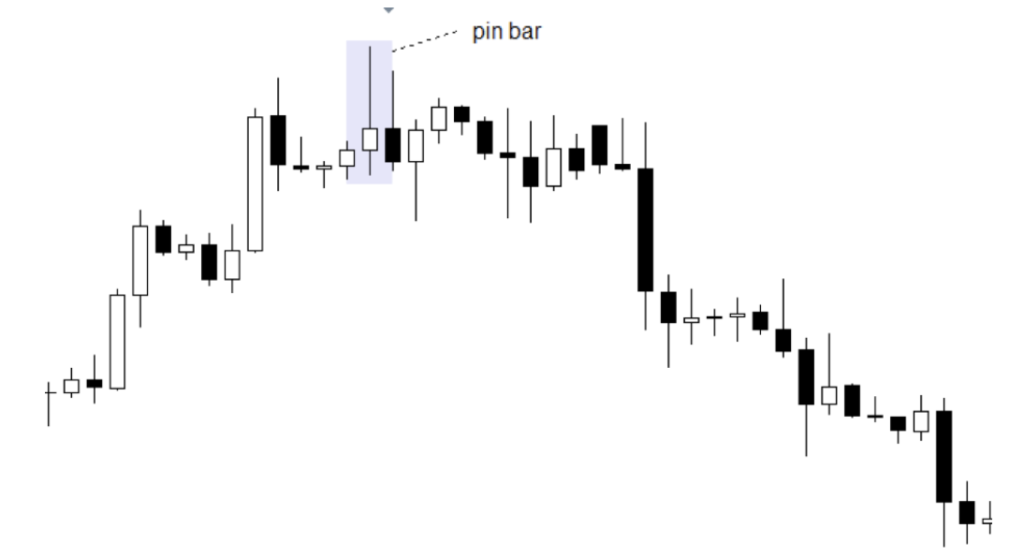
The Pin Bar, often nicknamed the “Pinocchio Bar,” stands as a cornerstone pattern within many successful price action trading strategies. It’s a single candlestick formation renowned for its ability to signal a potential reversal in the market’s direction. The core idea behind the Pin Bar is price rejection. It visually represents a scenario where the market tested a specific price level but was strongly pushed back, suggesting that the prevailing momentum might be fading and a move in the opposite direction could be imminent. Its simplicity and visual clarity make it a favorite among traders analyzing raw price charts.

How it Works: The Story of Rejection
Imagine the price moving strongly in one direction. It then pushes significantly further, creating a long wick (also called a shadow). However, by the time the candle closes, the price has retreated substantially, leaving that long wick pointing outwards and closing near the opening price. This long wick is the key – it’s the “nose” of Pinocchio, indicating the market was “lying” about its intention to continue in that direction.
- Bullish Pin Bar: Forms after a downtrend or during a pullback in an uptrend. It has a long lower wick, indicating rejection of lower prices. The small body is near the top of the candle. This suggests buyers stepped in forcefully to prevent further declines.
- Bearish Pin Bar: Forms after an uptrend or during a bounce in a downtrend. It has a long upper wick, indicating rejection of higher prices. The small body is near the bottom of the candle. This suggests sellers overwhelmed buyers at that peak.
Why This Pattern Deserves Its Place
The Pin Bar is included in this list of essential price action trading strategies because it offers a clear, visually identifiable signal of a potential shift in market sentiment at a specific price point. Unlike complex indicators, it’s based purely on price itself. When found at significant market levels, it can provide high-probability entry points with well-defined risk. Its effectiveness in signalling powerful reversals makes it invaluable for traders looking for favourable risk-reward opportunities.
Key Features & Characteristics:
- Single Candlestick: The entire signal is contained within one price bar.
- Small Real Body: The distance between the open and close price is relatively small compared to the overall candle range.
- Long Wick/Shadow: One wick is significantly longer than the body, ideally at least two to three times its size. This long wick shows the price rejection.
- Minimal Opposite Wick: The wick on the side of the real body should be very small or non-existent.
- Context is Crucial: Most powerful when appearing at key support/resistance levels, Fibonacci levels, moving averages, or after a pronounced trend.
When and Why to Use Pin Bar Trading:
Use the Pin Bar strategy primarily to:
- Identify Potential Reversals: Spot potential tops in uptrends (bearish pin bar) or bottoms in downtrends (bullish pin bar).
- Trade Pullbacks within Trends: Enter a trade in the direction of the primary trend when a pin bar forms after a retracement to a key level (e.g., a bullish pin bar at support during an overall uptrend).
- Set Clear Risk Levels: The end of the long wick provides a logical place to set a stop-loss order, defining the risk on the trade clearly.
The reason why it works stems from the psychology of the market. The long wick demonstrates a failed attempt by one side (buyers or sellers) to push prices further, followed by a decisive victory for the opposing side within that single candle’s duration. This rapid shift often precedes a more sustained move.
Examples of Successful Implementation:
- Bullish Reversal at Support: After a steady decline, the price hits a previously established support level. A Pin Bar forms with a long lower wick piercing just below the support but closing back above it. This signals strong buying pressure at that level, presenting a potential long entry.
- Bearish Reversal at Resistance: During a strong uptrend, the price reaches a major resistance zone or a significant round number (e.g., 1.1000 in EUR/USD). A Pin Bar forms with a long upper wick touching or slightly exceeding the resistance, but closing well below it. This indicates sellers defended the level aggressively, suggesting a possible short entry.
- Trend Continuation: In an established uptrend, the price pulls back to a dynamic support level like the 50-period moving average. A bullish Pin Bar forms right off the moving average, signalling the pullback might be over and the uptrend is likely to resume.
Actionable Tips for Trading Pin Bars:
- Wait for the Close: Never act on a Pin Bar until the candle has fully closed. What looks like a Pin Bar mid-formation can change entirely by the close.
- Prioritize Prominent Wicks: Look for Pin Bars whose wicks clearly stand out from the surrounding price action. A long wick relative to recent candles adds significance.
- Context is King: A Pin Bar in the middle of nowhere is far less reliable than one forming at a confluence of support/resistance, trendlines, or Fibonacci levels. Always analyze the bigger picture.
- Stop Loss Placement: Place your stop loss just beyond the tip of the long wick (below the low for a bullish pin bar, above the high for a bearish pin bar).
- Entry Strategy: Common entries are at the market open of the next candle, or on a retracement back towards the 50% level of the Pin Bar’s wick (more conservative).
- Combine with Trend: Trading Pin Bars in the direction of the dominant, longer-term trend generally yields higher probability results.
- Consider Timeframe: Pin Bars tend to be more reliable on higher timeframes (4-hour, Daily, Weekly) than on very short-term charts (like 1-minute or 5-minute) which are prone to more noise.
Pros:
- Clear visual pattern, relatively easy to identify even for newer traders.
- Provides specific entry trigger points.
- Offers logical and tight stop-loss placement (just beyond the wick).
- Highly effective when formed at significant technical levels (S/R, pivots, MAs).
- Can signal powerful reversals, leading to excellent risk-reward ratios.
Cons:
- Can generate false signals, especially in choppy or range-bound markets without clear direction.
- Often requires confirmation from subsequent price action (e.g., the next candle moving in the anticipated direction).
- Less reliable on lower timeframes due to market noise.
- Should not be traded in isolation; requires context and confluence with other technical factors.
Popularized By:
Figures like Nial Fuller, Martin Pring, and Al Brooks are well-known proponents and educators who frequently discuss candlestick analysis, including the Pin Bar, within their broader price action trading strategies. Their work has helped solidify the Pin Bar’s reputation as a valuable tool for chart analysis.
In summary, mastering the Pin Bar pattern provides traders with a potent tool for identifying potential turning points and high-probability entries, making it an indispensable component of effective price action trading strategies.
3. Inside Bar Trading Strategy
The Inside Bar Trading Strategy is a core technique within the arsenal of price action trading strategies, focusing on a specific two-candlestick pattern that signals market consolidation and potential future volatility. It’s a widely recognized pattern used by traders across various markets (Forex, Stocks, Commodities) to identify potential breakout opportunities. The premise is simple: a period of reduced volatility and range contraction (the inside bar) often precedes a significant price expansion.

What is an Inside Bar and How Does it Work?
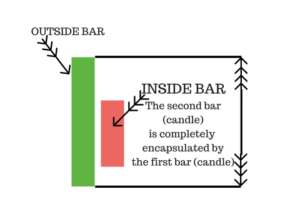
An Inside Bar pattern consists of two candlesticks:
- The Mother Bar: This is the first candlestick in the pattern. It typically has a relatively large range (the distance between its high and low), often appearing after a strong directional move.
- The Inside Bar: This is the second candlestick. Its defining characteristic is that its entire range (both its high and low) is contained within the high and low range of the preceding Mother Bar. The Inside Bar is visually smaller and nestled inside the previous candle’s range.
This pattern signifies a temporary pause or equilibrium in the market. Buyers and sellers have reached a short-term stalemate following the movement represented by the Mother Bar. This indecision point or consolidation phase represents coiled energy. Traders anticipate that this contraction in volatility will eventually resolve with a breakout, where price moves decisively above the Mother Bar’s high or below its low. The strategy aims to capture the ensuing move as volatility expands again. Multiple inside bars can form consecutively within a single mother bar’s range, indicating even greater consolidation and potentially a more powerful eventual breakout.
Why is this Strategy Important in Price Action Trading?
The Inside Bar deserves its place among essential price action trading strategies because it offers:
- Clarity: The pattern itself is visually distinct and easy to identify on a price chart.
- Defined Risk: Entry and stop-loss levels are clearly suggested by the pattern’s structure (the high and low of the Mother Bar).
- Contextual Significance: Its effectiveness is often enhanced when it appears at key technical levels (support/resistance, moving averages) or following strong trends, providing context to the consolidation.
- Versatility: It can signal both trend continuation and potential reversals, depending on the market context and the direction of the breakout.
Features and Benefits:
- Feature: Two-candle pattern; second candle’s high < first candle’s high AND second candle’s low > first candle’s low.
- Benefit: Easy visual identification on any timeframe.
- Feature: Often follows a large-range “Mother Bar”.
- Benefit: Indicates significant prior momentum potentially pausing before continuation.
- Feature: Inside bar represents reduced range and volatility.
- Benefit: Signals market indecision and potential “coiling” energy for the next move.
- Feature: Multiple inside bars can form.
- Benefit: Suggests stronger consolidation and potentially a more explosive breakout.
- Benefit: Provides clear, objective entry points (breakout of Mother Bar range).
- Benefit: Offers logically placed stop-loss levels (beyond the opposite end of the Mother Bar).
- Benefit: Can lead to favorable risk-reward ratios when breakouts are successful.
When and Why to Use the Inside Bar Strategy:
This strategy is most effective in specific market conditions:
- Trending Markets: Look for Inside Bars forming after a pullback to a support level in an uptrend, or after a rally to a resistance level in a downtrend. Trading the breakout in the direction of the established trend often yields higher probability results (e.g., entering long on an upside break in an uptrend).
- Key Support and Resistance Levels: An Inside Bar forming right at a major horizontal support or resistance level can signal that the level is holding, and a breakout away from the level might be imminent.
- Following Strong Momentum: After a significant price thrust, an Inside Bar represents the market catching its breath. The subsequent breakout often continues in the direction of the initial thrust.
Use this strategy because it provides a structured way to trade breakouts stemming from periods of consolidation, capitalizing on the principle that low volatility is often followed by high volatility.
Examples of Implementation:
- Uptrend Continuation: Price is in a clear uptrend. It pulls back slightly and forms a Mother Bar followed by an Inside Bar near a key moving average. A trader enters long when price breaks above the high of the Mother Bar, placing a stop loss below the low of the Mother Bar.
- Resistance Breakout: Price rallies to a known resistance level and stalls, forming a large Mother Bar followed by one or more Inside Bars just below the resistance. A breakout above the Mother Bar’s high (and the resistance level) triggers a long entry, anticipating further upside.
- Forex Consolidation: During quieter trading sessions or after a major news release has been absorbed, pairs like EUR/USD might form Inside Bars on H4 or Daily charts, indicating consolidation. Traders watch for a breakout from the Mother Bar’s range to signal the next directional bias.
Actionable Tips for Trading Inside Bars:
- Trend is Your Friend: Prioritize Inside Bar setups that align with the dominant market trend on higher timeframes. Breakouts against a strong trend are more likely to fail.
- Strategic Stop Loss: Always place your stop loss. A common placement is just beyond the opposite side of the Mother Bar (e.g., if entering long on a break above the Mother Bar high, place the stop just below the Mother Bar low).
- Volume Confirmation: Ideally, volume should decrease during the formation of the Inside Bar(s), indicating fading conviction in the pause. An increase in volume on the breakout candle adds confirmation.
- Timeframe Matters: Inside Bars on higher timeframes (like Daily, H4) generally filter out more noise and lead to more reliable signals compared to lower timeframes (M1, M5, M15).
- Context is Key: Avoid trading Inside Bars that form in choppy, directionless markets or during very low liquidity periods (e.g., major holidays, late sessions) as false breakouts are more common.
- Patience Pays: Wait for a decisive close outside the Mother Bar’s range rather than just an intra-candle wick break, as this helps filter false signals.
Pros:
- Clearly defined entry triggers (break of Mother Bar high/low).
- Objective stop loss placement (other side of Mother Bar).
- Works effectively as a continuation signal in established trends.
- Can pinpoint high-probability breakout zones after consolidation.
- Often allows for favorable risk-to-reward setups.
Cons:
- Susceptible to “false breakouts,” where price breaks the Mother Bar range briefly but then reverses. This is more common in range-bound or choppy markets.
- Less reliable during extreme volatility or right before major news events, where price can gap or move erratically.
- Requires patience to wait for the pattern to form correctly and for the breakout to occur.
- Not every Inside Bar leads to a significant move; some result in continued range-bound activity.
Popularized By:
While a fundamental price action pattern, its strategic application has been highlighted and refined by respected traders and educators such as Nial Fuller, Mark Douglas (in discussions of market psychology and patterns), and Kathy Lien.
By understanding the structure, context, and nuances of the Inside Bar, traders can add a powerful tool to their repertoire of price action trading strategies, enabling them to identify and capitalize on potential market breakouts with defined risk.
4. Engulfing Candle Pattern Strategy
Why it’s on the list: The Engulfing Candle Pattern is a cornerstone of candlestick analysis and a fundamental element within many price action trading strategies. Its visual clarity and potent indication of a potential momentum shift make it indispensable for traders seeking to identify reversals directly from price charts. It deserves its place because it represents a clear, two-candle battle conclusion where one side (buyers or sellers) decisively overwhelms the other, offering actionable insights without relying on lagging indicators. Popularized by pioneers like Steve Nison who brought Japanese candlestick techniques to the West, and validated through analysis by figures like Thomas Bulkowski, it’s a globally recognized and respected pattern.
What is the Engulfing Candle Pattern Strategy?
This strategy revolves around identifying and trading a specific two-candlestick formation known as the Engulfing Pattern. This pattern signals a potential reversal of the current trend. It manifests in two forms:
- Bullish Engulfing Pattern: Occurs after a downtrend (or pullback). It consists of a small bearish (red/black) candle followed by a larger bullish (green/white) candle whose body completely engulfs or covers the body of the previous bearish candle. This signifies that buyers have stepped in forcefully, overwhelming the previous selling pressure, and potentially starting an upward move.
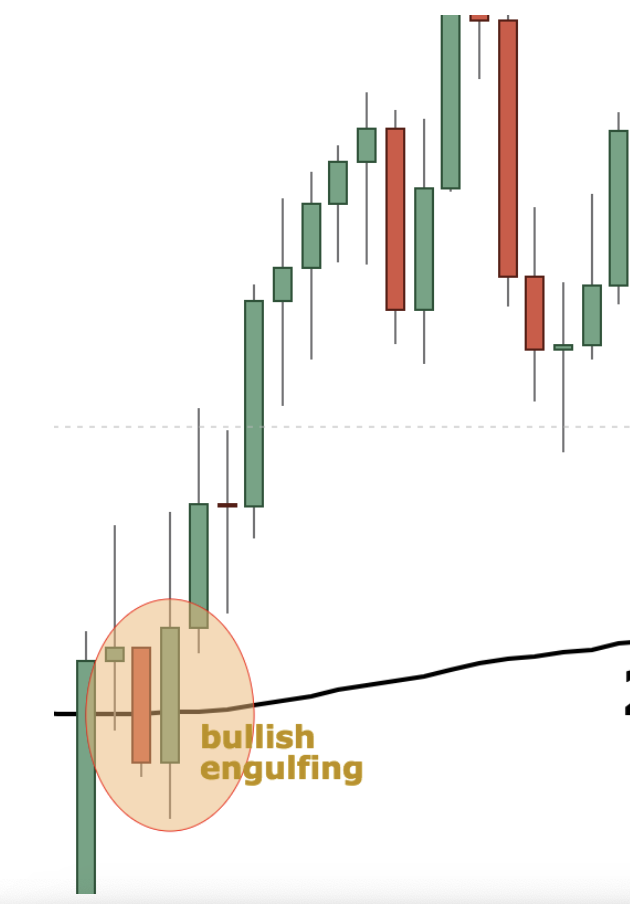
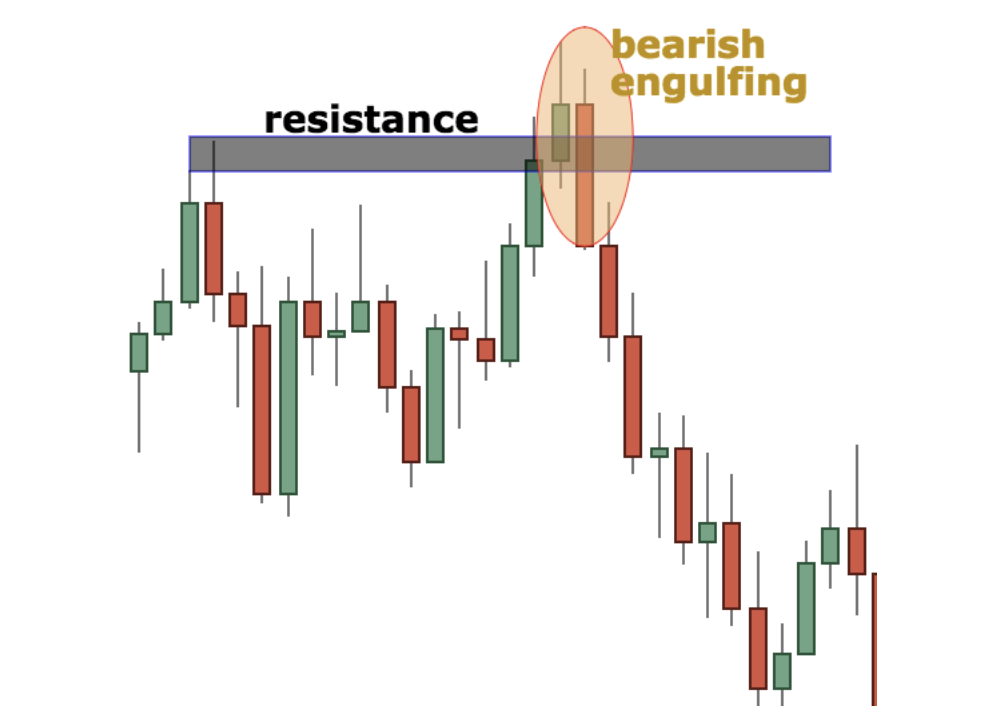
- Bearish Engulfing Pattern: Occurs after an uptrend (or rally). It consists of a small bullish (green/white) candle followed by a larger bearish (red/black) candle whose body completely engulfs the body of the previous bullish candle. This indicates that sellers have taken decisive control from the buyers, potentially initiating a downward move.
The core idea is that the second candle’s strong price action in the opposite direction signifies a rapid and powerful shift in market sentiment.
How it Works & Key Features:
The effectiveness of this price action trading strategy hinges on recognizing these key features:
- Two-Candle Formation: The pattern is always composed of two adjacent candlesticks.
- Engulfing Body: The crucial element is that the body of the second candle must completely contain or “engulf” the body of the first candle. The wicks (shadows) are less critical for the pattern definition itself, though long wicks can add nuance.
- Opposite Colors: The body of the second candle must be the opposite color of the first candle’s body (excluding Dojis, which require context). A green candle engulfing a red candle is bullish; a red candle engulfing a green candle is bearish.
- Location Matters: The pattern is most reliable when it forms at the end of a distinct trend or at significant technical levels like major support/resistance zones, pivot points, or trend lines.
- Size Indicates Strength: The larger the engulfing (second) candle relative to the first candle and recent price action, the stronger the potential reversal signal is considered. A massive engulfing candle suggests a very strong conviction from the new dominant side.
Why and When to Use This Approach:
Use the Engulfing Pattern strategy when you are looking for:
- Trend Reversal Signals: Its primary use is to spot potential turning points in the market.
- Confirmation at Key Levels: When price reaches a predetermined support or resistance level, an engulfing pattern provides strong visual confirmation that the level might hold and trigger a reversal.
- Entry Signals: The pattern provides relatively clear entry points for trades anticipating a new move in the direction of the engulfing candle.
- Gauging Sentiment Shifts: It offers a direct visual representation of a rapid shift in the balance between buyers and sellers, a core principle of reading price action.
This approach is particularly valuable for traders who prefer clean charts and want signals generated directly from price movement itself, forming a key part of reactive price action trading strategies.
Examples of Successful Implementation:
- Bullish Reversal at Support: A stock index has been trending down for several days and approaches a well-established horizontal support level. A small red candle forms, indicating continued selling pressure but lacking conviction. The next candle opens lower but then rallies strongly throughout the session, closing near its high and forming a large green candle whose body completely engulfs the previous red candle’s body. Traders using this strategy might enter a long position near the close of the engulfing candle, anticipating a bounce from support.
- Bearish Reversal at Resistance: A currency pair rallies strongly towards a known resistance zone where sellers previously emerged. A small green candle forms, showing some buying interest remains. However, the subsequent candle opens higher but is aggressively sold off, forming a large red candle that engulfs the prior green candle’s body and closes near its low. This Bearish Engulfing signals seller dominance at resistance, prompting traders to consider short positions.
- Confirmation at Trend Line Touch: During an established uptrend, price pulls back to touch the ascending trend line. At the trend line, a small red candle forms, followed by a strong bullish engulfing pattern. This reinforces the validity of the trend line support and signals a likely resumption of the uptrend.
Actionable Tips for Traders:
- Wait for Candle Close: Never act on an engulfing pattern before the second candle has officially closed. What looks like an engulfing pattern mid-session might change drastically by the close.
- Context is Crucial: Only trade engulfing patterns that form at significant technical locations (Support/Resistance, Trendlines, Pivot Points, Fibonacci levels). Patterns appearing randomly in the middle of a range are often unreliable.
- Look for Volume Confirmation: Increased trading volume on the engulfing candle (especially compared to the first candle and recent average volume) adds significant weight to the signal, indicating strong participation in the reversal.
- Define Your Risk: Place your stop-loss order logically. For a bullish engulfing, the stop typically goes just below the low of the engulfing (second) candle. For a bearish engulfing, it goes just above the high of the engulfing candle.
- Consider Relative Size: An engulfing candle that is significantly larger than the preceding candles suggests a more forceful and potentially more reliable shift in sentiment.
- Seek Confirmation (Optional but Recommended): Especially in volatile or choppy markets, wait for the next candle after the engulfing pattern to confirm the direction before entering. For a bullish engulfing, look for the next candle to also close higher.
Pros:
- Strong Reversal Signal: Especially potent when occurring after a prolonged trend or at key technical levels.
- Easy to Identify: The visual nature of the pattern makes it relatively simple to spot on a chart.
- Clear Entry & Risk: Provides defined points for potential entry and stop-loss placement.
- Potential for Significant Moves: Successful engulfing patterns at major turning points can precede substantial price movements.
Cons:
- False Signals: Can occur frequently in choppy, sideways, or low-volatility markets where clear trends are absent.
- Requires Confirmation: Relying solely on the pattern without considering context or confirmation can lead to premature entries.
- Less Reliable in Isolation: Effectiveness increases dramatically when combined with other technical analysis tools (S/R levels, trend lines, volume).
- Diminished Reliability on Lower Timeframes: More prone to noise and false signals on very short timeframes (e.g., 1-minute, 5-minute charts).
Target Audience Fit:
- Novice Traders: Provides a clear, visual pattern to start understanding reversals and market sentiment shifts.
- Intermediate Traders: Helps refine entry timing at critical price junctures.
- Experienced Traders: Integrates seamlessly with broader market structure analysis, supply/demand zones, and confluence trading.
- All: As a fundamental candlestick pattern, understanding it benefits anyone analyzing price charts, making it a vital tool in the arsenal of price action trading strategies.
5. Breakout Trading Strategy
Breakout trading stands as a fundamental pillar within the diverse world of price action trading strategies. It operates on a simple yet powerful premise: identify key price barriers – levels of support or resistance, boundaries of chart patterns, or consolidation zones – and enter a trade when the price decisively moves through that barrier. The core idea is that such a “breakout” often signifies a shift in market sentiment and the potential start of a significant move in the direction of the break, frequently accompanied by increased momentum.
This strategy focuses purely on the interaction of price with these established levels, making it a true price action technique. Traders utilizing this approach watch for price to breach areas where it previously struggled to penetrate. These barriers can be horizontal support/resistance lines drawn on a chart, angled trend lines defining a prevailing trend, the edges of classic chart patterns like triangles, flags, wedges, or head and shoulders, or the upper and lower bounds of a tight price range (consolidation). A key element traders look for is confirmation, often in the form of increased trading volume and strong, decisive candlestick patterns during the breakout, suggesting conviction behind the move.
The following infographic illustrates the typical process flow involved in identifying and executing a breakout trade:
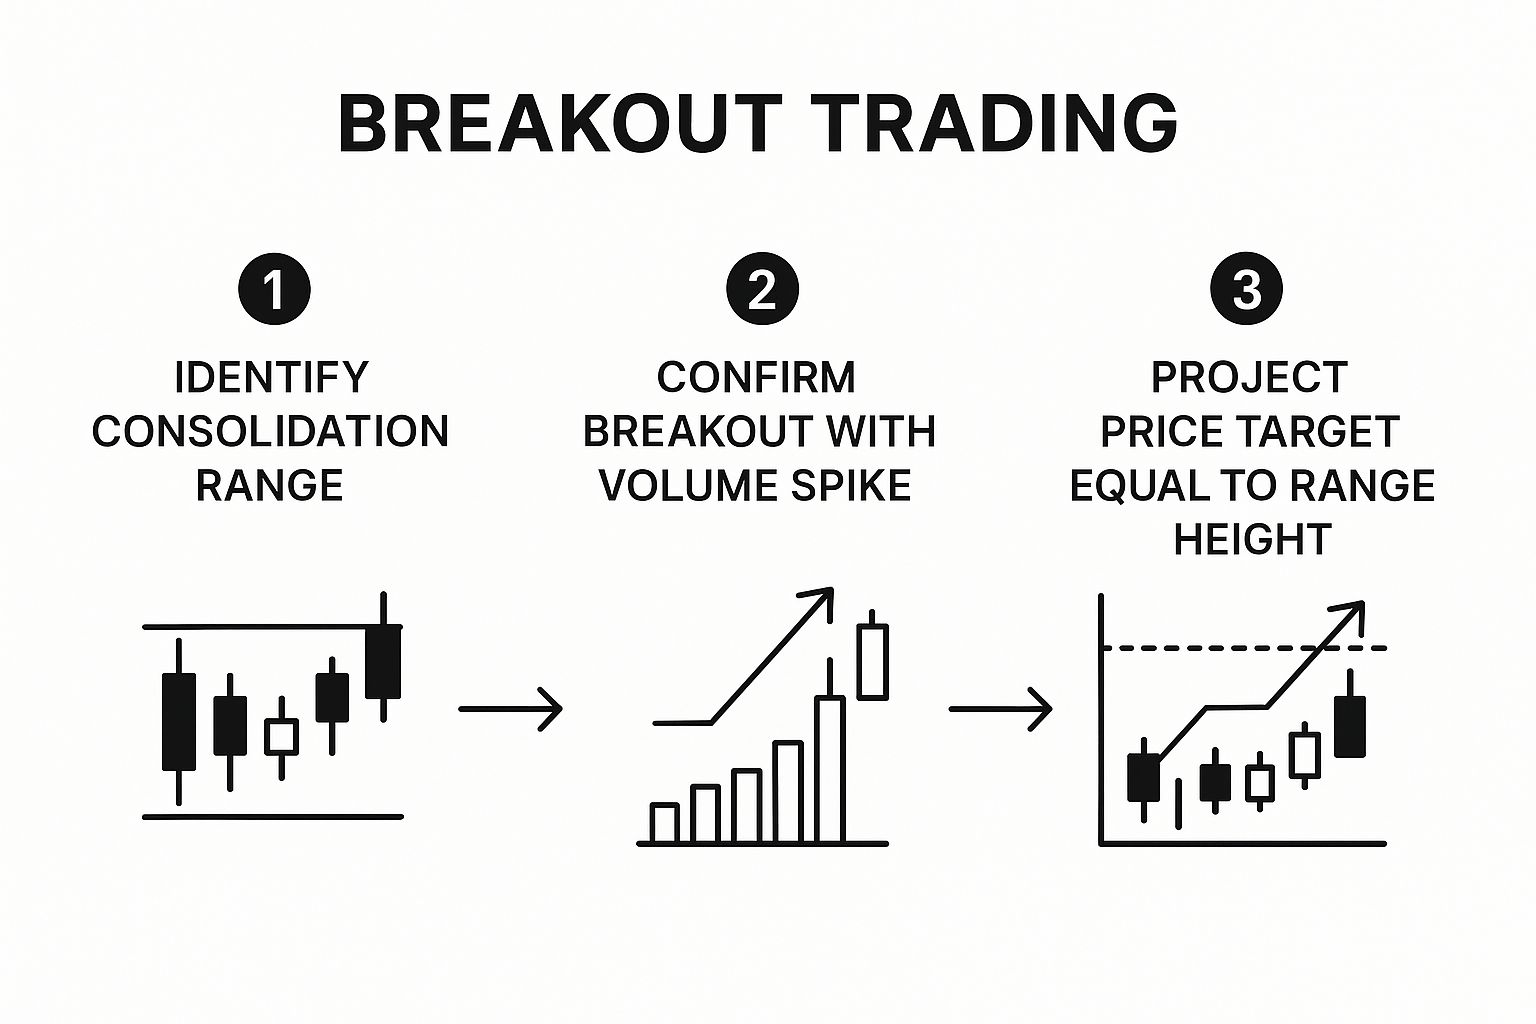
This visual representation highlights the sequential steps a trader often takes: from identifying a potential breakout level or pattern, monitoring the price action as it approaches, confirming the validity of the breakout (often considering volume), executing the entry, and managing the trade with appropriate stop-loss and take-profit levels. Following such a structured process is crucial for consistent application of the breakout strategy.
Why Use Breakout Trading?
Breakout trading deserves its place among essential price action trading strategies because it directly targets moments of potential market transition. It’s used to:
- Capture New Trends: Breakouts above resistance or below support can signal the beginning of a new uptrend or downtrend, respectively. Entering early allows traders to potentially ride a large portion of the move.
- Trade Trend Continuation: Within an existing trend, consolidation patterns (like flags or pennants) often form. A breakout from these patterns usually indicates the trend is resuming.
- Capitalize on Volatility: Breakouts are often associated with increased volatility, which, while risky, provides the potential for rapid profits. This is particularly common after periods of low volatility or during significant news events (e.g., earnings announcements causing a stock price to break out of a range).
Features and Benefits:
- Focus: Centers on price action relative to defined barriers (support, resistance, patterns).
- Versatility: Applicable across various markets (stocks, forex, futures, crypto) and timeframes (from intraday scalping to long-term position trading).
- Clarity: Provides relatively clear entry signals (the break of the level) and an immediate directional bias.
- Momentum Capture: Designed to enter trades just as momentum potentially accelerates.
Pros:
- Catches the beginning of potentially strong trends or momentum bursts.
- Offers well-defined entry points based on price structure.
- Can yield significant profits if the ensuing move is substantial.
- Adaptable methodology that can be combined with other technical indicators or analysis.
Cons:
- Highly susceptible to false breakouts (or “fakeouts”), where price breaks a level briefly only to reverse sharply. This is a primary challenge.
- Breakouts can be sudden and volatile, potentially leading to slippage (getting filled at a worse price than intended).
- Requires quick decision-making and execution once a breakout occurs.
- Determining the optimal placement for stop-loss orders can be tricky, often needing to be placed below the breakout level (for longs) or above it (for shorts), potentially resulting in wider stops.
Examples of Successful Implementation:
- Pattern Breakouts: Entering a long trade when the price breaks decisively above the upper trendline of a bullish flag pattern on high volume.
- Range Breakouts: Going short when the price breaks below the lower boundary of a multi-week consolidation range, especially following negative news for a stock.
- Level Breakouts: Buying when a stock price clears a significant long-term resistance level that has held prices down multiple times in the past, confirmed by a surge in buying volume.
Actionable Tips for Breakout Traders:
- Volume Confirmation: Always look for a noticeable increase in volume accompanying the breakout. This suggests institutional participation and conviction. Low-volume breakouts are more likely to fail.
- Wait for a Retest (Optional): For a more conservative entry, some traders wait for the price to break out and then pull back to “retest” the broken level from the opposite side. If the level holds (now as support after breaking resistance, or resistance after breaking support), they enter the trade. This reduces fakeouts but risks missing the initial move.
- Project Targets: Use the height of the preceding chart pattern or consolidation range to estimate a potential price target. For example, the target for a triangle breakout is often projected by adding the height of the triangle (at its widest point) to the breakout point.
- Context Matters: Be cautious of breakouts occurring just before major news events, during very low liquidity periods (like overnight sessions for some markets), or near major market opening/closing times, as these can be prone to erratic moves and false signals.
- Time Filters: Consider waiting for a candle to close beyond the breakout level on your trading timeframe, or even waiting a specific amount of time (e.g., 15-30 minutes on an hourly chart) after the initial break, to filter out immediate whipsaws.
Visual Learning:
For a visual demonstration of breakout trading concepts and examples, consider watching this video:
Popularized By:
While variations have existed for decades, notable traders and authors like Linda Bradford Raschke, Alexander Elder, and Nicolas Darvas (with his “Darvas Box” theory) have significantly contributed to the understanding and popularization of breakout trading methodologies within their broader trading frameworks.
In summary, the Breakout Trading Strategy is a vital component of price action trading strategies because it provides a systematic way to engage with the market at critical junctures where price momentum is potentially shifting. While it carries the inherent risk of false signals, mastering breakout identification and confirmation techniques can unlock opportunities for substantial gains across various market conditions.
6. Trend Line Trading Strategy
The Trend Line Trading Strategy is a foundational technique within the world of price action trading strategies. It involves the simple yet powerful practice of drawing lines on a price chart to connect key swing points, visually representing the prevailing trend and providing actionable trading insights. At its core, this strategy helps traders identify the direction of the market’s momentum and pinpoint potential areas where price might react.
What is the Trend Line Trading Strategy and How Does it Work?
This strategy operates on the principle, central to Dow Theory, that markets move in trends. Traders identify these trends by drawing lines that act as dynamic (sloping) support or resistance levels.
- Uptrend Lines: In a market making higher highs and higher lows (an uptrend), a trend line is drawn by connecting at least two significant higher lows. This line slopes upwards and acts as dynamic support. The expectation is that as price pulls back, it may find support near this line before resuming its upward trajectory
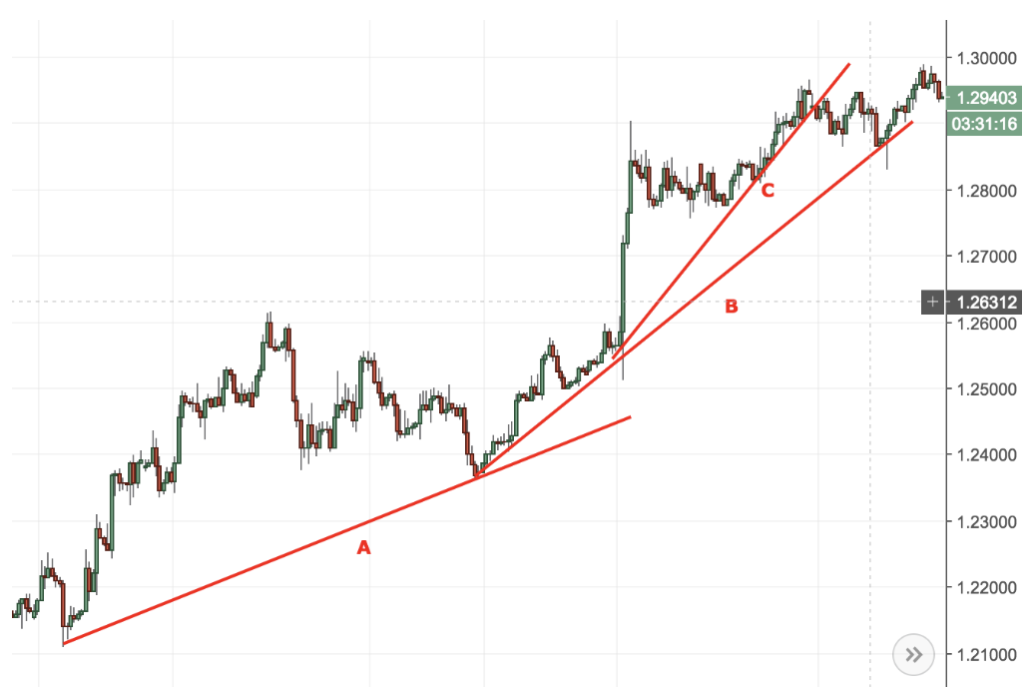 .
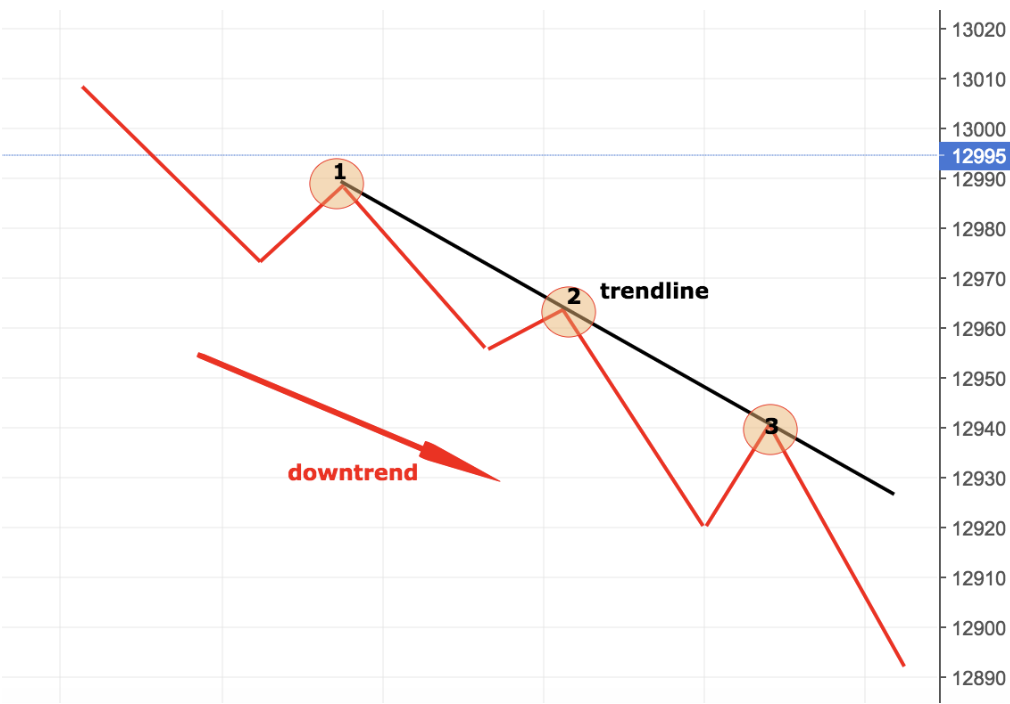
. - Downtrend Lines: Conversely, in a market making lower highs and lower lows (a downtrend), a trend line is drawn by connecting at least two significant lower highs. This line slopes downwards and acts as dynamic resistance. Traders anticipate that price rallies might stall near this line before continuing the downtrend.
These lines are not static; they extend into the future, providing potential reference points for upcoming price action. The angle or steepness of the trend line can also offer clues about the trend’s strength – steeper lines often indicate stronger momentum, though they can sometimes be less sustainable.
Why Use This Strategy?
The Trend Line Trading Strategy earns its place prominently in any discussion of price action trading strategies for several key reasons:
- Visual Clarity: It provides an immediate, visual representation of the trend’s direction and potential boundaries.
- Simplicity: The basic concept is easy to understand, making it accessible even for novice traders.
- Pure Price Action: It relies solely on price data (highs and lows) without lagging indicators, fitting the core philosophy of price action trading.
- Defined Risk Levels: Trend lines offer logical areas to place stop-losses (e.g., just beyond a broken trend line).
- Entry & Exit Signals: They provide objective (though somewhat subjective in drawing) points for potential trade entries (bounces) and exits (breaks).
- Versatility: Trend lines can be effectively drawn and utilized on any timeframe (from minutes to months) and across all tradable instruments (stocks, forex, commodities, crypto).
Features and Benefits:
- Dynamic Support/Resistance: Unlike horizontal levels, trend lines adapt to the trending nature of price.
- Trend Identification: Clearly delineates whether the market is generally moving up, down, or sideways.
- Momentum Gauge: The slope offers a visual cue to the intensity of the trend.
- Trade Setup Framework: Provides specific areas to look for buying opportunities (at uptrend lines) or selling opportunities (at downtrend lines or breaks).
Successful Implementation Examples:
- Classic Bounce Entry: A trader identifies a strong uptrend in a stock like NVDA. They draw an uptrend line connecting several higher lows. When the price pulls back to touch the trend line for the third time and forms a bullish engulfing candlestick pattern, the trader takes this as a high-probability long entry signal, placing a stop-loss slightly below the trend line.
- Trend Line Break for Reversal: The EUR/USD currency pair has been in a downtrend on the daily chart for weeks, with a clear downtrend line capping rallies. Suddenly, the price breaks decisively above this trend line with strong volume and closes above it. A price action trader might interpret this break as a potential shift in trend, exiting any short positions and potentially looking for long opportunities on subsequent pullbacks to the broken line (which may now act as support).
- Channel Trading: Sometimes, parallel trend lines can be drawn (one connecting lows, one connecting highs) to form a channel. Traders might buy near the lower trend line and sell near the upper trend line within a well-defined channel.
Actionable Tips for Effective Trend Line Trading:
- Use at Least Two, Ideally Three Touches: A line connecting two points is tentative. A third touch significantly increases the validity and reliability of the trend line.
- Avoid Forcing It: Don’t try to make a trend line fit the price action if it’s not obvious. In choppy or ranging markets, trend lines are less effective.
- Mind the Angle: Very steep trend lines are often broken more easily than those with a moderate slope (e.g., around 45 degrees).
- Look for Confluence: Combine trend line signals with other price action signals like horizontal support/resistance levels, candlestick patterns (pin bars, engulfing patterns), or Fibonacci retracements for higher probability setups.
- Multiple Timeframe Analysis: Draw trend lines on higher timeframes (e.g., daily, weekly) to understand the major trend, then use shorter timeframes (e.g., 1-hour, 4-hour) for more precise entry and exit timing.
- Logarithmic Scale for Long-Term: For very long-term charts spanning years or decades, using a logarithmic price scale can often result in more accurate and respected trend lines.
- Plan for Breaks: Understand that all trend lines are eventually broken. Have a plan for how you will react – will you exit, reverse your position, or wait for further confirmation?
Pros:
- Helps visualize the direction and strength of prevailing trends.
- Provides relatively objective areas for potential trade entries, exits, and stop-loss placement.
- Adaptable to changing market conditions (lines can be adjusted as new swing points form).
- Can be effectively combined with other technical indicators or price action patterns for confirmation.
Cons:
- Drawing trend lines can be subjective; different traders may draw slightly different lines on the same chart.
- Trend lines sometimes need to be redrawn as price action evolves, which can feel inconsistent.
- Difficult to apply reliably in choppy, sideways, or low-volatility markets.
- A break doesn’t always signal a reversal; it can sometimes be a “fakeout” before the trend resumes.
Popularized By:
The concept of trends is central to technical analysis, pioneered by Charles Dow. The practical application and charting of trend lines were significantly detailed and popularized by Robert Edwards and John Magee in their seminal work “Technical Analysis of Stock Trends.” Trend analysis is also a crucial component of Ralph Nelson Elliott’s Wave Theory.
In summary, the Trend Line Trading Strategy is a cornerstone of technical and price action trading strategies. Its ability to visually define trends and provide clear potential support and resistance levels makes it an invaluable tool for traders seeking to align themselves with market momentum and identify logical trading opportunities based purely on price movement.
7. Price Channel Strategy
The Price Channel strategy is a cornerstone technique within the realm of price action trading strategies, offering a visual and structured way to interpret market movements. It operates on the principle that price often oscillates between identifiable boundaries, forming a “channel.” This strategy involves drawing two parallel lines: an upper trendline connecting consecutive swing highs and a lower trendline connecting consecutive swing lows. The space between these lines is the price channel, representing a corridor where price action is contained, at least temporarily.
How it Works:
At its core, the Price Channel strategy helps traders visualize support and resistance levels that are dynamic rather than static horizontal lines.
- Channel Identification: A trader identifies at least two significant swing highs and two significant swing lows. Parallel lines are drawn connecting these points.
- Channel Type:
- Ascending Channel: Slopes upwards, indicating an uptrend. The lower line acts as dynamic support, and the upper line represents potential resistance or profit-taking zones.
- Descending Channel: Slopes downwards, indicating a downtrend. The upper line acts as dynamic resistance, and the lower line represents potential support or profit-taking zones.
- Horizontal Channel (Range): Lines are roughly horizontal, indicating a sideways or ranging market. The upper line is resistance, and the lower line is support.
- Trading Approaches:
- Trading Within the Channel (Mean Reversion): When price approaches the lower channel line (support), traders look for buying opportunities, anticipating a bounce back towards the upper line. Conversely, when price approaches the upper channel line (resistance), traders look for selling opportunities, expecting a pullback towards the lower line. This is particularly effective in horizontal channels.
- Trading Breakouts: A decisive close outside the established channel boundaries signals a potential shift in market dynamics. A breakout above the upper channel line can indicate the start or acceleration of an uptrend, presenting a buying opportunity. A breakdown below the lower channel line can signal the start or acceleration of a downtrend, presenting a selling opportunity.
Why Use This Strategy?
The Price Channel strategy deserves its place among essential price action trading strategies because it directly interprets raw price movement to frame the market. It provides clear visual boundaries, helping traders:
- Identify the Trend: The slope of the channel immediately indicates whether the market is trending up, down, or consolidating.
- Pinpoint Entry/Exit Zones: The channel lines offer logical areas to consider entering trades (near boundaries) and setting initial profit targets (opposite boundary).
- Define Risk: Stop losses can often be placed just outside the channel boundary opposite the entry point, providing a defined risk level based on the observed price structure.
- Adapt to Market Conditions: Unlike some strategies that only work in trends, channels can be effectively applied in both trending (diagonal channels) and ranging (horizontal channels) markets.
Key Features and Benefits:
- Visual Clarity: Provides an easy-to-understand visual map of current price action, support, and resistance.
- Versatility: Applicable across various markets (Forex, stocks, commodities, crypto) and timeframes (from minutes to weeks).
- Defined Risk/Reward: The channel structure inherently suggests potential profit targets (opposite boundary) and stop-loss placements (just beyond the entry boundary).
- Multiple Opportunities: Offers chances to trade bounces within the channel or significant breakouts, catering to different trading styles.
- Pure Price Action: Relies directly on identifying highs and lows, making it a fundamental price action technique without mandatory reliance on lagging indicators.
Examples of Successful Implementation:
- Ranging FX Pair: Consider EUR/USD stuck in a 100-pip horizontal range for several days. A trader identifies the upper and lower boundaries by connecting the highs and lows. They buy near the lower boundary with a stop loss below it, targeting the upper boundary, and sell near the upper boundary with a stop loss above it, targeting the lower boundary. Confirmation using candlestick patterns (like pin bars or engulfing patterns) at the boundaries strengthens these trades.
- Uptrending Stock: A stock like AAPL is forming higher highs and higher lows within an ascending channel on the daily chart. A trader waits for price to pull back to the lower channel line. Upon seeing a bullish candlestick pattern confirming support at the lower boundary, they enter a long position, placing a stop loss below the recent swing low (or the lower channel line) and targeting the upper channel line or potentially holding for a longer-term trend continuation.
- Channel Breakout: A commodity like Gold has been trading within a well-defined descending channel for weeks. Price then decisively breaks and closes above the upper channel line on strong volume. This breakout signals a potential trend reversal. A trader might enter long on the breakout or wait for a retest of the broken upper channel line (which may now act as support) before entering.
Actionable Tips for Readers:
- Wait for Confirmation: Don’t blindly trade every touch of a channel line. Require at least two distinct touches on each side to validate the channel initially. Look for confirming signals like candlestick patterns (hammers, shooting stars, engulfing patterns), divergence on oscillators (though this moves beyond pure price action), or increased volume on breakouts.
- Adjust Dynamically: Markets evolve. As new significant highs or lows form, be prepared to redraw or adjust your channel lines to reflect the most current price action accurately.
- Consider the Slope: The steepness of a trending channel can indicate the strength of the trend. A very steep channel might be unsustainable, while a shallow slope indicates a weaker trend.
- Use Channel Width: The distance between the upper and lower lines indicates volatility. You can use this width to set realistic profit targets (e.g., targeting the opposite boundary) or determine appropriate stop-loss distances.
- Context Matters: Always consider the broader market context. Is the channel part of a larger trend or counter-trend movement? This influences the probabilities of bounces versus breakouts.
- Patience Pays: Avoid forcing trades. Wait for price to clearly reach a channel boundary and provide a confirmation signal before entering. Don’t chase price mid-channel.
Pros:
- Provides clear visual boundaries for interpreting price movement.
- Offers multiple trading opportunities (reversals and breakouts) within one framework.
- Helps identify logical potential profit targets and stop-loss levels based on structure.
- Applicable across different market conditions (trending, ranging) and timeframes.
Cons:
- Drawing channel lines can be subjective and may require adjustments.
- Can lead to overtrading if every touch of a boundary is acted upon without confirmation.
- Less effective during choppy markets or periods where clear highs/lows aren’t forming consistently.
- Requires patience to wait for price to reach the optimal entry zones at the channel boundaries.
Popularized By:
While the concept of channels is fundamental, specific variations and related ideas were popularized by figures like Richard Donchian (Donchian Channels, which automatically plot highest high and lowest low over a set period) and are related to concepts developed by J. Welles Wilder Jr. Though structurally different (using standard deviations), John Bollinger’s Bollinger Bands also work on the concept of price oscillating within dynamic bands.
In summary, the Price Channel strategy is a powerful and versatile tool in a price action trader’s arsenal. Its strength lies in its simplicity, visual clarity, and adaptability, making it an excellent method for traders of all levels seeking to structure their analysis and identify high-probability trading opportunities based directly on market behavior.
7 Price Action Strategies Compared
| Strategy | Implementation Complexity 🔄 | Resource Requirements ⚡ | Expected Outcomes 📊 | Ideal Use Cases 💡 | Key Advantages ⭐ |
|---|---|---|---|---|---|
| Support and Resistance Trading | Low – simple horizontal levels | Low – uses historical price data | Moderate – clear entry/exit points | All markets and timeframes; range-bound areas | Simple, clear levels, adaptable, widely used |
| Pin Bar Pattern Trading | Moderate – pattern recognition | Low – single candlestick based | High – precise reversal signals | Trend reversals at key support/resistance | Clear pattern, precise entries, good RR ratio |
| Inside Bar Trading Strategy | Moderate – two-candle pattern | Low to moderate – candlestick data | High – breakout opportunities | Trending markets, consolidation breakouts | Clear trade levels, favorable risk-reward |
| Engulfing Candle Pattern | Moderate – two-candle pattern | Low – visual candle analysis | High – strong reversal potential | End of trends, key price levels | Strong reversal, clear signal, good clarity |
| Breakout Trading Strategy | High – requires confirmation | Moderate – volume and price action | High – catch new trends or momentum | Breakouts from consolidations, chart patterns | Captures strong moves, clear entries |
| Trend Line Trading Strategy | Moderate – drawing and validation | Low – price pivot data | Moderate – trend direction and reversals | Trending markets, trend continuity or reversals | Visualizes trend, flexible, combined well |
| Price Channel Strategy | Moderate – draw parallel lines | Low – price high/low data | Moderate – range trading and breakouts | Ranging and trending markets, volatility zones | Clear boundaries, multiple trade setups |
Mastering Price Action: Your Next Steps
You’ve now explored a powerful toolkit of price action trading strategies, from identifying key support and resistance levels and trend lines to recognizing potent candlestick patterns like Pin Bars, Inside Bars, and Engulfing patterns, as well as capitalizing on breakouts and channels. The common thread weaving through all these techniques is their focus on interpreting the raw movement of price itself – understanding what the market is actually doing, rather than relying solely on lagging indicators.
However, understanding these price action trading strategies is just the beginning. The most crucial takeaway is that true mastery and consistent profitability stem from dedicated practice, disciplined execution according to your trading plan, and rigorous risk management on every single trade. Mastering price action equips you with a versatile and adaptable skillset, allowing you to analyze any market in any timeframe with greater clarity and confidence. It forms the bedrock of making informed trading decisions directly based on market behavior, which can significantly impact your trading consistency and potentially lead towards goals like location-independent income.
Your next steps should involve immersing yourself further. Start by identifying these patterns and levels on historical charts (backtesting). Then, practice applying these strategies in a demo account to build confidence without risking real capital. Continuously refine your understanding of market context and your chosen price action trading strategies.
Remember, the journey to mastering price action requires patience and persistence, but the rewards – clarity, confidence, and a deeper understanding of market dynamics – are well worth the effort. Keep learning, stay disciplined, and watch your trading evolve.
If you’re seeking a structured path to accelerate your learning and apply these concepts effectively with expert guidance, consider exploring Colibri Trader. Their practical, mentorship-driven programs specialize in the indicator-free price action trading strategies discussed, helping traders build confidence and achieve tangible results. Take the next step in your trading journey by visiting Colibri Trader.
Join a community of Price Action traders and master a little-known trading strategy — one you can pick up in less than a weekend, even if you’re starting with zero experience.