


Conquer the Market: The Quick 200 Day Moving Average Trading Guide (Simple Strategies, Powerful Results)
Among the vast universe of technical indicators, the 200-day moving average stands virtually peerless in its ability to illuminate primary market trends across any timeframe or asset class.
Billionaire virtuosos like Warren Buffett view the 200 DMA’s signals as gospel guiding every trade decision. In markets driven by human emotions oscillating between fear and greed, this indicator distills objectivity from subjectivity.
This quick guide aspires to elucidate exactly how extraordinary traders transform the 200 DMA from theory into a practical strategic framework for consistent profits. Consider it your roadmap for accessing the secrets of market wizards.
Within these pages, both seasoned trading warriors and eager new apprentices will discover powerful wisdom to thrive in the world’s toughest trading arenas. We will journey together into the beating heart of this legendary indicator, emerging enlightened by abilities you may have considered supernatural until now.
The mystifying market chaos that causes so many traders to repeatedly grasp defeat from the jaws of victory will crystallize into simple logical order. You will gain the life-changing power to determine whether prices at any moment are driven by unstoppable fundamental forces or are merely lost and meandering randomly like leaves in the wind.
This sacred knowledge, closely held by market titans and selective institutions, will expand trading from gambling into a masterful art form for you. Each chart will illuminate realities behind price, arming you to trade intelligently alongside whales in harmony instead of being trampled unconsciously beneath the waves they generate.
So prepare yourself. A truly life-changing adventure awaits that could radically transform your trading skills forever. The secrets of legendary traders are about to be unveiled.
Demystifying the Genius of the 200 Day Moving Average
The 200 DMA stands out among indicators for its elegant simplicity, yet immense strategic power. Before harnessing its signals, let’s illuminate what gives this tool its legendary status.
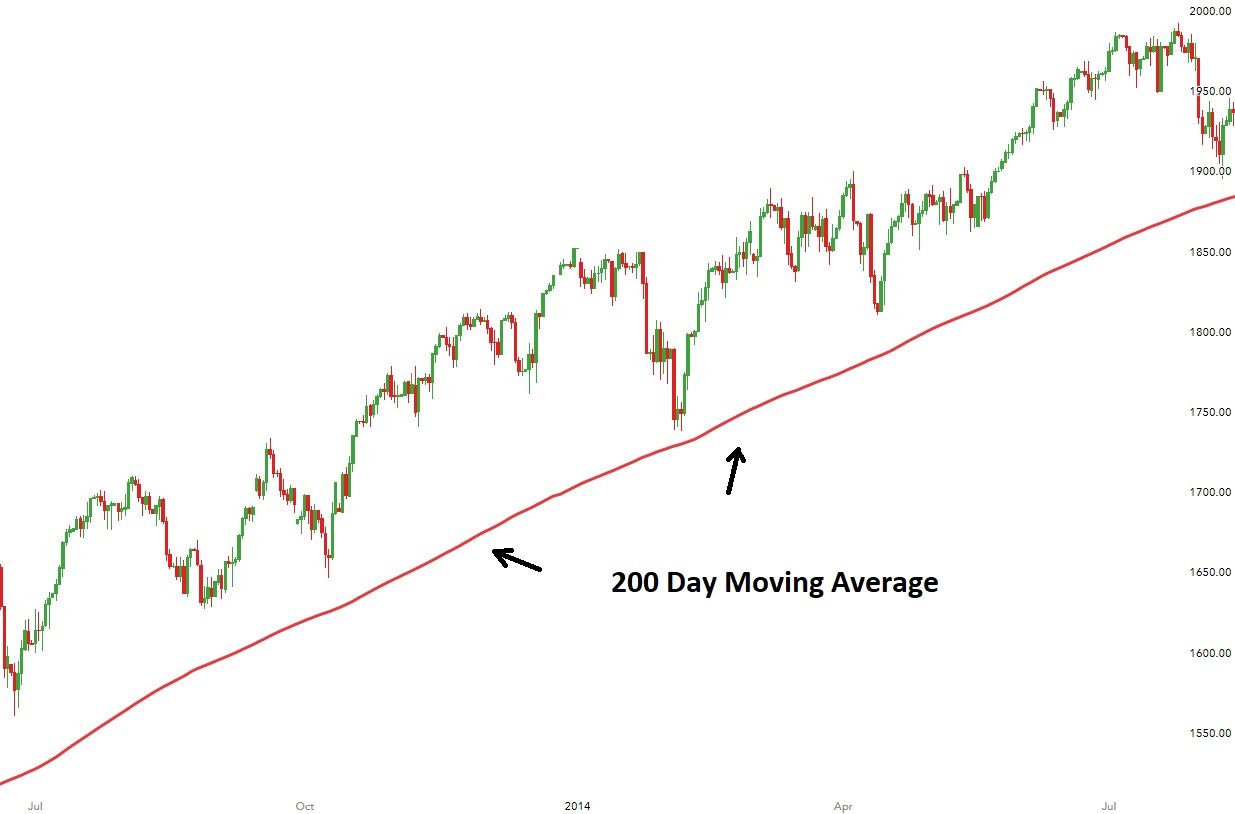
In basic terms, the 200 DMA plots the arithmetic average closing price over the prior 200 trading days as a flowing trendline. By smoothing day-to-day noise, it reveals the hidden undercurrents driving price action.
But why specifically 200 days? This timeframe strikes an ideal balance between adaptability and stability. Capturing 200 days of market activity allows the indicator to respond to new trends faster than say the 500 DMA. Yet stepping back to a wider lens than the raw price chart smooths out daily volatility and whipsaws.
This combination enables the 200 DMA to highlight the primary market regime, without getting distracted by temporary pullbacks or spikes within the greater trend. Traders can focus on the strategic forest rather than getting lost in fleeting trees.
Lagging Indicator?
Now a key nuance is that the 200 DMA is considered a “lagging indicator” since it relies on past price action. This means it won’t magically predict exact tops and bottoms in advance.
However, according to masters like William O’Neil, this lagging nature is precisely what makes the 200 DMA so useful for CONFIRMING new trends rather than just speculating. It prevents traders from getting faked out and whipsawed by temporary retracements before the new regime solidifies.
Once price breaks out decisively above or below the 200 DMA baseline and the indicator starts clearly curling in an ascent or descent, it provides rock-solid evidence that a new primary trend has taken hold. Traders can enter confidently at opportune moments with confirmation in hand.
In essence, the 200 DMA elegantly filters out market noise to bring the true underlying trends into focus. This makes it indispensable for objectively assessing when supply and demand dynamics have genuinely shifted across any market. Now let’s explore how to transform these insights into profits!
Whether surging rallies or plunging collapses, the 200 DMA provides an invaluable x-ray into prevailing market psychology once new trends emerge. Now let’s explore battle-tested ways to transform these signals into victory.
Three Devastating 200 DMA Trading Strategies
Here are three ruthlessly effective yet simple trading strategies to harness the awesome might of the 200 DMA:
The Unrivaled 200 DMA Trend Following System
The most straightforward approach utilizes the 200 DMA to identify the dominant trend, then aligns your forces decisively.
This translates into:
- Enter long positions when price rallies decisively ABOVE the 200 DMA – the uptrend has commenced!
- Exit longs when price crosses BACK BELOW the 200 DMA – sound the retreat!
- Enter short positions when price falls decisively BELOW the 200 DMA – the downtrend has commenced!
- Close shorts when price crosses BACK ABOVE the 200 DMA – time to surrender!
- Rather than attempting to prematurely call tops and bottoms, this system allows you to enter trades at opportune moments AFTER trends reveal themselves. Having the discipline to act on these signals separates victory from defeat.
Adding confirming indicators like the 50 DMA bolsters confidence before advancing. But the 200 DMA provides the ultimate compass pointing to triumph or ruin. Follow it with conviction.
The principles behind this robust trend following approach apply universally across any market battlefield. Rigorously backtest for precision, then deploy live with absolute confidence.
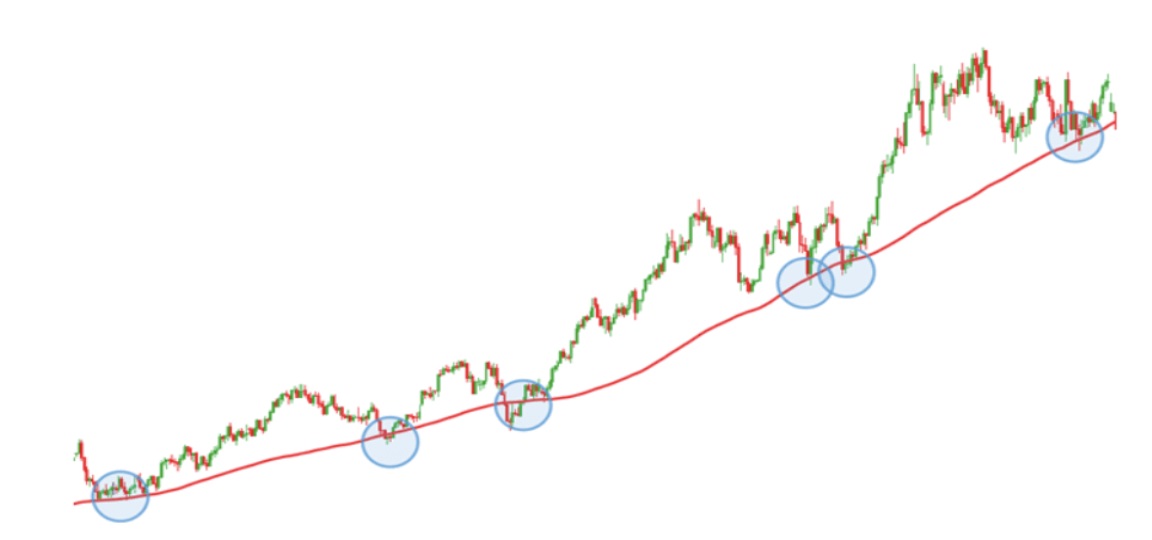
The 200 DMA Support and Resistance Assault
In addition to its role as the supreme arbiter of trend direction, the 200 DMA often acts as pivotal support during uptrends and resistance during downtrends. This creates opportunities for tactical strikes.
Some key maneuvers include:
- Enter long positions when price bounces forcefully off 200 DMA support – then ride the rebound!
- Place stop losses strategically below support to minimize downside ambush risk
- Take profits near potential overhead resistance zones
- Enter short positions when price stalls and reverses at 200 DMA resistance
- Place stop losses above resistance to quickly bail out if it breaks
When price ricochets sharply off the 200 DMA, it signals the market perceives this zone as critical. Whether support holds or breaks provides clues into who holds the upper hand.
This battle-tested tactic works universally across timeframes and asset classes. Commit it to instinct and be ready to strike on contact with the 200 DMA!
Crossover Signals for Trading Mastery
In addition to trend and support/resistance, crossover events can indicate momentum shifts and mark turning points. These rare yet decisive moments deserve utmost attention.
Bullish Crossovers
When price penetrates ABOVE the 200 DMA from below, a roaring rally may commence. This signifies bulls have regained enough power to conquer the 200 DMA. The uptrend has resumed with force!
Bearish Crossovers
When price penetrates BELOW the 200 DMA from above, the bears may have regained control, foreshadowing a sustained downtrend. This crossover can mark the critical point where supply overwhelms demand.
Now let’s see some profitable historical examples:
Crossovers must be confirmed using other indicators to avoid false signals. But understanding these potential inflection points provides an invaluable edge.
Elevate Your Trading to an Art Form
The wise trader evolves their craft continuously by:
- Adding additional indicators to validate high-probability setups
- Implementing disciplined risk management and position sizing
- Engaging only battles with decisively favorable odds
- Accounting for portfolio correlations
- Mastering psychology to prevent emotions from overriding strategy
- Markets adapt, so our tactics must constantly improve while remaining grounded in core principles. Master the fundamentals, then craft your own evolving methodology.
Forging Your Path to Trading Mastery
This guide has armed you with the foundational blueprint to harness the phenomenal power of the 200 DMA in any market arena. But truly mastering this or any indicator requires extensive practice and experience.
While the 200 DMA has undoubtedly earned its place among the most valuable tools through decades of proven performance, no single technique rings the victory bell in every market environment. Winners maintain flexibility, studying price action in real-time and adapting tactics to evolving conditions.
Take these lessons as your launch pad, then forge your own path to mastery through trial, error and persistence. Deploy the 200 DMA across diverse market arenas – stocks, futures, forex, cryptocurrencies. Refine your battle strategies by combining it with other indicators and analyzing how it performs in various contexts.

Stay nimble, as markets continuously change. But also persist through frustrations that are inevitable. Managing psychology is integral, as emotion can derail rules-based processes. Cultivate the discipline and mental toughness required to stick with your edge despite setbacks.
True trading expertise isn’t handed out on a silver platter – it’s honed through long hours battling in the trenches. But the wisdom provided lights your way forward. Master these fundamentals, then craft your own evolving style.
Your journey awaits. Advance with courage! Use each challenge as a lesson to incrementally elevate your game. Trading legends are not born – they are self-made through relentless drive. You now have in your hands the tools used by titans of the arena.
So watch in awe as the market unveils its glory! And remember, the only limits on your potential are those you impose yourself. With the power of the 200 DMA as your ally, ascend to whatever heights you dare to dream!
Please share your experiences using the 200 DMA below. Let’s progress together on this path to trading mastery! To victory!