




How to Trade in a Bear Market: Actionable Price-Action Guide

You're watching the market fall, seeing sharp rebounds that look like recoveries, and wondering whether the next move is to short the bounce or buy the dip. Both decisions can be expensive when they're based on fear, impatience, or the assumption that a large decline has already created a bottom.
Learning how to trade in a bear market starts with a less exciting question: when should you stay out? A falling market can reward carefully timed short trades, but it can also punish late entries, oversized positions, and traders who confuse a countertrend rally with a reversal. The practical edge comes from reading structure, defining invalidation before entry, and preserving enough capital to trade the next setup.
Why Bear Market Trading Requires a Different Mindset
A sharp selloff can make two trades look tempting: short the first rebound or buy because the market already feels damaged. Both can fail. From February 19 to March 23, 2020, the S&P 500 fell 34% in just over one month, then gained 74% during the following 12 months, according to historical market analysis from BNY. Selling after the collapse may reduce immediate exposure, but it can also close a position before a powerful rebound. Buying the first bounce carries the opposite risk, since a fast rally does not establish a new primary trend.
Bear-market trading is therefore a timing problem, not a contest to predict the bottom. Price can reverse violently, and entering early can cost as much as entering late. During the 2000 to 2002 technology bust, the S&P 500 lost more than 47%. During the 2007 to 2009 global financial crisis, it declined more than 55% over 17 months, according to Merrill's market chartbook.

Declines change the value of patience
A bear market is commonly defined as a decline of at least 20% from a previous market peak, but that threshold does not identify the eventual low. Since 1950, the S&P 500 has experienced 11 cyclical bear markets, with an average peak-to-trough decline of 34.6%, according to Merrill research. A falling index can remain weak after the headline threshold has been reached, so the percentage decline should describe the environment, not dictate the trade.
Recovery asymmetry should influence exposure. A long position needs a rebound large enough to offset the loss already incurred, while a short position can lose quickly when a countertrend rally accelerates. That trade-off argues for smaller initial positions, wider attention to invalidation, and patience when the next setup offers poor reward relative to risk.
Practical rule: A large decline describes what has happened. It does not confirm that sellers are finished.
Do not short an extended selloff because the chart looks weak. Wait for a rally that fails near resistance, then define the level that would invalidate the short thesis before entering. Do not buy only because price is lower than it was recently. A reclaim of a broken level, a higher low, or sustained buying pressure provides more useful evidence than a cheaper quote.
The 2020 episode illustrates why rules outperform prediction. Selling can lock in losses before a powerful rebound, while buying a falling market can expose the account to another leg lower. The practical goal is to identify the setup, state the invalidation point, and stay out when neither side offers a clear edge.
Recognizing a Confirmed Downtrend
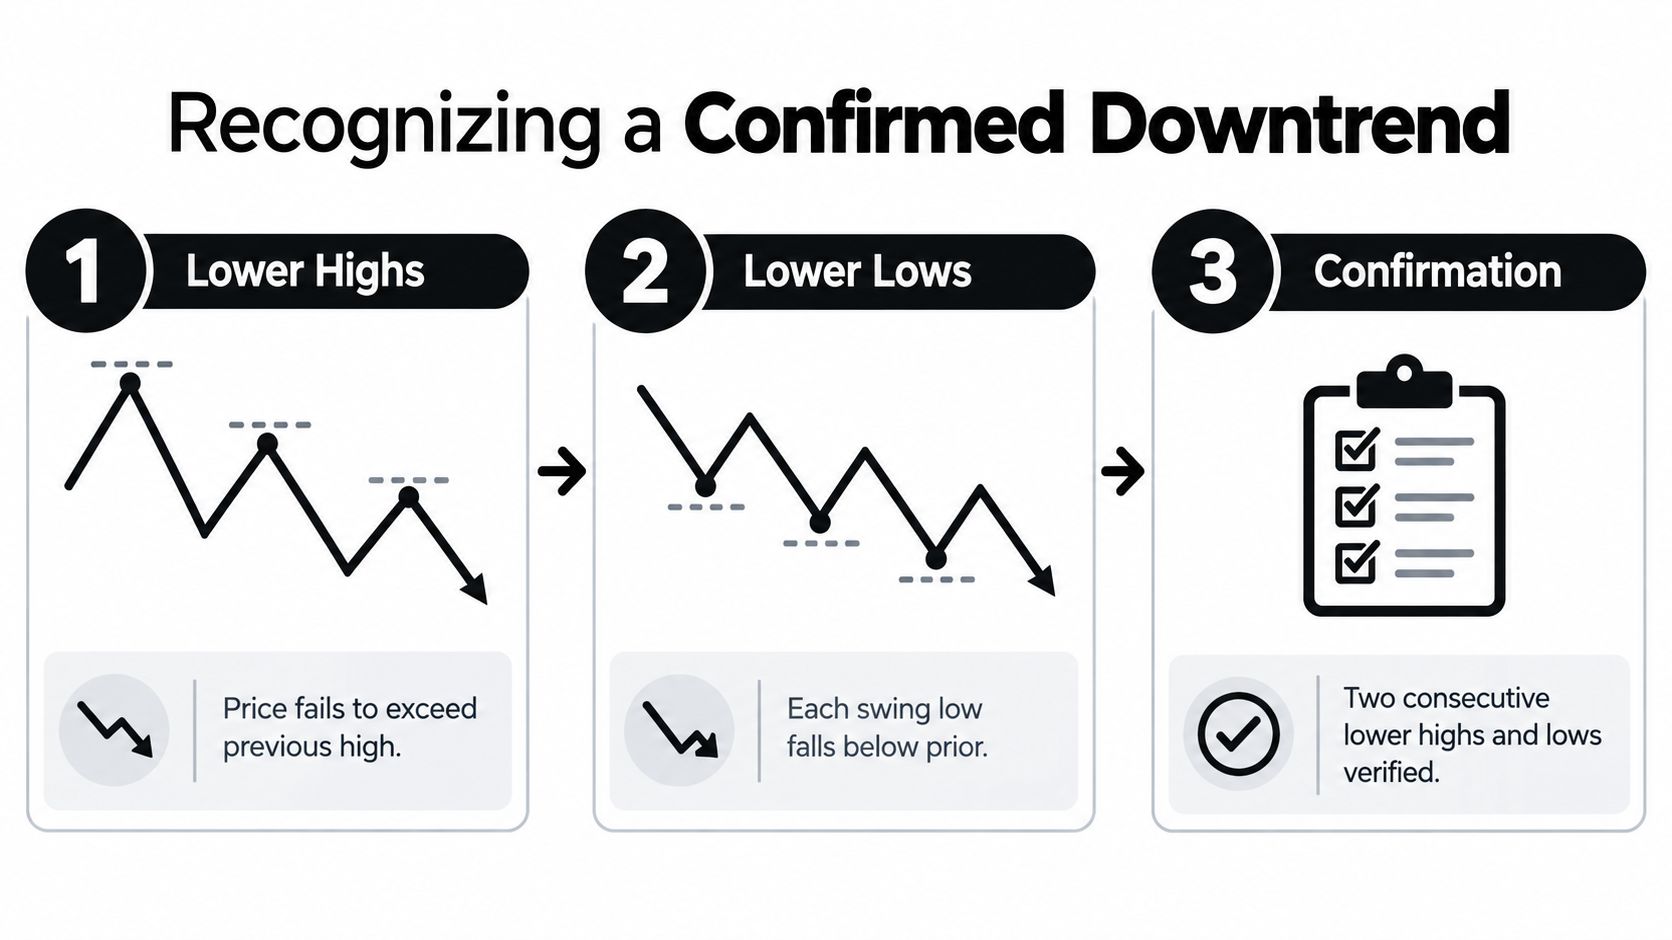
A confirmed downtrend isn't defined by one red candle or a dramatic headline. It appears through market structure, specifically a repeating sequence of lower highs and lower lows. This sequence tells you that buyers can't push price back above the prior swing high and that sellers are still able to force price below earlier support.
Read the sequence, not the emotion
Start at a visible swing high and mark the next meaningful rally peak. If that rally stops below the previous peak, you have a lower high. Then identify the next selloff low. If price breaks beneath the prior swing low, you have a lower low. One pair can be noise, so wait for the structure to develop rather than treating the first failed bounce as proof.
A practical confirmation process looks like this:
- Mark the reference high and low. Use clear swing points rather than every minor fluctuation.
- Measure the next rally. A rally that fails beneath the previous high keeps the bearish structure intact.
- Watch the next decline. A break beneath the prior low confirms that sellers remain in control.
- Wait for another reaction. A second lower high and lower low provide stronger evidence than a single downward impulse.
This process also tells you when not to short. If price is trapped between established support and resistance, shorting near support gives sellers little room before the trade reaches an obvious reaction area. If price has already fallen sharply and begins forming equal lows while reclaiming prior intraday resistance, the risk of a squeeze increases. Standing aside is a valid trade decision.
A countertrend rally can look impressive while remaining structurally bearish. The key question is whether buyers can create a higher high and defend a higher low, not whether the candles are large or the news feels optimistic. A durable reversal requires a change in structure. Until that happens, a rally into prior supply may be a short candidate, but chasing the initial decline usually creates poor location.
For readers who want a broader way to assess market damage before studying individual setups, the CoinHub.pro drawdown framework offers useful context around identifying bear-market conditions. Use that context as a filter, not as a substitute for the price structure on the chart you plan to trade.
Three conditions require different decisions
A persistent downtrend can support short trades when rallies fail at supply and the invalidation level is close enough to control risk. A volatile range calls for patience, because selling into support or buying directly beneath resistance often produces poor reward-to-risk. A capitulation phase demands even more caution, since sharp rebounds can begin before the final low looks obvious.
A downtrend gives you permission to look for shorts. It doesn't give you permission to short every candle.
Supply Zone Entries and Short Setups
The cleanest short entries usually occur when price rallies into a supply zone, an area where sellers previously overwhelmed buyers. The zone might form around a failed breakout, a prior breakdown level, or a consolidation that preceded a strong downward move. The location matters because it lets you define the trade before entering.
Don't sell just because price touches the zone. Wait for a trigger that shows buyers are failing. Useful triggers include a bearish rejection candle, a failed breakout above the zone, or a reclaim of a level that quickly loses support. The entry belongs after the market demonstrates rejection, not while you're guessing that rejection will occur.
Match the setup to the market phase
In a persistent downtrend, look for a rally that forms a lower high inside or below a previous supply area. A bearish candle that closes back beneath the zone can provide the trigger. The stop belongs beyond the level that would invalidate the rejection, usually above the supply boundary or the swing high that created the setup. If price closes and holds above that point, the short thesis is wrong.
In a volatile range, the same setup may be unreliable. A short near the middle of the range has no clear edge, while a short near support leaves limited room for the trade to work. Wait for price to reach the upper boundary and reject it, or wait for a confirmed breakdown followed by a failed reclaim. If neither condition appears, cash is preferable to forcing a position.
Capitulation is where many short sellers give back gains. A market can continue lower, but once selling becomes crowded, a sharp reclaim can run through poorly placed stops. If price makes a new low and immediately recovers a broken level, don't assume that the failed breakdown is a gift. Treat it as a warning that downside momentum may be exhausted.
For digital-asset traders, macro context can help prevent isolated chart reading. A resource on macro signals for Bitcoin buyers can complement price-action analysis, but the entry still needs a visible trigger and a defined invalidation level.
Build the trade around invalidation
Before entering, write down:
- Entry trigger: What price action proves sellers are responding?
- Invalidation: Which level must hold for the bearish thesis to remain valid?
- First exit: Where will you reduce exposure if price reaches nearby demand?
- Final exit: What evidence will make you close the remainder?
- No-trade condition: What would make the reward-to-risk unattractive?
A practical short can involve scaling out at demand rather than waiting for an ideal collapse. If the first target is reached, reduce risk and move the remaining position only according to a rule established in advance. Moving the stop farther away because the trade is losing isn't trade management. It's a decision to accept more risk after the market has already disagreed with you.
If you want to study supply-and-demand execution in a structured environment, Colibri Trader's premium and discount resources provide one educational path focused on price-action concepts.
The video can be useful as a visual supplement, but no presentation replaces the chart work. Mark the zone, identify the failed move, define the stop, and calculate the size before you send the order.
Position Sizing and Stop Placement
Position sizing begins with the amount you can lose, not the amount you hope to make. The basic calculation is:
Position size = permitted account risk ÷ risk per unit
Risk per unit is the distance between entry and stop multiplied by the value of each point, pip, share, or contract. As the stop becomes wider, the position must become smaller if account risk remains unchanged.
The requested examples use a 2% account-risk assumption, but that figure should be treated as an illustration rather than a universal rule. A trader with a strict daily loss limit may choose a smaller amount, especially when several trades are correlated or volatility is expanding.
Position Sizing by Stop Distance
| Stop Distance | Account Risk 2% | Position Size (Example) | Daily Loss Limit |
|---|---|---|---|
| 50 pips | 2% of account equity | Account risk divided by the cash value of 50 pips | Must remain below the trader's predefined daily cap |
| 200 pips | 2% of account equity | Account risk divided by the cash value of 200 pips | Must remain below the trader's predefined daily cap |
The table shows the important relationship. A stop four times wider doesn't justify keeping the same position size. If you do, the potential loss also expands fourfold. The correct response is to reduce the units, choose a better entry, or reject the setup.
For example, suppose a trader defines account risk as 2% and identifies one setup with a 50-pip stop. The position is sized so that the full stop loss equals the permitted account risk. A second setup has a 200-pip stop. The trader must divide the same permitted risk across a much larger distance, producing a materially smaller position.
This is why stops shouldn't be selected after the size. First place the stop beyond the structural invalidation point. Then calculate the position. If the resulting size is too small to justify the trade, that isn't a reason to move the stop closer. It's evidence that the opportunity may not suit the account.
A trader should also account for spread, slippage, borrow charges on shorts, and contract specifications. The SEC warns that short-term trading, margin, and options can create significant and unexpected losses for retail investors, as described in its investor bulletin on short-term trading risks.
Volatility measures such as average true range can help you avoid placing a stop inside ordinary market movement. They shouldn't dictate the stop mechanically. Structure comes first, volatility provides context, and position size absorbs the difference.
For a more detailed treatment of the calculation and its practical application, review Colibri Trader's position-sizing guide. The discipline is simple to state and difficult to maintain: widen the stop only when the chart requires it, then reduce the position so the account risk stays controlled.
Risk Management Rules That Preserve Capital
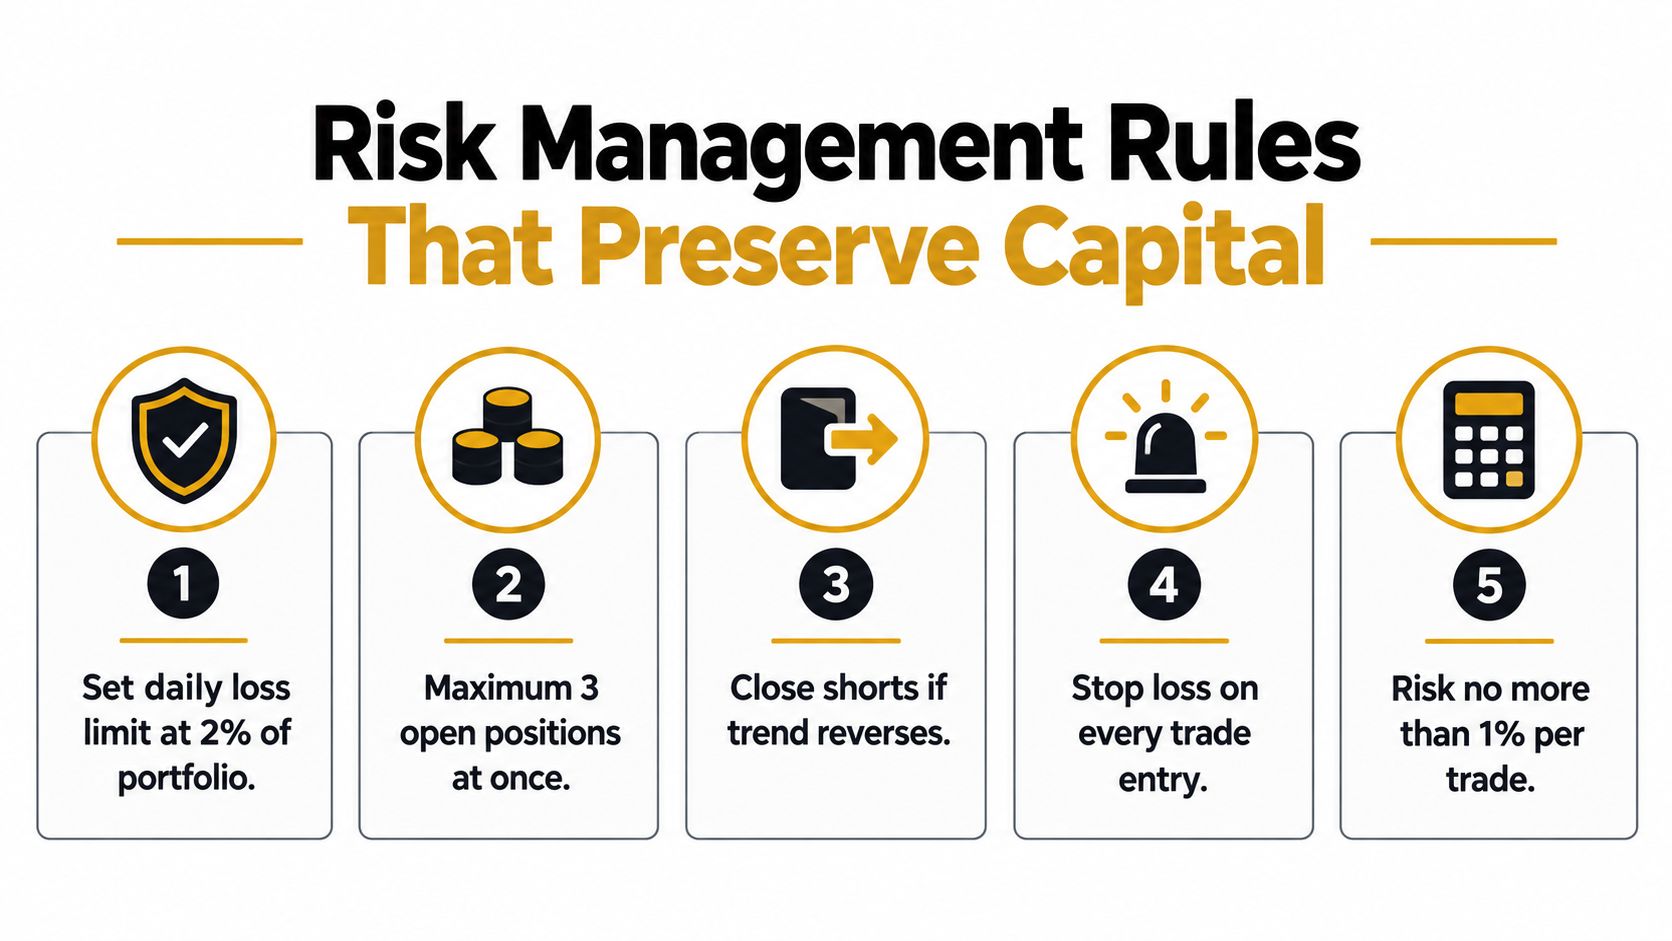
A short trade is wrong when the price action removes the reason for entry. That can mean a supply zone is reclaimed, a lower high turns into a higher high, or a failed breakdown becomes sustained support. Define that failure before entering, then exit when it occurs. Waiting for the market to rescue a position turns a manageable loss into an open-ended decision.
Capital preservation also protects future opportunities. A trader who kept losses controlled during the 2020 selloff could participate in the rebound without having to predict its timing. The point is not to call the low. It is to remain solvent and psychologically steady when conditions change.
Treat the rules as circuit breakers
Set a daily loss limit before the session begins. Once that limit is reached, stop trading. A string of frustrated entries can turn one poor idea into a damaging session, especially after a sharp squeeze or failed breakdown.
Keep total exposure small enough that correlated positions do not act like one oversized trade. Three shorts in closely related assets may express one macro view rather than three independent opportunities. Reduce the combined risk when the same catalyst could move all of them against you.
Every position needs a stop, and every stop needs a structural reason. Place it beyond the price action that invalidates the setup, then calculate the position size from the permitted loss. A stop placed arbitrarily close may improve the apparent reward-to-risk ratio while making a normal fluctuation fatal.
Do not average into a losing short just because the entry now looks attractive. During a squeeze, a market can reclaim supply and continue higher far longer than expected. Adding changes the original risk calculation and often delays the decision to exit.
Exit test: If you cannot explain exactly what price action proves your bearish thesis wrong, you are not ready to enter.
Diversification can spread risk across and within asset categories, according to the U.S. Securities and Exchange Commission's investor guidance. For an active trader, that means avoiding dependence on one instrument, sector, or directional assumption. It does not mean opening several random positions that all respond to the same market shock.
The practical rule is simple: decide the invalidation point before the order, cap the loss for the day, and preserve enough capital to trade the next valid setup. A bear market rewards selectivity more reliably than constant short exposure.
Complete Trade Plan Template
A bear-market plan should fit on one page and answer the questions that become difficult under pressure. Record the broader market structure, the instrument's current phase, the supply zone, the trigger, the invalidation level, the position size, and the exit conditions before placing an order. A structured trading-plan template from Colibri Trader can help organize those decisions.
Use this compact version:
- Context: Is the market making lower highs and lower lows, moving through a range, or showing signs of capitulation?
- Location: Where is the nearest meaningful supply zone, and where is demand likely to interrupt the move?
- Trigger: Did price reject supply, fail a breakout, or break down and fail to reclaim the level?
- Invalidation: Which exact price action closes the trade?
- Size: What quantity keeps the planned loss within the account and daily limits?
- Management: Where will you reduce exposure, trail a winner, or exit the remainder?
- No-trade rule: What condition makes the setup too late, too crowded, or too close to support?
In an early downtrend, prioritize continuation setups and avoid chasing the first selloff. During mid-trend consolidation, wait for a clean range failure or a rejection at the upper boundary. In late-stage capitulation, reduce exposure further and demand stronger confirmation, because reversal risk is heightened.
For a long position held as an investment rather than a short-term trade, the plan should also state when the position will be reduced or exited if the original thesis changes. A lower price alone isn't an exit signal, but a broken premise is.
Colibri Trader offers price-action education built around supply and demand, failed breakouts, bearish patterns, trade planning, and money management. If you want a structured way to practise the decisions covered here, visit Colibri Trader and explore its trading courses and resources before risking capital in a live bear-market setup.