




Premium and Discount Zones in Price Action

The most popular advice about premium and discount is also the least useful for a price action trader: buy the discount and sell the premium. That rule sounds precise, but it tells you nothing about whether price is balanced, trending, breaking down, or sitting on top of trapped liquidity. A market can remain “cheap” while sellers keep pressing lower, just as it can stay “expensive” while buyers continue accepting higher prices.
On a naked chart, premium and discount aren't measures of intrinsic value. They're locations inside a defined dealing range. The practical question is simpler: where is price relative to the range equilibrium, and what is price doing when it gets there? That shift removes much of the confusion created by lagging indicators and forces you to read structure, displacement, rejection, and follow-through.
Redefining Premium and Discount for Price Action
Traditional finance defines premium and discount against an underlying reference. A closed-end fund trades at a premium when its share price exceeds net asset value, or NAV, and at a discount when price falls below NAV. Historical research describes a cycle in which the average closed-end fund starts near a 10% premium to NAV and moves toward roughly a 10% discount within 120 days, an approximate 20-percentage-point change relative to NAV, as reported in this historical analysis of closed-end fund pricing.
That framework helps investors assess redemption mechanisms, liquidity, sentiment, and portfolio value. It gives a price action trader no entry trigger. A currency pair does not need to sit above or below an accounting estimate before a pullback reaches a tradable location.
Equilibrium is a chart reference
Choose one clear swing, from low to high in a bullish leg or from high to low in a bearish leg. Its midpoint separates the dealing range into three practical references:
- Discount array: the lower half of the range, where long setups gain interest when demand and bullish structure support them.
- Premium array: the upper half, where short setups gain interest when supply and bearish structure support them.
- Equilibrium: the 50% midpoint, where price is broadly balanced within the selected swing.
Unlike NAV, chart equilibrium is not a valuation estimate. It is the midpoint of a chosen swing, showing whether price is relatively cheap or expensive within that structure.
The midpoint is not a reversal signal. It measures location. A bullish setup in premium starts with a structural disadvantage because price has already crossed the cheaper half of the leg. A bearish setup in discount faces the reverse problem. The location only becomes actionable when price shows rejection, displacement, or acceptance near a relevant supply or demand area.
Why indicators create false confidence
RSI can stay overbought throughout a strong advance. A moving average can remain below price while late buyers continue entering on pullbacks. Neither tool identifies the swing that defines the range, the resting orders around its extremes, or whether a candle has rejected the level.
A naked chart provides that context. Mark the impulse, calculate its midpoint, and watch how price behaves there. Premium and discount describe location. Price action supplies the evidence.
Practical rule: Never treat a zone as a trade. Treat it as a place where the market must prove your idea.
Mapping the Equilibrium on Your Charts
A useful dealing range has to be visible and meaningful. If you choose arbitrary extremes, the 50% line becomes decoration rather than analysis. Start with the most recent clear impulse that produced a recognizable break, displacement move, or meaningful change in market structure.
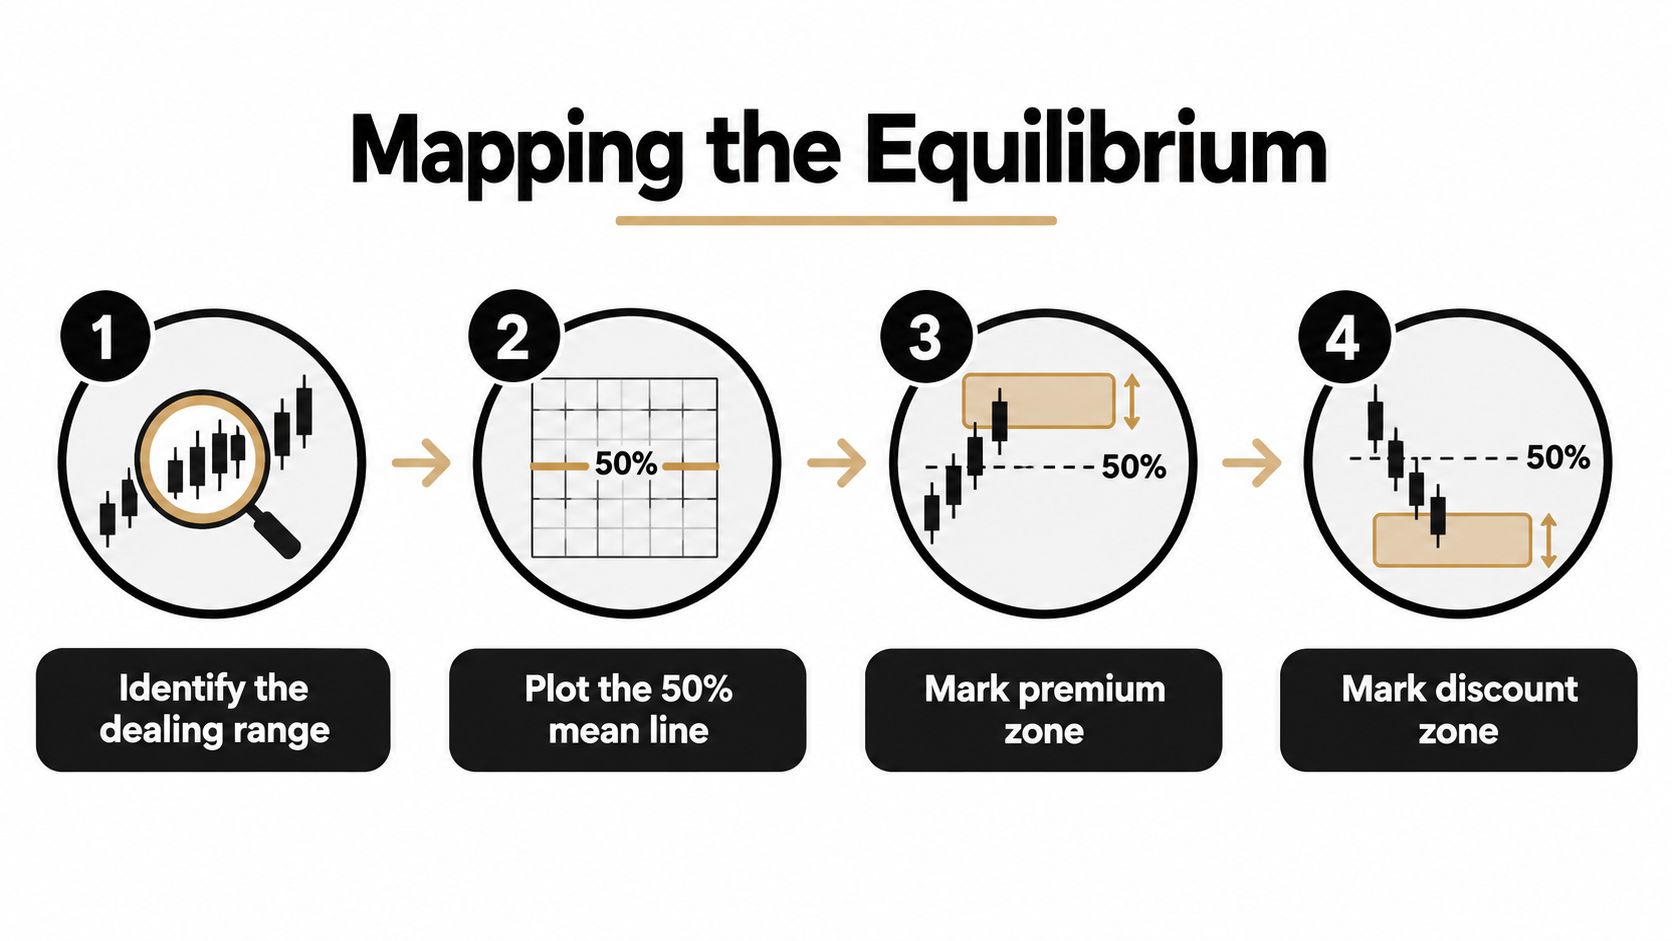
Four steps for drawing the range
1. Identify the dealing range.
Select the swing high and swing low that contain the price leg you're currently trading. In a bullish sequence, use the low that launched the impulse and the high where that impulse paused or reversed. In a bearish sequence, use the high that initiated the decline and the low that completed the move. Ignore tiny internal fluctuations unless you're deliberately working on a lower time frame.
2. Plot the 50% mean line.
Use a Fibonacci retracement tool as a measuring device, not as a prediction engine. Anchor it to the two selected extremes and mark the midpoint. The tool doesn't make the level important. The structural swing does.
3. Mark the premium zone.
Everything above the midpoint belongs to the premium array for that range. In a bearish setup, this is the area to inspect supply, failed breakouts, and bearish displacement before considering a short.
4. Mark the discount zone.
Everything below the midpoint belongs to the discount array. In a bullish setup, look for demand, liquidity sweeps, and a bullish shift before considering a long.
Let the time frame control the weight
A weekly dealing range can frame a broad swing, while an intraday range can organize a session or a single impulsive leg. The lower the time frame, the more often price will create overlapping ranges and conflicting midpoints. That doesn't make the levels useless, but it does make selection more demanding.
Use the higher time frame to establish directional context, then refine the active range on the execution chart. A daily discount zone may contain several lower-time-frame swings. You don't need to trade every one. Choose the range that explains the current displacement and remains respected by subsequent price action.
For a deeper treatment of selecting structural highs and lows, use this market structure analysis guide. Keep the process mechanical. If you can't explain why those two extremes define the current dealing range, redraw it before looking for an entry.
Here is the practical sequence:
- Find the impulse that changed structure.
- Anchor the range to its genuine origin and termination.
- Draw the midpoint.
- Label the upper and lower arrays.
- Wait for price to reach an array that agrees with your directional bias.
Aligning Zones with Supply and Demand
A discount zone on its own is not demand. It only tells you that price has moved into the lower half of the selected range. If the market is falling with expanding candles and repeatedly breaking lows, buying the discount can mean stepping in front of aggressive sellers.
The setup improves when the structural array overlaps a genuine demand zone. Demand is usually visible at the origin of a strong bullish displacement, especially when price leaves the area quickly, breaks a prior high, and doesn't immediately return. The inverse applies to supply. Look for the base or final opposing candle before a forceful bearish move that removes support or breaks a meaningful low.

Confluence beats location alone
Consider two long candidates in the same bullish dealing range. The first sits in discount but formed after a weak bounce, with no clear displacement and repeated tests of the low. The second sits in discount at the origin of a prior impulsive rally, where price previously removed a swing high. The second has a reason for buyers to defend it. The first merely has a favorable position on the measuring tool.
For shorts, reverse the logic. A premium location becomes meaningful when it overlaps fresh supply and price shows rejection or a bearish structural shift. A short in premium with no supply may just be fading strength.
| Chart condition | What it tells you | Trading response |
|---|---|---|
| Discount without demand | Location is favorable, but buyers haven't proved control | Wait |
| Demand inside discount | Price and structure agree | Watch for confirmation |
| Premium without supply | Price is relatively high, but sellers may be absent | Avoid automatic shorts |
| Supply inside premium | Location and opposing order flow align | Prepare a short trigger |
Freshness matters because repeated visits consume resting orders. A zone that has been tapped several times may still react, but you shouldn't treat it like untouched supply or demand. Also examine the departure. A wide, decisive move away from the zone carries more information than a slow drift.
A good zone doesn't promise a reversal. It gives you a logical place to demand evidence.
The Mechanics of Institutional Order Flow
Large participants can't always enter a full position at one price without moving the market against themselves. They distribute orders across available liquidity and may wait for price to return to areas where opposing orders can absorb their size. This is why the chart often revisits the origin of a displacement move instead of reversing at the first visible midpoint.
In a bullish campaign, buyers may accumulate during a pullback into discount. Their objective isn't to prove that the asset is intrinsically cheap. They need sufficient sell-side liquidity to fill buy orders with controlled slippage. When price reaches an old demand area, resting sell orders, stop-loss orders below local lows, and profit-taking can provide the liquidity required for larger buying.
A bearish campaign follows the same logic in reverse. Sellers may use a premium retracement to distribute inventory into eager buyers. Late buyers see an apparent continuation and provide the opposing flow needed for short orders. If supply holds, price leaves sharply. If buyers continue accepting higher prices, the short thesis fails.
Read the candle sequence, not the story you want
Volume can help explain participation, but it isn't a substitute for structure. On a chart, focus on the sequence:
- Price approaches the zone with controlled candles, or arrives with force.
- The market sweeps a nearby high or low.
- A rejection candle appears, but the next candle either confirms or invalidates it.
- Price breaks a local swing in the expected direction.
- The move creates displacement away from the zone.
A single pin bar proves very little. A rejection followed by a structural break is more useful because it shows that another group of traders has lost control.
Traders studying markets with complex liquidity conditions can also benefit from broader context in this resource on commodity trading firms. The same principle applies across instruments: distinguish visible price movement from the orders that may be driving it.
For the chart-level mechanics of identifying the origin of impulsive moves, see this order block trading strategy. The point isn't to guess what institutions secretly did. No chart gives you their complete order book. The point is to infer intent from displacement, liquidity behavior, and the locations where price previously moved decisively.
Execution Rules for High Probability Entries
The trade begins when price reaches the zone, not when you draw it. A midpoint or order block can identify opportunity, but a blind limit order assumes the market will respect your level without showing you whether buyers or sellers are still active.
Use a confirmation sequence that leaves room for the chart to disagree with you.
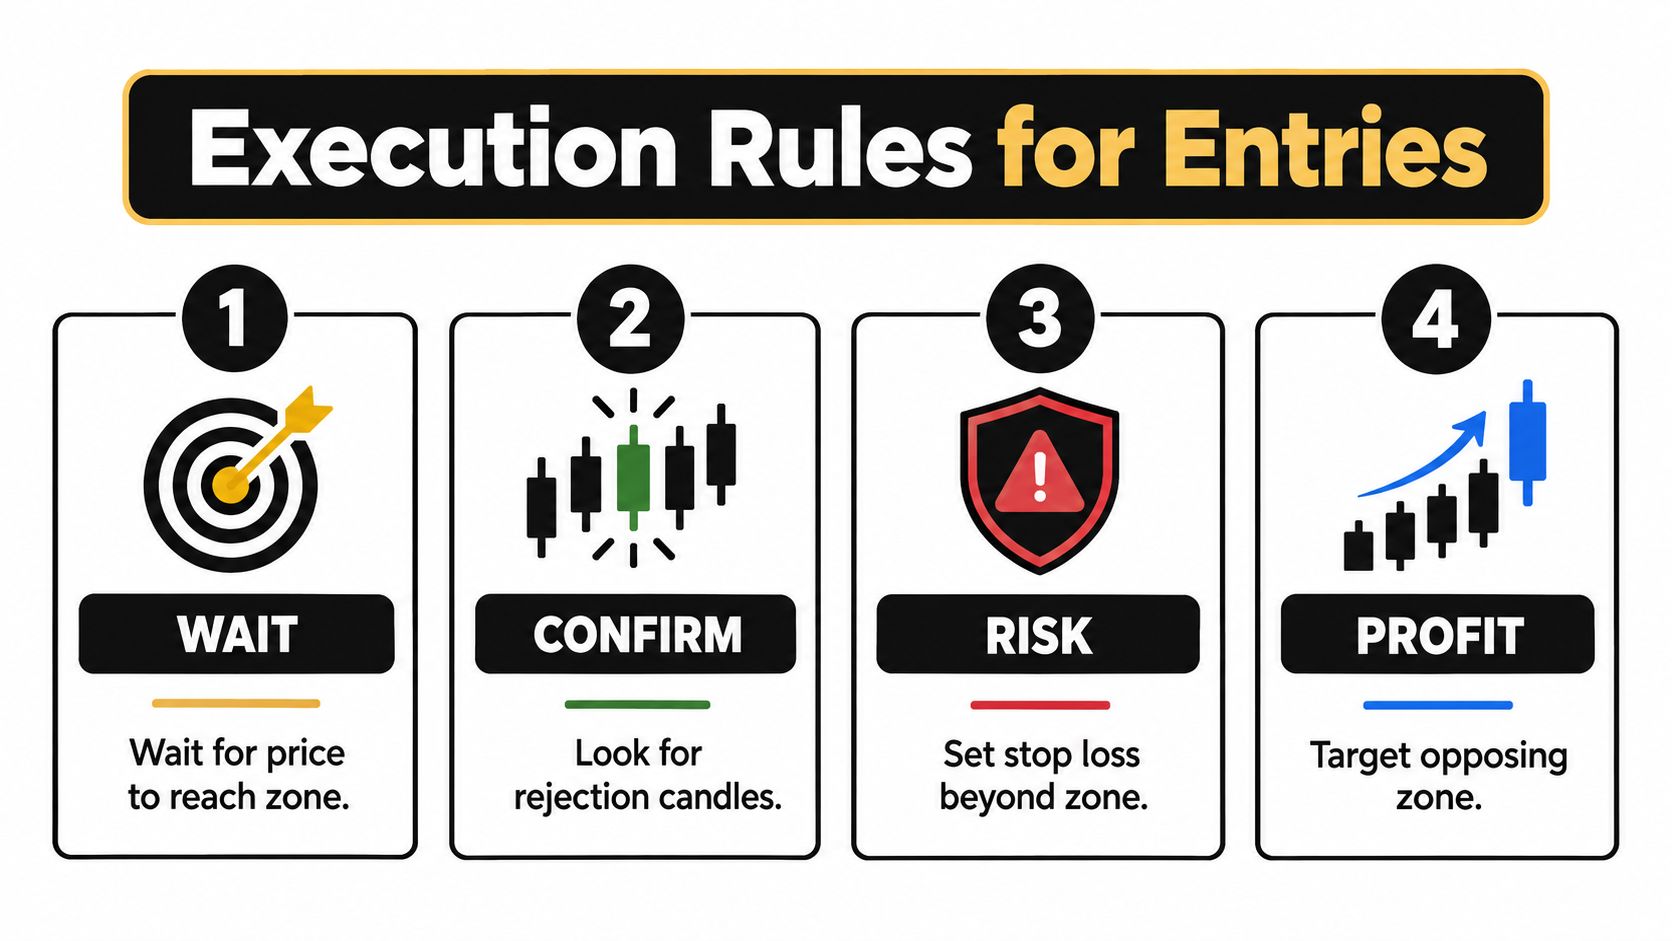
A disciplined entry sequence
Wait for arrival.
Don't chase a move because price is traveling toward discount or premium. Let it reach the area. If price never gets there, you haven't missed a trade. You've avoided paying an inferior price.
Look for a liquidity event.
A sweep through a nearby low can clear weak long positions before a bullish reversal. A sweep above a recent high can trap buyers before a bearish move. The sweep isn't automatically bullish or bearish. Its meaning comes from what follows.
Demand a rejection and a shift.
A wick into the zone is only an observation. For a long, look for rejection followed by a break above a relevant lower-time-frame swing. For a short, look for rejection followed by a break below a relevant swing. That shift gives you evidence that the immediate order flow has changed.
Place risk beyond invalidation.
Your stop belongs beyond the structural point that disproves the setup, not at an arbitrary distance from your entry. If a long depends on demand holding, a clean break and acceptance beneath that demand invalidates the idea. If the stop must sit inside the zone to create an attractive position size, the trade may be too tight to survive normal price testing.
Manage toward opposing structure
The opposing array is a logical destination, not a guaranteed target. A long from discount can first aim toward equilibrium, where price may rebalance. If price accepts above the midpoint, the premium side becomes the next area to inspect for supply. A short from premium can work toward equilibrium before testing discount demand.
Scaling out can reduce exposure as price approaches a meaningful opposing zone, while the remaining position can stay open only if structure continues to support it. Don't move your stop to breakeven merely because the first candle moved in your direction. Move it when the market has created a new structural reason for protection.
Execution rule: The zone creates interest. The lower-time-frame shift creates the entry. The invalidation point defines the risk.
Avoiding the Discount Value Trap
Discount is a location, not a buy signal. A bullish range can place price in discount while the market continues printing lower highs. A long lower wick inside demand may attract buyers, yet the next candle can break the zone, fail to recover it, and drive price to new lows.
The range measurement can be correct while the trade idea is wrong. Price action decides whether discount is a pullback location or part of a continuing decline.
The difference between a pullback and a breakdown
A healthy pullback leaves evidence that opposing pressure is weakening. Price may descend in overlapping candles, sweep a low, then reclaim a nearby swing with force. A breakdown shows acceptance below support, closes near the lows, and repeated failures to recover broken structure.
Use the range as a filter:
- Bullish context: Higher-time-frame structure remains constructive, and the pullback preserves the impulse that created demand.
- Bearish pressure: Sellers produce consecutive structural breaks, while each bounce fails beneath prior support.
- Failed confirmation: A bullish candle appears, but buyers cannot follow through or reclaim the broken swing.
- Invalidation: Price accepts below demand instead of merely probing it.
For example, a daily discount zone formed after a bearish break of structure is not automatically a long setup. If price accepts below demand for two closes, the zone has become part of a continuation leg. Discount now describes the location of price within the range, not a reason to buy it.
A discount during active bearish structure may call for no trade. As noted earlier, research on premium and discount behavior illustrates why cheap relative to a range does not guarantee protection from continuation. On the chart, the same principle is direct: cheap relative to a range doesn't mean protected from continuation.
Do not average into a broken zone because the original midpoint still looks attractive. After decisive displacement, redraw the active structure and wait for a fresh reclaim, a meaningful shift, or a new supply or demand reaction. If none appears, preserve capital and leave the setup alone.
Building a Consistent Price Action Routine
A reliable routine starts before the session opens. Begin with the higher-time-frame chart and mark the swing that best explains the current market structure. Draw equilibrium, identify the premium and discount arrays, and note the supply or demand zones that overlap them.
Then reduce the chart to the ranges you can trade. Too many overlapping midpoints create analysis paralysis. Keep the range that produced the latest meaningful displacement and use smaller ranges only when they clarify the entry rather than contradict the larger structure.
A practical daily checklist
Context first.
Is price expanding, retracing, or consolidating? Which swing created the current leg? Where did the last meaningful break occur?
Location second.
Is price in premium, discount, or near equilibrium? If it's near the midpoint, waiting often offers better clarity than forcing a directional opinion.
Zone quality third.
Does the array overlap fresh supply or demand? Did price leave that area with clear displacement? Has the market already tested it repeatedly?
Trigger last.
Did price sweep liquidity, reject the zone, and break a relevant lower-time-frame swing? If not, the setup isn't ready.
Keep a screenshot and a short note for every planned trade. Record the selected range, the reason for the zone, the confirmation you expected, and the condition that would invalidate the idea. This turns vague confidence into a reviewable process.
Routine standard: If you can't identify the range, the zone, the trigger, and the invalidation before entering, you're trading a feeling rather than a setup.
Pure price action doesn't remove uncertainty. It removes the false certainty that indicators can create when several signals point in the same direction. You'll still face missed trades, failed breakouts, and zones that never react. The advantage comes from making those outcomes acceptable before you enter, then repeating the same structural decision process without improvising after the candle moves.
Colibri Trader offers price-action-based education, including supply and demand and day trading programs, practical lessons on discipline and money management, and access to a free Trading Potential Quiz. If you want to refine how you map premium and discount zones and execute around raw market structure, visit Colibri Trader and review the available learning options.