




What Is a Hammer Candlestick Pattern and How to Trade It

You spot a candle that drops sharply, leaves a long lower wick, and finishes back near its opening price. The next candle is still forming, and the question arrives quickly: is this a hammer, or just another pause before the selloff continues?
That question captures what a hammer candlestick pattern is really about. The shape is easy to recognize, but the trade depends on where it forms, what the session reveals about buyers and sellers, and whether price confirms the rejection. A hammer isn't a guaranteed buy signal. It's evidence that sellers pushed lower and failed to keep control.
Why Every Trader Should Recognize a Hammer Quickly
You're watching a market decline into an area where price has previously found demand. Selling accelerates during the session. The low looks weak, but buyers step in, absorb the pressure, and push price back toward the open before the candle closes. On the chart, that fight appears as a small body near the top and a long lower shadow beneath it.
That single candle matters because it records a failed downside auction. Sellers found lower prices, but they couldn't hold them into the close. For a price-action trader, this can be the first visible clue that the balance between supply and demand is changing.
The clue is useful only in context. A hammer after a meaningful decline and near support may offer a reversal setup. The same shape in the middle of a sideways range may say little. After a sustained advance, the identical geometry is usually called a hanging man, where the long lower wick can warn that buyers are losing control rather than suggest a bullish reversal.
Practical rule: A hammer tells you where sellers failed. It doesn't tell you that buyers have already won.
The skill you want at the chart is therefore simple but valuable. First, recognize the geometry without hesitation. Next, ask whether the candle formed after a decline and at a meaningful location. Finally, wait for price to prove that buyers can follow through.
For a quick visual reference to related candle structures, use this candlestick patterns cheat sheet. By the end of this guide, you'll be able to separate a genuine hammer setup from a random long-wick candle and build a confirmation plan without relying on indicators.
What a Valid Hammer Looks Like on the Chart
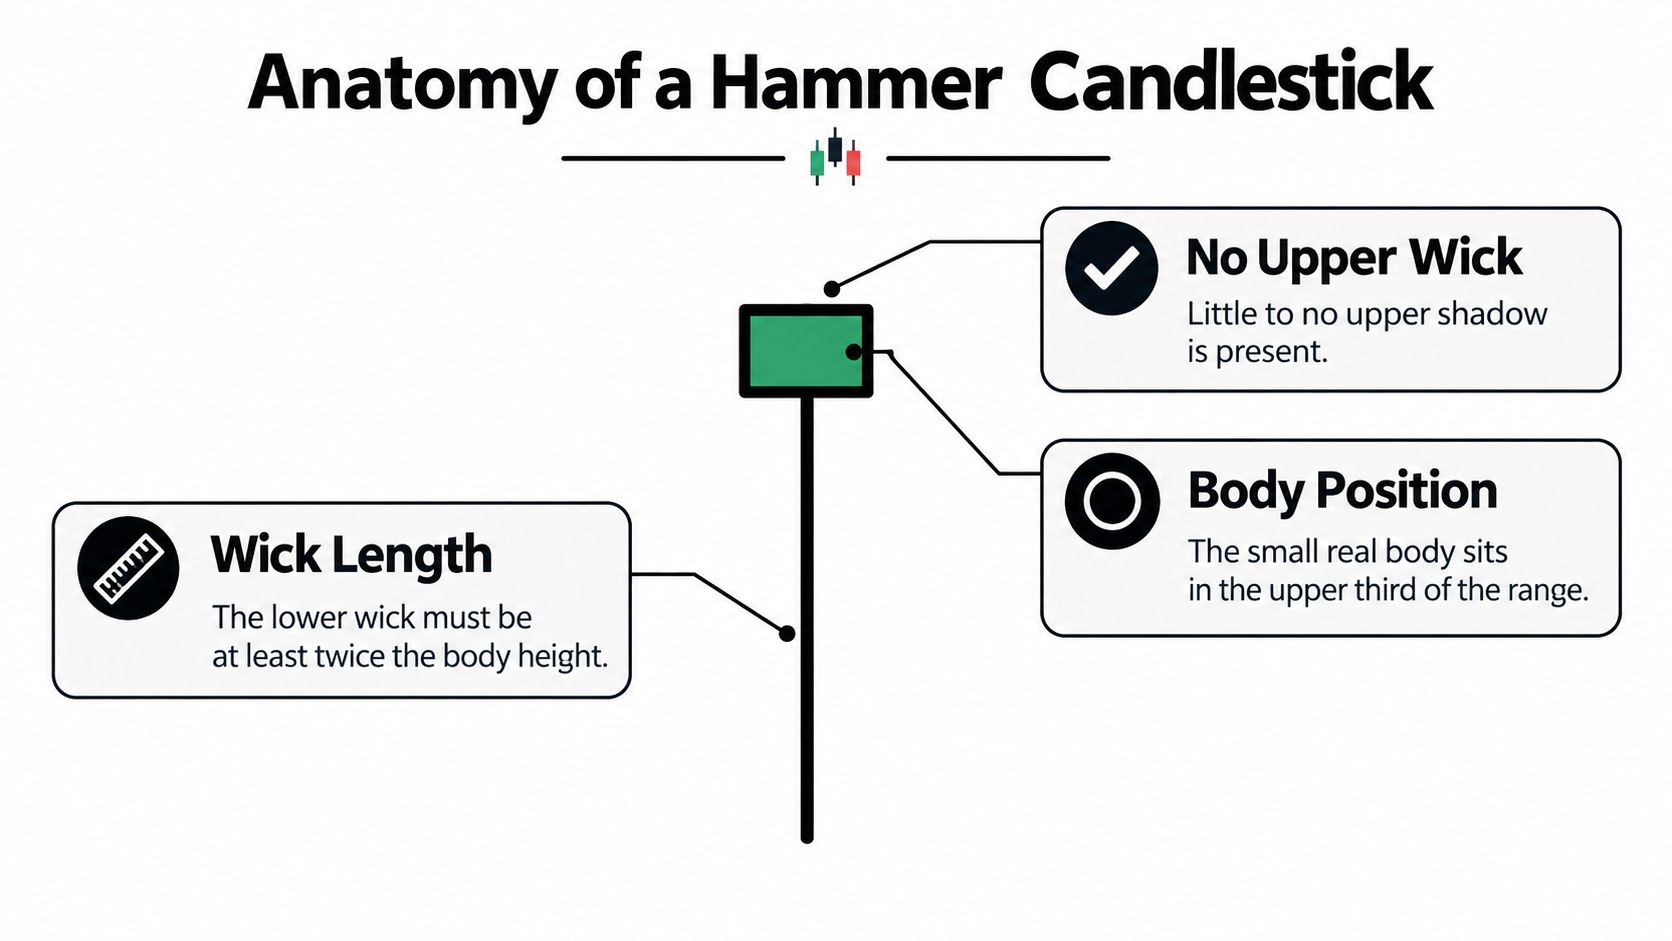
A valid hammer has a specific visual structure. Start with the candle's real body, the distance between its open and close. That body should be small and positioned near the top of the entire trading range.
Below the body sits the important feature, the lower shadow. It should generally be at least twice the length of the body. This long wick shows that price traveled well below the open during the session before recovering. The upper shadow should be little or nonexistent, because a close near the session high shows that buyers reclaimed much of the earlier decline.
Read the candle in three checks
Find the body. It should be compact and located near the upper part of the candle's range. A large body means the session wasn't mainly a rejection with a recovery.
Measure the lower wick. The lower shadow should dominate the candle and usually measure at least twice the body. It represents the distance sellers managed to push before buyers responded.
Inspect the upper wick. Little or no upper shadow is preferred. A large upper shadow means buyers also faced rejection near the top, which weakens the clean hammer story.
The candle can be green or red. A green body, where the close finishes above the open, shows stronger demand into the close, but the color doesn't override the structure or location. A red body can still qualify if the body remains small, sits near the high, and the lower shadow clearly dominates.
Separate hammers from lookalikes
The inverted hammer also appears after a decline, but its long shadow is above the body rather than below it. It shows that buyers attempted to lift price during the session, but the market didn't finish near those highs. It can still become a bullish setup, but it communicates a different intraperiod battle.
The hanging man has the same basic shape as a hammer, yet its location changes the interpretation. When it forms after an advance, the lower wick shows that sellers were able to drive price lower during the session. It may warn of weakening demand rather than announce a bottom.
A random long lower wick in a sideways market lacks the same context. Shape identifies the candle. Location gives it meaning. You can compare related formations with this guide to the pin bar pattern, since both patterns require careful attention to wick rejection and surrounding price action.
The Market Psychology Behind the Long Lower Wick
Think of the market as an auction. Sellers begin the session with enough confidence to push price below the opening area. Other traders see the decline and join them, driving the low farther away from the body.
Then the auction meets demand. Buyers accept those lower prices and absorb the available selling. As they continue bidding, price climbs back toward the open and the session high. The final candle doesn't erase the earlier selloff, but it records a clear failure to sustain lower prices.

That is why the long lower wick matters more than the small body by itself. The wick shows the path price traveled and the rejection that followed. The body near the high shows where the session ended after that struggle.
A failed downside auction
At support, the sequence can be especially meaningful. Price reaches an area where buyers previously defended the market. Sellers push through or probe below it, but the move attracts demand instead of fresh panic. Price returns above the area before the candle closes.
This doesn't prove that a new uptrend has begun. It only tells you that the downside auction failed during that period. Buyers still need to demonstrate follow-through in later candles.
The hammer is a report of rejection, not a promise of reversal.
The distinction protects you from buying every visually attractive candle. A hammer far from support may reflect short-term profit-taking or temporary volatility. A hammer at established demand, after a clear decline, gives you a more coherent story because trend, location, and rejection point in the same direction.
The next question is whether the pattern has enough evidence to justify a trade. That depends on confirmation, market conditions, and the rules you apply before entering.
How Reliable Is the Hammer After Confirmation
A hammer has a modest edge in some historical tests, but the results don't support treating it as a mechanical buy button. Definitions vary, and so do the conditions behind each result. The meaning of “successful” may depend on the holding period, the confirmation rule, the instrument, and the market environment.
A study using daily NIFTY 50 data from January 2019 through December 2024 identified 135 valid hammer signals, with 88 followed by the study's defined successful upward move, a 65.2% success rate. The researchers required a lower shadow at least twice the body, a body near the high, little or no upper shadow, and at least three consecutive bearish candles beforehand. These results are detailed in the published NIFTY 50 and VNQ hammer backtest.
A separate 16-year VNQ study reported 416 hammer formations and 249 correctly predicted increases, equal to 59.86%. Its one-tailed binomial test reported p = 0.000034, but that statistical result still belongs to the tested instrument, definition, and method. It doesn't automatically transfer to every market.
Published Hammer Backtest Results Compared
| Study sample | Valid hammers | Success rate | Key condition |
|---|---|---|---|
| Daily NIFTY 50, January 2019 through December 2024 | 135 | 65.2% | Three bearish candles beforehand, plus defined hammer geometry |
| VNQ real-estate ETF, 16-year sample | 416 | 59.86% | Study-defined upward outcome after each hammer |
These figures describe probability, not certainty. Even a result near sixty percent leaves many signals that fail, and a backtest may not reflect spreads, slippage, execution speed, or the judgment required to identify support in real time.
Confirmation changes the decision
A confirmed hammer gives you more information than an unconfirmed one. A later close above the hammer's high shows that buyers have followed through after the rejection. A break below the hammer's low does the opposite. It challenges the idea that buyers successfully defended the area.
Market regime matters, too. A cross-market study reported an overall hammer success rate of about 50.68%, with confirmation rates of 67.3% in stable conditions and 44.4% during crisis periods. Pairing the pattern with an oversold RSI produced 47.83%, so adding an indicator didn't automatically improve the outcome. See the cross-market hammer study for those conditions and limitations.
Use the hammer to form a hypothesis. Require price action to test that hypothesis before you risk money.
How to Trade Hammers With Price Action and Protection
A practical hammer plan starts with location, not candle hunting. You don't scan every chart for a familiar shape and buy the first one you find. You first ask whether price has declined into an area where buyers have previously shown interest.
Build the setup
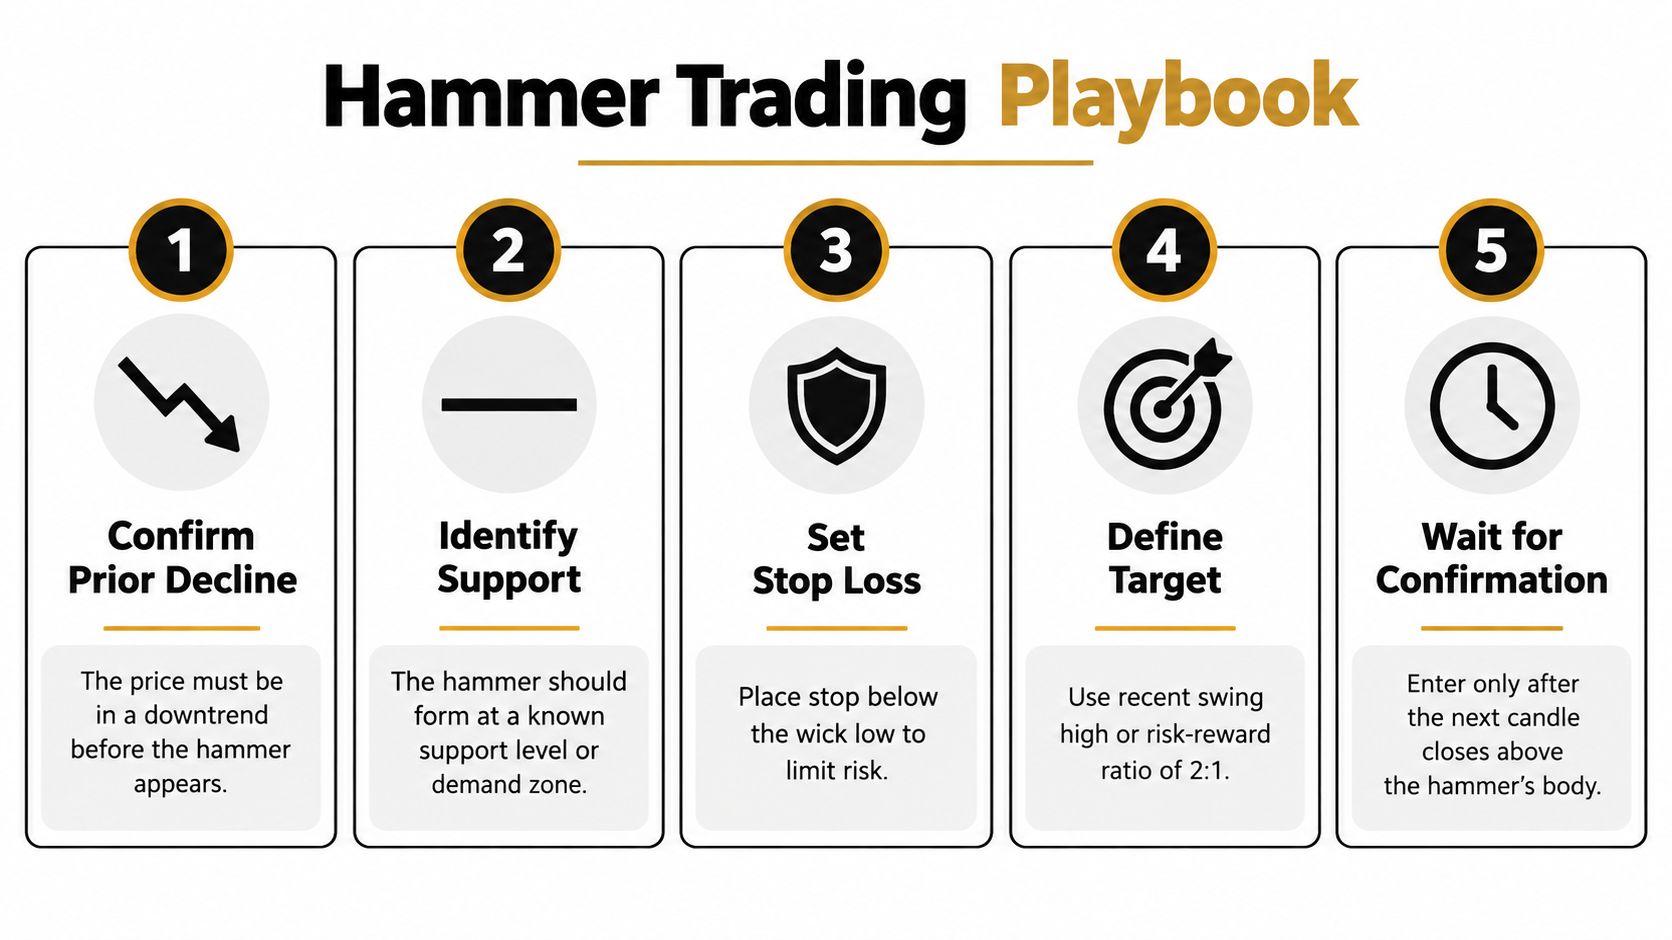
Confirm the prior decline. Look for a clear move lower, not merely one red candle. The hammer's reversal interpretation depends on a preceding bearish context.
Mark support or demand. Identify a prior reaction area, a former base, or a level where price previously moved away with force. The hammer becomes more useful when the rejection occurs at a location that already matters.
Validate the candle. Check the small body near the high, the lower shadow that generally reaches at least twice the body length, and the limited upper shadow.
Mark the high and low. These two prices create the decision boundaries. The high becomes a potential confirmation level, while the low provides a natural invalidation reference.
Wait for follow-through. A subsequent close above the hammer's high supplies evidence that buyers are continuing the rejection. Entering before that evidence means you're betting on the pattern before the market has confirmed it.
Protect the idea, not your hope
A common protective point sits below the hammer's low. If price breaks beneath that low, the market has returned to the area that buyers supposedly rejected. That doesn't guarantee the market must fall, but it invalidates the original hammer thesis clearly enough to exit according to your plan.
Your target should also be defined before entry. Nearby resistance, a recent swing high, or a preselected reward-to-risk framework can provide an objective destination. If the distance to resistance offers too little room for the risk below the wick, skipping the setup may be wiser than forcing the trade.
Volume can add context, but it isn't a universal requirement or magic threshold. Compare activity with the instrument's recent baseline and remember that thin or irregular markets can distort the reading. The price location and follow-through remain central for an indicator-free approach.
Risk rule: Decide where the trade is wrong before you decide how much you want it to win.
Use a simple checklist before placing an order:
- Trend: Has price made a meaningful decline?
- Location: Is the hammer at support or demand rather than in open space?
- Structure: Does the lower wick clearly dominate the small body?
- Confirmation: Has a later candle closed above the hammer's high?
- Invalidation: Is the exit below the wick low defined in advance?
- Target: Is there a realistic price objective before the next opposing area?
- Size: Does the position fit the distance between entry and invalidation?
For a deeper lesson on reading reactions at important levels, explore support level trading.
A visual lesson can reinforce the sequence:
Illustrated Examples and Common Failure Modes
A hammer at demand can work as a useful reversal setup. Price declines into a previous buying area, sellers push below it during the session, and buyers reclaim the range before the close. The next candle closes above the hammer's high, so the trader can define the entry and place invalidation below the wick.
That outcome still isn't guaranteed. The setup works because several pieces agree: a prior decline, a meaningful location, rejection of lower prices, and confirmation. Remove one of those pieces and the candle becomes much less informative.

Four traps worth recognizing
The middle-of-the-range hammer: Price prints a long lower wick inside a broad sideways market. Without a clear decline or support location, the candle may only show temporary two-way trading.
The hammer beneath resistance: Buyers confirm the candle, but price runs directly into an overhead supply area. A bullish candle doesn't remove nearby resistance, so the available upside may be limited.
The unconfirmed hammer: The candle looks perfect, but the next period fails to close above its high. Buying immediately turns a setup into a prediction, and the market hasn't yet supported that prediction.
The crisis-period rejection: During a sharp, discontinuous selloff, a long wick may represent short covering or temporary liquidity rather than durable demand. Research summarized in the cross-market study found materially weaker confirmation during crisis conditions than in stable conditions.
An inverted hammer creates another common misunderstanding. It can appear after a decline and show that buyers attempted to move price higher, but its long upper shadow makes it a different structure from the classic hammer. Wait for later price action rather than treating every reversal-shaped candle as interchangeable.
Volume deserves the same balanced treatment. Compare it with the market's recent activity if you use it, but don't turn one volume reading into a universal rule. The strongest lesson from failed examples is straightforward: a candle cannot compensate for poor location or an unsuitable market regime.
Your Next Step After Learning the Hammer
Remember the hammer as a failed downside auction at a meaningful location. Sellers pushed price lower, buyers absorbed that pressure, and the market closed near the upper part of the session range. That is useful information, but it becomes tradable only when the prior decline, support, confirmation, and invalidation line up.
Don't memorize the shape and then search for reasons to enter. Start with historical charts and mark every candidate hammer you find. Record the prior trend, the nearby support, whether price closed above the hammer's high, and what happened after the setup failed or followed through.
Your goal isn't to prove that hammers always work. The available evidence points to a modest edge that changes with the instrument, timeframe, confirmation method, and market regime. Your job is to discover which conditions make the pattern meaningful in the markets you trade.
Review a small sample consistently, keep your rules unchanged, and let the results challenge your assumptions. Price action improves when you study decisions, not just formations.
Colibri Trader offers price-action education covering candlestick structures, support and demand, trading discipline, and risk management without requiring indicator-heavy analysis. Visit Colibri Trader to explore its practical learning programs and apply the hammer framework through structured chart practice.