




Support Level Trading: Practical Price-Action Setups

Most traders don't lose at support because support is useless. They lose because they treat a probability zone as a guaranteed floor. Research from the Federal Reserve Bank of New York found that published support and resistance levels had measurable value in forecasting temporary interruptions to exchange-rate trends, yet that finding never meant every level would produce a profitable bounce or hold at one exact price (Federal Reserve Bank of New York research).
That distinction defines practical support level trading. You aren't predicting that buyers must appear. You're locating an area where the odds may shift, waiting for price action to confirm whether demand is actually present, and risking a fixed amount if the idea fails.
What Support Level Trading Really Means
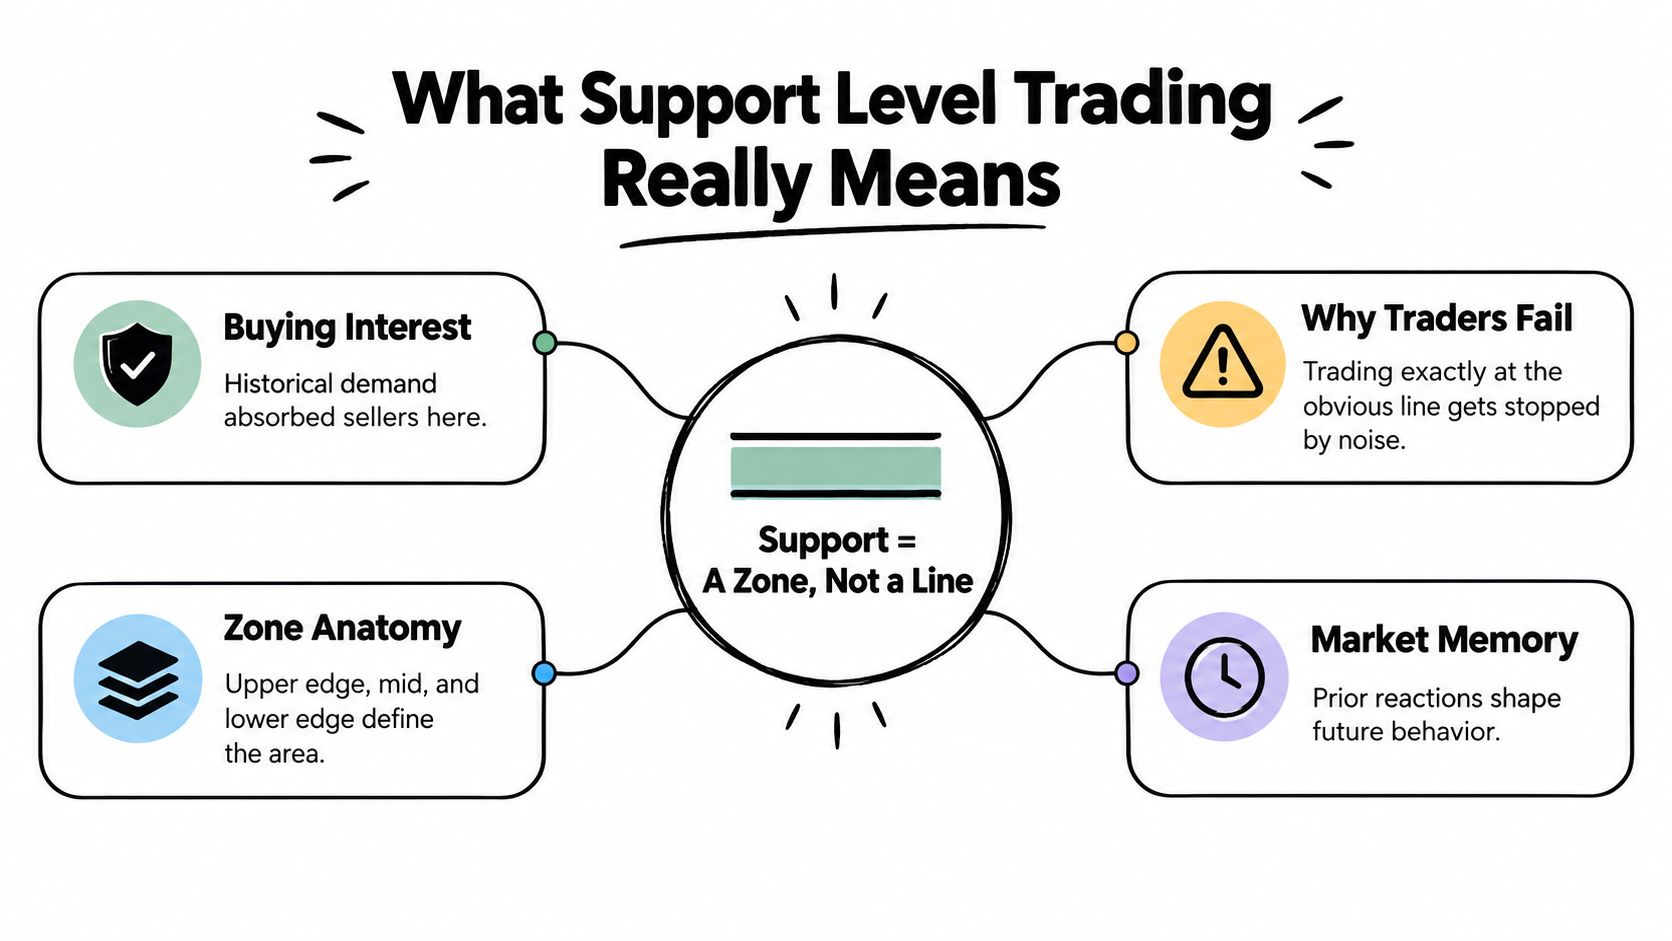
Support level trading starts with a probability zone, not a price line. Selling pressure has previously been absorbed strongly enough for price to pause, reverse, or launch into a new impulse. The marked level is only a reference inside a wider area shaped by prior orders, trader memory, volatility, and the speed of the approach.
Research on published support and resistance levels found that exchange rates often interrupted their trends near those areas, showing that a level can carry information without identifying an exact reversal price. The practical edge comes from deciding how to respond when price returns.
The three decisions behind the trade
A support setup is only as clear as these three decisions:
- Zone definition: Mark the full area where price previously interrupted a decline or accelerated upward. Avoid treating one wick or closing price as the entire structure.
- Confirmation trigger: Define the behavior required before entry. It might be a rejection wick, a bullish close, a higher low, or a reclaim after a brief breach.
- Risk-defined execution: Set the invalidation point beyond the zone, calculate position size from the distance to that stop, and reject the trade when the target does not justify the risk.
The sequence matters. A trader can identify a well-formed area and still lose by entering before buyers show control, placing the stop inside normal volatility, or sizing the position without considering the stop distance. A touch alone provides location, not confirmation.
Practical price action trading asks a more useful question than “Will support hold?” Look for behavior that shows buyers defending the area, then define the price action that proves the idea wrong. A failed level is information only when the invalidation rule was set before the entry.
Timeframe changes the meaning
A support zone on a 15-minute chart reflects short-term order flow and session behavior. A daily zone may reflect a broader shift in positioning and attract traders with different holding periods. Neither timeframe is automatically superior, but each requires its own expectations, trigger quality, and stop placement.
Treat the timeframe as part of the trade plan. Ordinary intraday noise can break a narrow zone without invalidating the larger market structure, while a daily setup may need more room and patience. The zone, confirmation trigger, invalidation point, and position size must match the same market context. That alignment determines whether support level trading is a defined trade or an unstructured bet.
Spotting a Valid Support Zone on the Chart
A valid support zone is a probability area, not a line that automatically deserves a buy order. Start with structure: a clear swing low, consolidation base, or reaction area. Then ask whether price left that area with enough force to show a meaningful imbalance between buyers and sellers.
The departure is often more informative than the first touch. Price may drop into the area, stall, reject lower prices, and then move away through consecutive bullish candles or a clear change in swing structure. That sequence shows what buyers did after entering, while a lone lower wick only shows that price paused.

Read the reactions, not just the touches
Mark the upper and lower edges of the reaction area, then examine the behavior around them:
- Strong departure: Price moved away decisively, leaving a clear swing or impulsive leg.
- Quality rejection: A lower wick followed by a bullish close shows that sellers pushed lower but buyers reclaimed ground.
- Narrow pause: Small candles near the zone can show temporary balance before a directional move, especially when the next break is clean.
- Freshness: A recently formed zone generally deserves more attention than an old level that has been repeatedly consumed.
A BOSS-style bullish reaction, meaning a clear bullish rejection followed by a break in the immediate bearish swing structure, carries more weight than a wick without follow-through. The candle does not need to look perfect. It needs to show sellers losing control and buyers closing with authority.
Horizontal support versus rising demand
Horizontal support forms around a consistent price area. A rising demand zone develops through higher lows, with buyers responding at progressively higher prices. A diagonal trendline can describe that behavior, but the underlying swing structure still decides whether the zone is credible. The same supply-and-demand logic is explained in this guide to trading supply and demand zones.
Volume and spread expansion on the approach add context. A fast decline with wide candles can signal urgency and possible exhaustion, but it can also mean price is moving too quickly to catch safely. A slow, narrow decline presents a different auction from sharp liquidation. Indicators may support the reading, but they should not override the candles and structure.
My marking checklist
- Clear prior reaction: Price previously rejected or based in the area.
- Identifiable zone width: The upper and lower boundaries are visible.
- Meaningful departure: Price left with decisive movement or a structural shift.
- Understandable approach: The move into support has a readable pace and character.
- Room to resistance: The next resistance leaves enough space for the planned trade.
For broader chart work, compare these observations with established key market analysis techniques, while keeping the support decision rooted in observable price behavior. Downgrade a zone that is thin, ancient, or being chipped away by repeated weak bounces. A clean mark improves the odds of a disciplined decision, but confirmation, invalidation, and position size still determine whether the setup deserves risk.
Three Entry Styles and When Each One Fits
The same support zone can produce three different entries. The choice depends on how much uncertainty you're willing to accept and how much distance you need between entry and invalidation.
The first is the first-touch reaction. Price reaches the zone for the first time after a strong departure, prints a rejection wick or bullish reversal candle, and triggers an entry before a closing confirmation. This approach gives the best potential reward-to-risk because the entry is close to the zone, but it also has the lowest confirmation. If price continues through the area, the early entry has no structural proof behind it.
The second is close confirmation. Price trades into support, then closes back above the zone or forms a bullish candle that breaks the immediate bearish sequence. You enter after that evidence appears. The trade usually has a better information set, but the entry is farther from invalidation, so the reward-to-risk can deteriorate.
The third is the reclaim entry. Price briefly breaks beneath support, triggers concern or stops, then closes back inside or above the zone. Instead of buying the initial touch, you wait for the market to prove that the breakdown failed. This is particularly useful after a news-driven flush, but it can leave you entering late if the reclaim candle is unusually large.
An empirical study of horizontal support and resistance in U.S. equities found that support predicted trend interruptions better than resistance, but the apparent forecasting ability didn't produce excess returns over a simple buy-and-hold comparison (study of horizontal support and resistance). That makes support a reasonable place to look for a reaction, not a reason to remove your risk controls.
| Entry Style | Reward-to-Risk | Confirmation Required | Best Market Condition |
|---|---|---|---|
| First-touch reaction | Highest potential | Minimal, usually a rejection candle | Clean approach and controlled volatility |
| Close-confirmation entry | More limited | Close back above support or structure break | Swing continuation with orderly price action |
| Reclaim after breach | Variable, often reduced | Failed breakdown and reclaim | News-driven flush or false break |
My decision is contextual. I use first-touch entries only when the zone is fresh and the approach is losing momentum. I prefer close confirmation when the market is orderly but uncertain. I want a reclaim when the initial break is fast, emotional, or accompanied by a suspicious failure to hold below the zone.
Stops, Targets, and Position Sizing That Actually Match the Setup
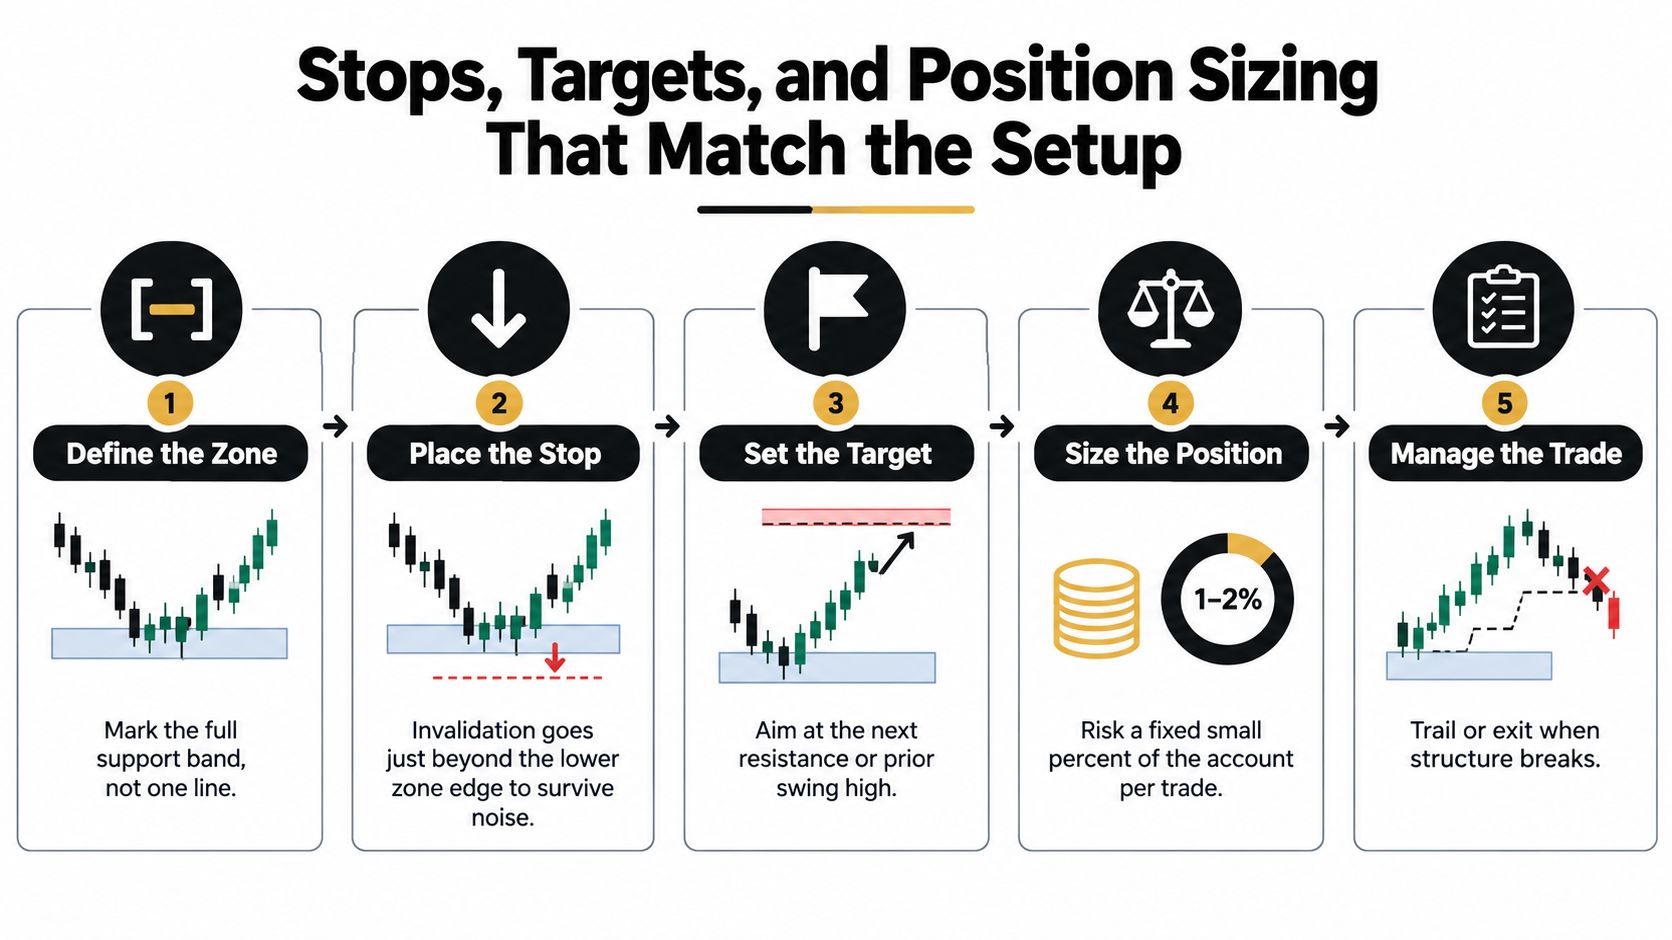
The stop belongs beyond the invalidation area, not directly on the line everyone can see. If support spans an upper edge, middle, and lower edge, a long trade is invalidated when price accepts below the lower edge, not merely when a wick trades through the reference price.
That doesn't mean placing an enormous stop. The distance should reflect the asset's normal movement, the session, and the width of the zone. A stop that is too tight gets removed by ordinary noise. One that is too wide can make the required position size too small or leave the target economically unattractive.
Build the trade from risk outward
Start with a fixed monetary risk. Divide that amount by the stop distance in pips, points, or price units to calculate the position size. Then check whether the logical target, such as the next resistance or previous swing high, provides enough reward relative to the complete risk.
A common personal filter is to reject trades that don't offer at least 1.5 to 2 times reward relative to risk before costs. That range is a planning threshold, not a guarantee of profitability. Spread, slippage, and commissions can materially reduce a small edge, particularly when the target is close or the trade occurs on a lower timeframe.
The position sizing in trading guide is useful for turning that principle into a repeatable workflow. The practical sequence is:
- Mark the whole zone.
- Place invalidation beyond the lower boundary.
- Select a target before entry.
- Calculate size from fixed risk and stop distance.
- Subtract realistic transaction costs from the expected reward.
Don't move the stop farther away because price has entered the zone and feels temporarily uncomfortable. If the original location was wrong, the trade is wrong. If the stop is technically valid but the target is blocked by nearby resistance, skip the setup rather than forcing a favorable-looking entry into poor geometry.
A Real Support Trade and a Real Failure Walked Through
Consider a bullish market that pulls back toward a prior demand area after making a higher high. The decline arrives in overlapping candles rather than a series of expanding bearish bars. At the zone, price prints a lower wick, closes near the top of the candle, and then breaks above the high of the preceding bearish candle.
The entry is taken on that bullish break, not merely because price touched support. The stop sits beyond the lower edge of the zone, with enough room for a marginal sweep. The first target is the prior swing high, and the trade is left alone while price holds above the rejection candle's low. The decisive moment was the combination of rejection and structure change. The support area created the location, but the candle sequence created the trade.
A different setup begins with the same apparent ingredients. Price reaches a well-known zone, prints a lower wick, and attracts a long entry. The next candle closes beneath the entire support band with expanding range. Instead of reclaiming the area, price retests the underside and rejects it as new resistance.
That trade has failed. The correct response is to exit at the planned invalidation, record the breach, and avoid buying again just because the original level looked attractive. The loss wasn't caused by the existence of support. It came from the market accepting prices below the area, which invalidated the bullish premise.
A useful replay exercise is to pause the chart immediately before each entry and ask what evidence was available at that moment. Don't judge the trade by its final outcome alone. Judge whether the trigger, stop, and target matched the information visible before the move.
Validating Your Edge Without Fooling Yourself
A support setup isn't validated because it looks convincing on a chart. You need a record of entries, exits, costs, market conditions, and mistakes. Without that record, a trader can easily remember clean bounces and forget the slow failures, premature entries, and trades that only looked obvious after the fact.
Retail profitability data should make this a standard requirement. A cited Taiwanese-market analysis found that around 20% of active retail traders were profitable in an average year, fewer than 1% showed reliably positive abnormal performance in the following year, and about 3% of traders active for more than 300 days achieved positive net profit (Taiwanese retail trading analysis). Those figures aren't results for support setups specifically, but they show why confidence from a handful of chart examples is dangerous.
Record the conditions behind each result
For every support trade, log:
- Net expectancy: Average outcome after spread, slippage, and commissions.
- Profit factor: Gross profit divided by gross loss.
- Maximum drawdown: The deepest decline in the tested sequence.
- Zone variables: Number of prior touches, age, width, and quality of the departure.
- Market context: Volatility regime, session, trend condition, and distance to resistance.
- Execution type: First touch, close confirmation, or reclaim.
The sample must be large enough to expose losing clusters and changing conditions. A small collection of attractive examples can't separate a genuine edge from random price clustering. Test one instrument and one defined timeframe first, then expand only after the results remain stable.
More activity doesn't automatically improve learning. Historical household-account research summarized in trading literature found that the most frequent traders underperformed buy-and-hold by 11.4% annually before costs and 7.0% after costs (evidence on technical analysis and trading behavior). The same source reports that accounts making 15 or more trades monthly averaged larger losses than less-active accounts. A trader who waits for fewer, better-defined reactions may learn more than one who trades every touch.
Pre-Trade Checklist, Practice Drill, and Final Takeaways
Before entry, verify:
- Zone quality: Did price leave the area with a clear reaction?
- Trigger: What exact candle or reclaim condition activates the trade?
- Invalidation: Is the stop beyond the zone rather than on the obvious line?
- Target: Is the next resistance or swing high far enough away?
- Position size: Did you calculate size from fixed risk and stop distance?
- Costs: Do spread, slippage, and commissions still leave acceptable trade geometry?
During the trade, don't widen the stop, add to a losing position, or ignore the session context. If price closes beyond support and fails to reclaim it, accept the information instead of arguing with the chart.
For practice, use a demo account for two weeks. Mark the previous week's zones, record only grade A or B setups, note whether the entry was first-touch, confirmation, or reclaim, and review the result with the chart hidden after each trade. Colibri Trader offers price-action education and practical programs that address support zones, supply and demand, execution discipline, and money management, which can complement that deliberate practice.
Support is a probability zone, not a promise. Your job is to define the area, wait for evidence, size the position, and exit when the market invalidates the idea. This approach is the wrong tool for a market with no clean structure or for a strategy whose measured expectancy remains negative after costs.
If you want a structured way to practise these decisions, visit Colibri Trader for price-action lessons and trading programs focused on support zones, supply and demand, execution, and risk management. Use the material to build a tested routine, then judge the approach by your own logged results rather than by isolated winning trades.