




Position Sizing in Trading: How to Size Every Trade Right

You've found a clean price-action setup. The entry is clear, the invalidation level sits beyond the structure, and the position-size formula gives you a quantity that appears perfectly controlled. Then the market opens through your stop, liquidity disappears, or a news release sends price several levels beyond the point where you planned to exit.
That's how a mathematically correct trade can produce a realized loss far larger than the number on your spreadsheet. I've made that mistake myself. The stop was technically valid, but I treated the distance to the stop as if it were a guarantee rather than an estimate of where execution might occur.
Position sizing in trading still begins with account equity, risk, and stop distance. It just can't end there. A durable process also asks what happens if the stop slips, the market gaps, volatility expands, or several related trades fail together.
Why Most Position Sizing Still Loses Money
The standard calculation is attractive because it looks complete:
Position size = account risk ÷ stop distance
If your account risk is fixed and your stop distance is known, the formula produces a precise quantity. That precision can create false confidence. The market doesn't know your planned stop, and it doesn't promise to fill your order at that level.
A trader buying near demand might place an invalidation stop below the zone. Under normal conditions, the trade reaches the stop and exits close to the intended price. Under stressed conditions, bids can thin out and the next available execution can be materially worse. An overnight gap can bypass the stop entirely, while a news-driven jump can move through several price levels before liquidity returns.
Research into trade-sizing algorithms has examined historical volatility, extreme-value estimates of Conditional Value at Risk, and Conditional Drawdown at Risk across EUR/USD, NZD/MXN, U.S. Treasury futures, and G10 currencies. The findings support a practical warning: ordinary volatility-based sizing may fail to capture tail events that matter most when a position is already losing. Research on trade-sizing algorithms and tail risk provides useful context for why a planned stop shouldn't be treated as the entire risk model.

The stop is an assumption, not a shield
A stop answers one question: where is the trade invalidated? It doesn't answer how much the market may cost you while you're getting out.
That distinction changes the question you should ask before entering. Don't ask only, “How many shares or contracts can I buy?” Ask, “How much exposure can I tolerate if the planned exit fails?”
Your answer should account for:
- Execution quality: Can the instrument normally fill close to the stop, or does it move quickly through thin liquidity?
- Market timing: Is the position exposed to an overnight session, an economic release, earnings, or another scheduled catalyst?
- Portfolio interaction: Would another position lose money for the same underlying reason?
- Drawdown tolerance: Can you continue executing your strategy if the loss exceeds the planned amount?
The practical foundation is still a written money-management process. A useful guide to money management in trading can help connect individual trade risk with broader account protection, but the central principle is simple: a position is sized against plausible realized loss, not just chart distance.
Practical rule: If you can't explain what happens when price jumps through your stop, your position is not fully sized yet.
Fixed Fractional Position Sizing Step by Step
Fixed fractional sizing is the cleanest starting point because it ties risk to current account equity. You choose a fraction of the account to place at risk, calculate the monetary risk allowance, and divide that allowance by the loss per unit at the planned stop.
The method works like this:
- Determine current account equity.
- Select the fraction of equity you're willing to risk.
- Calculate the distance between entry and stop.
- Convert that distance into a loss per share, contract, or lot.
- Divide risk allowance by loss per unit.
- Round down to a tradable quantity.
The familiar examples of risking 1% or 2% per trade are fixed-fractional approaches, but they aren't universal laws. The appropriate fraction depends on the quality of your evidence, the instrument, the execution environment, and the drawdown you can withstand. The basic method is useful because it prevents a wider stop from automatically becoming a larger monetary bet.
The calculation
Use this structure:
Risk allowance = account equity × risk fraction
Position size = risk allowance ÷ (entry price − stop price)
For futures or other instruments, include the contract multiplier.
Position size = risk allowance ÷ (stop distance × value per point)
Suppose your current equity is E, your selected risk fraction is r, your entry is P, and your stop is S. The position size is:
(E × r) ÷ (P − S)
If the stop is wider, the denominator increases and the quantity decreases. If the stop is tighter, the quantity increases, but that doesn't automatically make the trade safer. A tight stop can sit inside ordinary market noise, causing frequent exits, while a larger quantity makes any execution error more consequential.
The position size calculator can handle the arithmetic using account equity, risk percentage, and stop-loss distance. You still have to decide whether the stop is structurally sensible and whether the resulting quantity remains appropriate under stressed conditions.
Position size under different stop distances
| Account Equity | Risk Percent | Stop Distance | Position Size |
|---|---|---|---|
| Current equity | 1% | Narrow stop | Risk allowance ÷ narrow stop loss per unit |
| Current equity | 1% | Wide stop | Risk allowance ÷ wide stop loss per unit |
| Current equity | 2% | Narrow stop | Larger risk allowance ÷ narrow stop loss per unit |
| Current equity | 2% | Wide stop | Larger risk allowance ÷ wide stop loss per unit |
The table shows the important relationship without pretending that one quantity fits every setup. Two trades can use the same account fraction while carrying very different operational risks. The wider-stop trade uses fewer units, but it may still face greater overnight or volatility exposure because the market has more room to move before invalidation.
Fixed fractional sizing is effective for routine execution because it is repeatable. Its weakness appears when the planned stop is unreliable, when trades are correlated, or when your estimate of strategy edge is weak. Treat the formula as the first filter, then test the result against the scenario band described later.
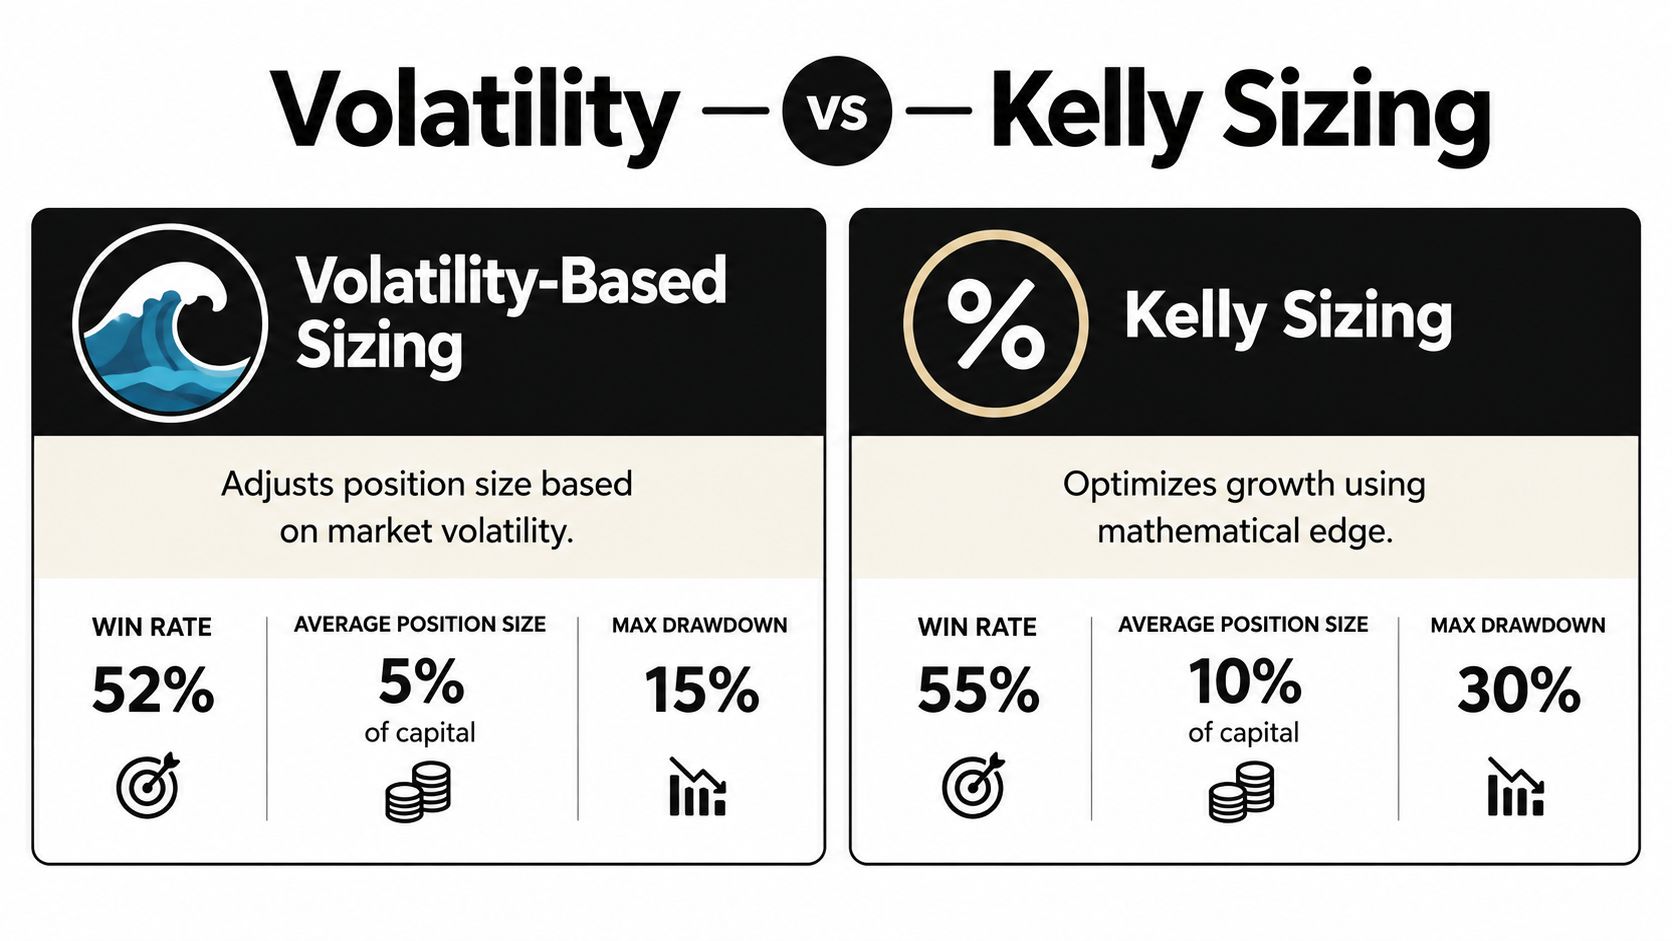
Volatility-Based Sizing vs Kelly Sizing Compared
Fixed fractional sizing starts with account equity. Volatility-based sizing starts with market movement. The idea is to reduce quantity when the instrument is noisy and permit more quantity when its movement is relatively contained, while keeping the intended risk relationship consistent.
That sounds more adaptive, but it depends on the volatility measure you choose. Historical volatility can understate a market that is about to react to news. Recent volatility can overstate risk after a temporary shock. A volatility estimate also doesn't automatically tell you how liquidity will behave when the position reaches its invalidation level.
Kelly sizing makes a different promise. It attempts to maximize long-term growth based on the estimated probability of winning, the probability of losing, and the payoff relationship. The theory is elegant. The inputs are fragile.
Your win rate may come from a small sample. Your payoff ratio may change across market regimes. Trades that look independent in a spreadsheet may respond to the same macro event. If those assumptions are wrong, Kelly can recommend far more exposure than your actual edge can support.
What each method assumes
A comparison is more useful than declaring a single winner:
| Method | Core Assumption | Main Risk | Best For |
|---|---|---|---|
| Fixed fractional | Account equity and chosen risk fraction provide a stable control | Ignores changes in volatility and execution quality unless adjusted manually | Traders who need a simple, repeatable baseline |
| Volatility-based | The volatility estimate represents future movement well enough to guide exposure | Historical measures can miss sudden jumps, gaps, and liquidity stress | Traders with reliable volatility data and clearly defined instruments |
| Kelly sizing | Win probability, payoff, and trade independence are estimated accurately | Estimation error can produce aggressive sizing and severe drawdowns | Experienced traders with substantial, stable performance evidence |
A study of technical timing strategies found that position sizing can materially change risk and return outcomes, and that an optimal size doesn't necessarily exist under a standard Kelly framework. The same research reported that smaller trading fractions produced the strongest risk-adjusted results in many scenarios. Its simulations also described surviving traders using approximately 3.7% to 6.6% positions, while bankrupt traders used roughly 22.9% to 23.7%, illustrating how oversizing can create nonlinear damage. The research on position sizing, technical timing, and Kelly-style assumptions is a useful counterweight to the idea that maximum theoretical growth should always be the target.
A practical decision
Use volatility-based sizing when market noise is central to your strategy and you have enough data to distinguish ordinary movement from exceptional conditions. Don't use it as a magic adjustment. A volatility number that ignores scheduled news or gap risk can still produce an oversized position.
Use Kelly as a theoretical ceiling, not a default target. If your edge estimate is uncertain, trade below the theoretical output or stay with fixed fractional sizing. Your objective isn't to maximize a spreadsheet's growth curve. It's to preserve enough capital and confidence to execute when the strategy enters an adverse period.
For most novice and intermediate traders, fixed fractional sizing with a volatility and execution check is more reliable than full Kelly. Advanced methods should add discipline, not provide a mathematical excuse to increase size.
Applying a Scenario Band to Your Position Size
A single position-size number hides uncertainty. A scenario band makes that uncertainty visible by calculating the trade under three possible loss conditions:
- Normal loss: Price reaches the planned stop and execution is close to the expected level.
- Stressed loss: Volatility expands or liquidity deteriorates, producing a worse fill than planned.
- Gap loss: Price jumps beyond the stop, creating a materially larger realized loss.
You don't need a perfect forecast for each scenario. You need a conservative set of assumptions that prevents the normal case from controlling every decision.
Start with the chart, then challenge it
For a price-action setup, mark the entry, structural invalidation, and likely execution conditions. A demand-zone trade held during liquid market hours may have a different stressed-loss assumption from a position held through an uncertain event. A breakout trade near a major catalyst may deserve smaller exposure even when the chart stop is technically close.
Calculate the normal position using the fixed fractional formula. Then ask what happens if the loss per unit is larger under stress. If the stressed scenario would exceed your acceptable drawdown, reduce the quantity before entry. If the gap scenario would cause damage you can't tolerate, the correct position size may be zero.
The right quantity is the largest size that remains survivable across your chosen scenarios, not the largest size permitted by the normal stop.
You can organize the decision in a simple worksheet:
| Scenario | Assumption | Action |
|---|---|---|
| Normal loss | Planned stop executes near the expected level | Use the baseline quantity only if the other scenarios remain acceptable |
| Stressed loss | Slippage, wider spreads, or rapid movement worsens the fill | Reduce quantity or wait for calmer conditions |
| Gap loss | Price bypasses the stop during an overnight or news-driven jump | Reduce sharply, hedge where appropriate, or skip the trade |
When the band changes the trade
The scenario band should affect more than the order size. It can change whether you take the setup, whether you hold it overnight, and whether you choose a different instrument with finer quantity control.
A wide structural stop isn't automatically bad. It may be the correct location for invalidation. The mistake is forcing a large quantity into the trade because the account-risk formula says you can. A smaller position with a structurally sound stop is often easier to manage than a tightly stopped position whose size leaves no room for normal movement.
Review the band before every trade exposed to thin liquidity, scheduled news, overnight risk, or an unusually fast market. The practice replaces false precision with a range of plausible outcomes.
Building a Complete Position Sizing and Risk Rule Set
Position size works only inside a broader rule set. A trader can calculate every entry correctly and still accumulate excessive exposure through correlated positions, trade too frequently after a loss, or continue using normal size while the strategy's evidence deteriorates.
Start with four controls:
- Trade risk: Set a maximum planned loss for an individual position.
- Portfolio risk: Treat highly correlated setups as one risk cluster rather than unrelated bets.
- Drawdown control: Reduce exposure as account drawdown approaches a predefined limit.
- Evidence quality: Use smaller size when the strategy's edge is uncertain or recent results are unstable.

A practical rule set can also include daily and weekly loss limits. These limits aren't predictions about how often you'll lose. They're circuit breakers that stop one poor session, emotional spiral, or cluster of correlated trades from becoming an account-level event.
Scale according to evidence
Your strategy's expected edge is never known with certainty. Win rate and payoff ratio are estimates, and those estimates can be especially unstable when they come from a small or regime-specific sample. Size should reflect that uncertainty.
Use a simple confidence ladder:
- Unproven setup: Trade the smallest practical quantity while collecting consistent records.
- Unstable evidence: Reduce risk when recent performance changes sharply or the market no longer resembles the tested conditions.
- Correlated exposure: Combine open risk across positions before approving another entry.
- Approaching drawdown limit: Cut size or pause the strategy until you identify the cause.
- Meaningful improvement: Restore size gradually rather than jumping back to the previous level.
The phrase “meaningful improvement” matters. A short winning streak doesn't prove that the edge has strengthened. Restore size after reviewing a sufficiently broad record and confirming that execution, market conditions, and strategy behavior have improved together.
Later in the process, position management determines whether the original risk plan survives contact with the market. Rules for moving stops, taking partial profits, and holding through volatility should be written before the trade, not improvised after price moves. A structured guide to position management can support that part of the process.
This video can serve as a practical supplement while you build the rule set:
The strongest framework is usually the one you can follow during a losing period. If a rule depends on confidence, excitement, or a belief that the next trade will recover the last one, it isn't a risk rule. It's a prediction disguised as discipline.
Common Position Sizing Mistakes and How to Avoid Them
The most damaging sizing errors rarely come from not knowing the formula. Traders usually know the formula. They abandon it when emotion, recent results, or a compelling setup makes larger exposure feel justified.
Mistake one is sizing up after winning
Three wins can make a trader believe the strategy has entered a special phase. The next position becomes larger, not because the evidence improved, but because confidence did.
That change creates poor timing risk. A normal losing trade after the winning streak now carries more damage, and the trader may respond by increasing size again to recover. The correction is mechanical: define scaling conditions before the session begins, and don't change quantity because the last few trades were profitable.
Sizing should respond to tested evidence and account rules, not to how certain the current setup feels.
Mistake two is trusting backtested precision
An equity curve can show a smooth sequence of historical outcomes. It can't guarantee the same fills, volatility, liquidity, or market regime in the future. A backtest that uses the planned stop as the realized exit may understate the effect of slippage and gaps.
Use backtests to understand behavior, not to manufacture certainty. Record adverse excursions, execution differences, correlated losses, and periods when the setup becomes less reliable. Then use those observations to shape the scenario band and the drawdown rule.
Mistake three is treating correlated trades as separate bets
A trader may hold several positions that appear different on the chart but depend on the same market condition. A broad risk-off move, currency shock, or sector reversal can hit them together.
Before opening another position, group existing trades by their primary driver. If the new setup adds to the same exposure, reduce its size or reject it. The account experiences the combined loss, not the labels attached to each chart.
Mistake four is using tight stops to justify oversized positions
A narrow stop reduces the calculated loss per unit, so the formula permits more units. That doesn't make the trade safer if the stop sits inside normal noise or if a small gap creates a much larger exit loss.
Place the stop where the trade thesis fails, then size the position around that distance. If the resulting quantity is too small or the stressed scenario is unacceptable, pass on the trade. A poor fit between account risk and market structure is a reason to wait, not a reason to force risk.
Mistake five is revenge sizing
After a loss, traders often want the next position to repair the account immediately. That impulse turns a single controlled error into a sequence of decisions made under pressure. The rule should be automatic: after a loss, calculate the next position from the same current equity and scenario assumptions, without adding a recovery premium.
Use this pre-trade checkpoint:
- Structure: Is the stop beyond genuine invalidation rather than ordinary noise?
- Execution: What could happen if liquidity worsens or price jumps?
- Concentration: Would this trade duplicate an existing market exposure?
- Drawdown: Can the account withstand the normal, stressed, and gap scenarios?
- Emotion: Am I sizing from a rule, or trying to prove something after the last trade?
Position sizing in trading becomes reliable when the decision is boring. You know the risk before the entry, accept that the stop can fail to execute as planned, and refuse to let a winning streak or losing trade rewrite the rules.
Colibri Trader offers price-action education, money-management guidance, and tools such as a position-size calculator to help traders connect stop placement with controlled exposure. Visit Colibri Trader to build a more disciplined process before you increase your trade size.