Turtle Trading Rules – Is This Strategy Still Working?
Turtle trading rules what 🤷🏽
Have you ever wondered if SUCCESSFUL traders are born or made?
You’re not alone; even those who already “made it” still tried to figure out such a NATURE vs. NURTURE mystery.
In the 1980s, two multimillionaire traders, Richard Dennis and William Eckhardt, conducted what is known as The Turtle Experiment 😮
The idea was to pick a group of people and teach them a WINNING trading system.
Richard Dennis would compare the apprentices’ development to 🐢TURTLES in the turtle-breeding farm in Singapore, thus the experiment’s name.
Then the traders were assigned to MANAGE the fund, following the SYSTEM they’ve learned.
The experiment succeeded – the fresh fund managers MULTIPLIED the initial capital manifold🚀
If some people who started from zero but followed the right approach could succeed, why wouldn’t you?
Isn’t it encouraging?
Let’s look at the turtle trading rules and find out how actual they are today.
Contents in this article
The original turtle trading rules
The core concept of the strategy is entering the market at the VOLATILITY SPIKE and riding the trend as it lasts.
Risk management is based on market volatility, while aggressive SCALING-IN is also employed.
Initially, the specific turtle trading rules were kept 🤫SECRET according to the non-disclosure agreement the “turtles” have signed.
How did it leak then?
After the contract expired, the rules were REVEALED to the public; you can find all details about the strategy here.
Let’s look at the core rules and how to execute the system in live market conditions👇🏽
The List of Rules
Any system includes exact conditions for entries, loss cutting, and locking-in profit exits. Also, we must be clear about the MARKETS traded and the POSITION size applied for each trade.
Below are these elements in turtle trading rules.
Position sizing
Here’s the system foundation – how much we bet.
TURTLE TRADING RULES OPERATE BET SIZES IN TERMS OF UNITS!
One unit is 1% of account equity represented by 20-day ATR.
So, when we say “ADD ONE UNIT” we go long or short the lot size derived from current volatility. The lot size necessitates the stop loss 20-day ATR away from the entry, yet not risking more than 1% OF EQUITY.
Below is the FORMULA👇🏽

And here’s the visual EXAMPLE

In S&P 500, a single point equals 1.0 USD, so the ATR shows daily dollar volatility – 120.8 in our case.
Fortunately, we can get ATR values by simply plotting the indicator on the chart.
Turtles didn’t really have such a luxury.
Entries
A trader buys when the market makes a new 20-day high (the price upticks HIGHER than the previous 20 days).
Here is an example.

PRO TIP: If the last trade in the same instrument had been a winner, we would skip the 20-day breakout. Instead, we wait for a longer-term 55-day breakout to enter again.
Usually, the longer the signal timeframe, the higher the WIN RATE we can expect.
The odds of being right from the start are FADING as the market advances in the direction of the last entry.
Thus, we need more time to validate a brand-new entry in an already extended trend.
Unlike the 20-day breakout, we don’t need to skip the 55-day one if we’ve had a winning setup in it previously.
The logic behind the SHORT TRADES is the same.
Exits
There are two objectives to close the position: limit losses or lock-in profits.
How do we LIMIT LOSSES 🤔?
We set a stop loss 2ATRs away from the entry.
Turtles traded on daily charts, so the ATR would be the AVERAGE DISTANCE the market moves in one day.
Let’s look at the example of 2ATRs stop loss.

The previous day’s ATR is 53.1, so the 2ATR stop would be 53.1*2=106.2 points away from the entry.
Regarding protecting profits, turtle trading rules use a 10-day trailing stop for 20-day breakout entries.
If we are long, we will sell when we see a print BELOW the lowest price for the last ten days.
This is how it looks👇🏽

What an ugly whipsaw on December 21st!
Be ready to encounter such things; the market can be pretty nasty at times.
For 55-days entries, the 20-day trailing stop is applied.
The exits from the short-sell trades work vice-versa.
Scaling in
Most traders are fearful when they’re supposed to be hopeful and vice-versa.
Such behavior is manifested in the way traders manage positions.
People place an unreasonable amount of hope in a trade that is OUT OF MONEY.
On the contrary, when things go well, most are 😰AFRAID of losing unrealised profit.
That’s one of the reasons most traders aren’t profitable.
Turtle trading rules address the issue by CUTTING LOSSES when the trade is OBJECTIVELY not working out.
However, we ADD TO the position when the market goes in a trader’s favour.
How exactly 🤔 ?
First, we open a one-unit trade.
We add another unit after the market moves in our favour a half of the distance to the initial stop-loss.
The next chart will help you to visualize it.

The RED ARROW shows the distance to the initial 2ATR stop loss (18.5*2=37 points away from the entry).
We ADD another unit once the market moves half that distance in our favour (see the GREEN arrow).
The scaling-in continues until the four units ceiling.
How to manage stops in multiple units?
Do you remember that we must maintain the 2% risk for the ENTIRE POSITION at any time?
Thus, when adding new units, we MOVE UP the stops for earlier ones.
Makes sense?
The average stop for the entire position consisting of all units must still be 2% AWAY from the market price.
Traded markets
Turtles traded futures on COMMODITIES, INTEREST RATES, BONDS, and CURRENCIES.

Note that some currencies like Deutschmark or French Franc aren’t available anymore.
It’s understandable why individual STOCKS are avoided: it’s difficult to track them due to enormous quantities.
Also, stocks tend to be radically affected by earnings reports, GAPPING🚀 in either direction that makes risk management a challenge.
On the contrary, FUTURES usually trend more consistently.
On the risk management side, turtle trading rules address markets correlation.
As we know, in a single market, the size limit is four units.
In closely and loosely CORRELATED markets (see more details here), the maximum is 6 and 10 units, respectively.
In all markets, the total units in one direction (long or short) CAN’T EXCEED 12 units.
Turtle trading rules profitability consensus
One of the big advantages of the turtle strategy is the ease of AUTOMATION.
Naturally, many enthusiasts created trading algorithms to backtest the system’s profitability in today’s markets.
Try googling the results of such backtests.
Whaaaaat? 😮
Many sources reveal not exciting results of the original rules applied to the 5-20 years of the 21st century.
Did the system BREAK DOWN😩?
Even though the original parameters aren’t as profitable anymore, it doesn’t mean the strategy concept stopped working.
The markets still trend; the breakouts still happen, and the MATH behind volatility stop never lost sense.
The general findings show that the results improve if we FILTER the entries more, taking only the long-term ones.
For example, instead of entering at a 20-day high, FOCUS on 55-day ones only, or EVEN TRY 200-day breakouts.
The risk can also be more conservative, keeping the exposure under 1% – this way, the drawdowns can be smaller.
The importance of the proper risk management
Even a positive expectancy system can still let you go broke if the risk per trade is too high.
Turtle trading rules involve a MAXIMUM of 2% risk exposure, which is pretty high.

Over the big sample of trades, the difference between drawdowns will be significant if we bet 2% vs., say, 1%.
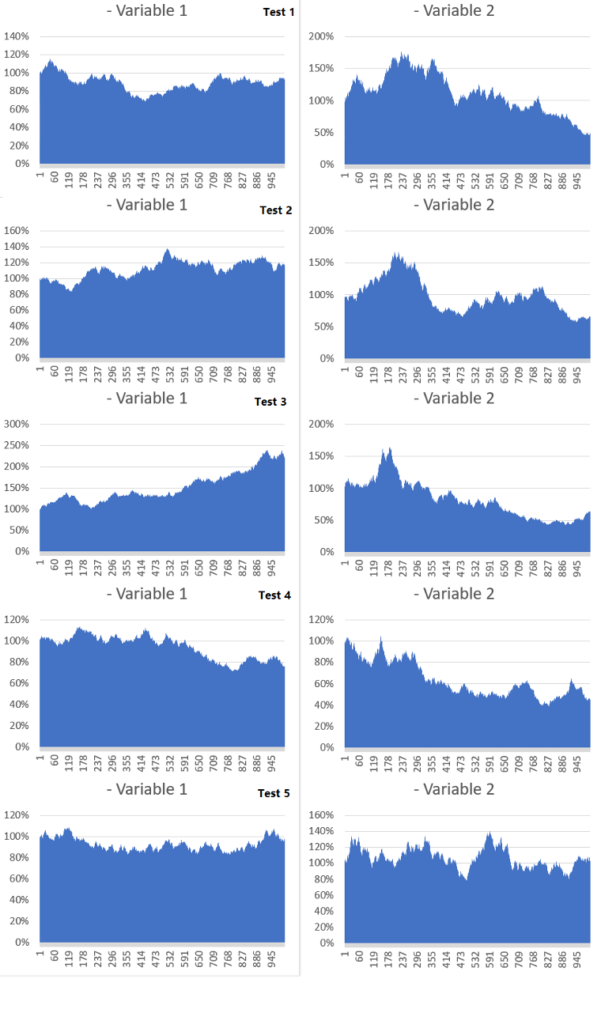
Here’s an experiment: we model a 🪙 COIN flipping, betting on a random side with constant percentage risk.
Variable 1 represents the 1% risk, while in Variable 2, the risk is 2%.
Let’s make 1000 flips five times and see how the balance changes.

Throughout five tests, the 2% bet underperformed 4 out of 5 attempts.
Although the results aren’t an exact representation of the live performance of the strategy, you can see the clear tendency.
If you randomly bet 1%, it’s challenging to go in a drawdown of over 30%.
On the other hand, the drawdown of over 50% is quite common for the 2% risk systems.
Why did turtle trading rules stop working?
The markets constantly change, making strategies with fixed parameters not as effective as once they’ve been.
Turtle trading rules aren’t an exception: the markets became CHOPPIER over the years, necessitating more careful entry filtering.
The reasons may be due to the lower barrier of entry to the markets and overall bigger access to the information.
Why do those cause choppiness?

Think about it, more market PARTICIPANTS with more information available translates into plenty of possible diverging opinions.
The more bulls and bears disagree the less clear further price direction.
Conclusion
The turtle trading experiment proved that anybody could be CONSISTENTLY profitable with the right approach and perfect execution.
Although the exact parameters of turtle trading rules aren’t likely to work nowadays, you can tweak them here and there.
Which ones exactly?
The strategy elements like entry trigger timeframe and maximum risk exposure today should overall be more conservative to stay profitable.
Remember not to focus too much on the exact parameters because they are more likely to become OBSOLETE as markets evolve.
Instead, focus on the strategy concept – if you see the LOGIC behind it, there’s no problem adapting secondary details.

Happy Trading,
Colibri Trader
P.S.
Did you check out my article on 👉🏽 How To Profit With These 7 Pullback Strategies?


