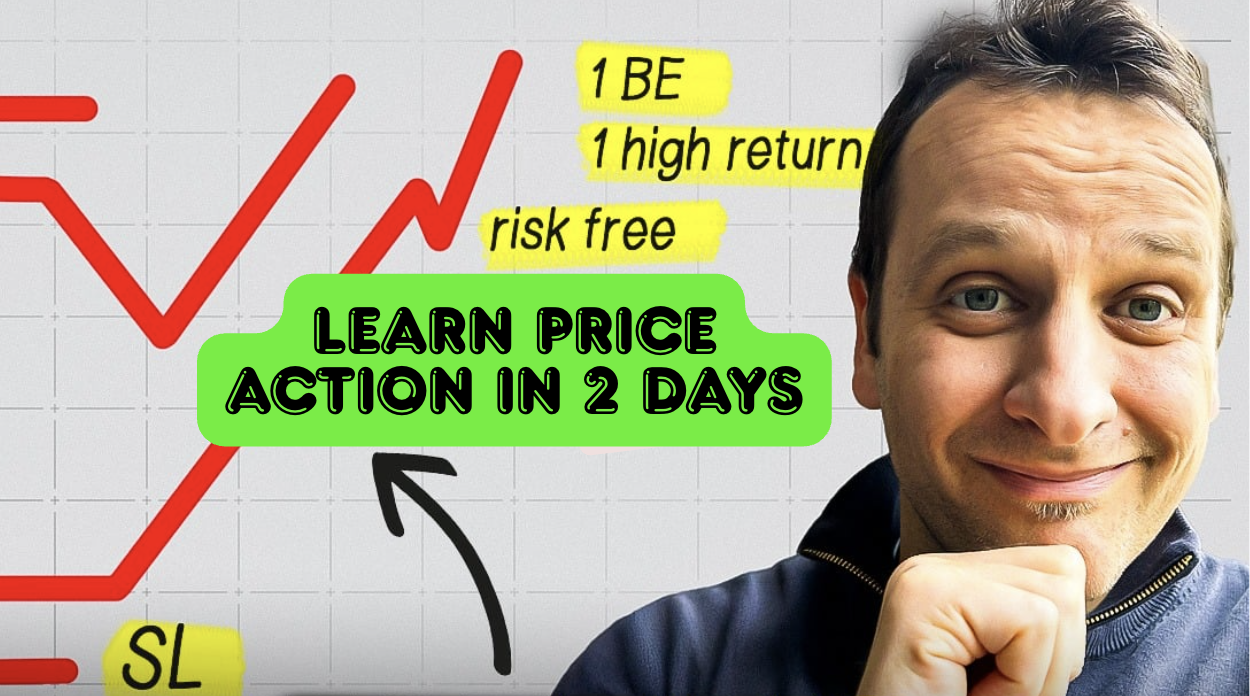
6 Essential Price Action Trading Patterns for 2025

Decoding the Charts: Price Action Essentials
Forget cluttered charts filled with confusing indicators. Price action trading focuses on interpreting market sentiment and potential movements directly from the price bars themselves—a core philosophy at Colibri Trader. This guide gets straight to the point, introducing 6 fundamental price action trading patterns. You will learn to identify and understand the Pin Bar, Inside Bar, Engulfing pattern, Double Top/Bottom, Head and Shoulders, and Rectangle consolidation patterns. Mastering these visual cues is crucial for building a clean, effective trading approach and provides a solid foundation for developing indicator-free strategies for 2025. Let’s decode the charts.
1. Pin Bar Pattern
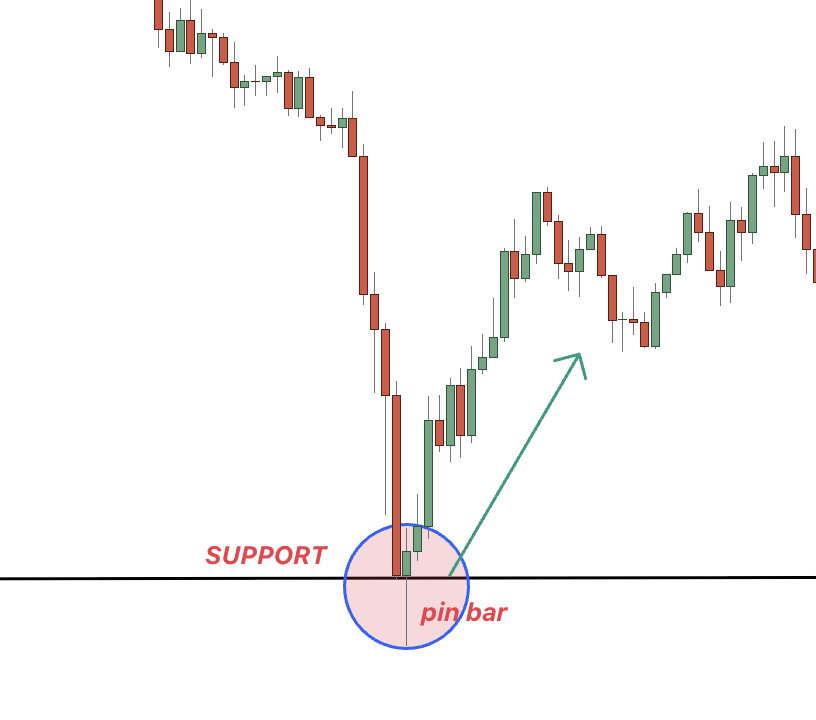
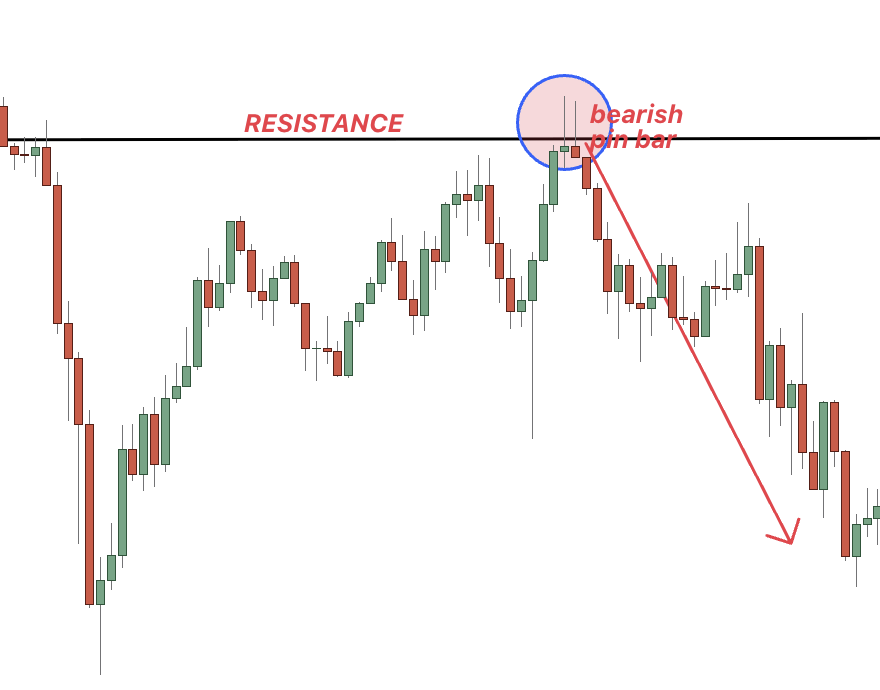
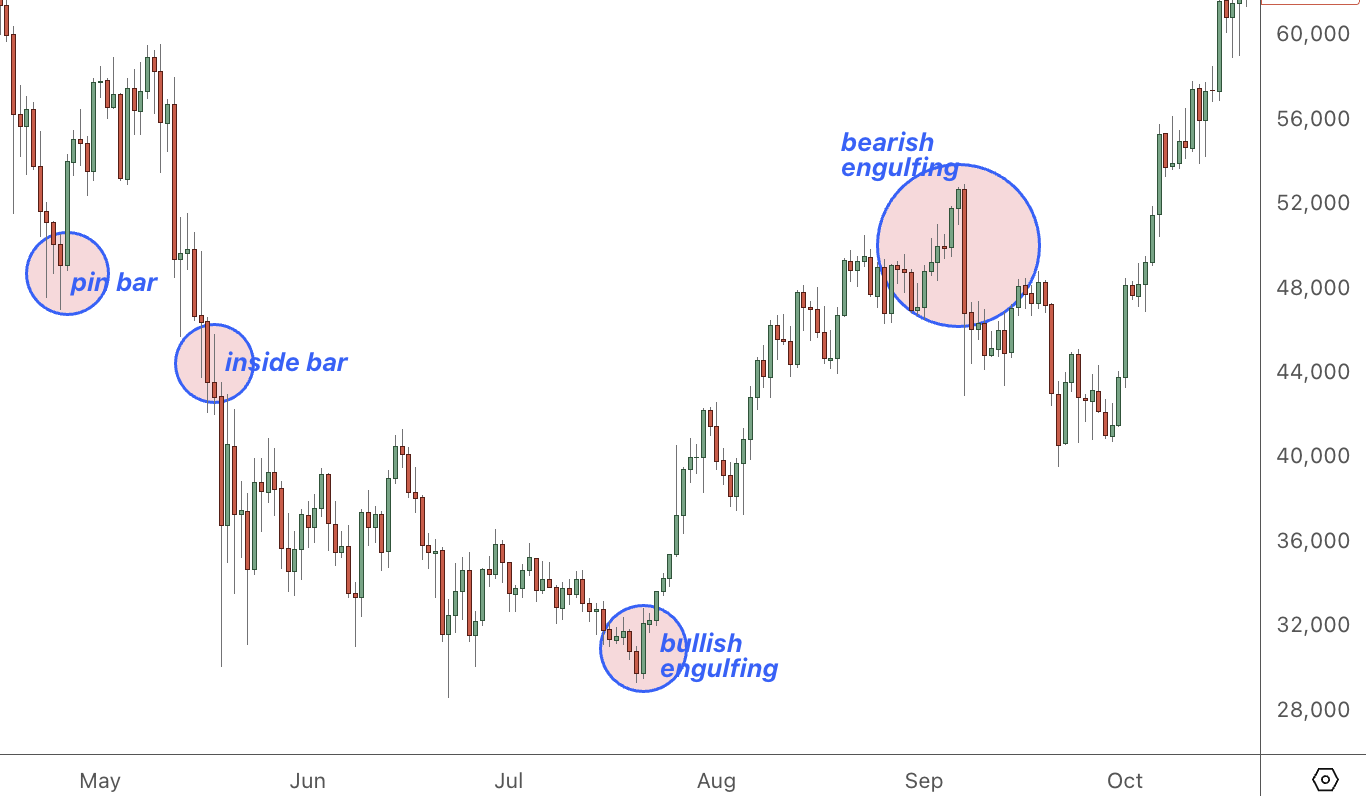
Kicking off our list of essential price action trading patterns is the highly regarded Pin Bar. This pattern is a cornerstone for many traders due to its simplicity and the powerful market sentiment it reveals. The Pin Bar pattern consists of a single candlestick characterized by a long wick (also known as a shadow or tail) and a small real body. Its appearance often resembles a pin or a hammer, hence the name. The significance of the Pin Bar lies in its ability to signal price rejection at a specific level, frequently indicating a potential reversal of the current market direction.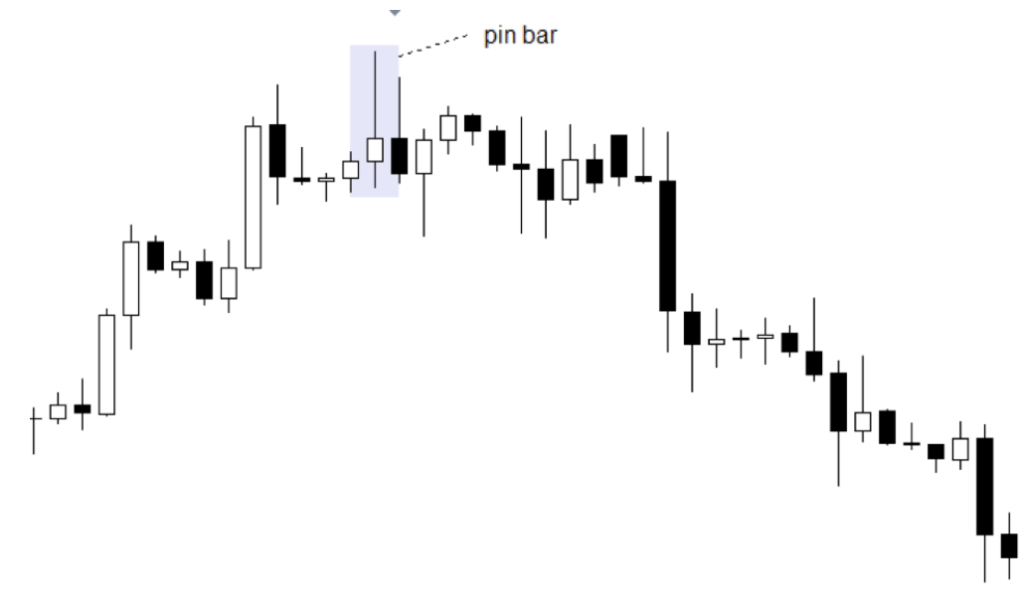
How the Pin Bar Works:
The Pin Bar tells a story about the battle between buyers and sellers within a single trading period. The long wick represents a significant price excursion that was ultimately rejected. For instance, in a bullish Pin Bar (often looking like a hammer), price initially moved much lower, but buyers stepped in forcefully, pushing the price back up to close near the high of the period. This indicates that sellers attempted to drive the price down but failed, and buying pressure dominated by the end of the session. Conversely, a bearish Pin Bar (often resembling a shooting star) shows that price initially rallied higher, but sellers took control, pushing the price down to close near the low. This signals a rejection of higher prices. The small real body, located at one end of the candle, shows that the opening and closing prices were relatively close, reinforcing the idea of indecision followed by a decisive rejection.
Why It Deserves Its Place:
The Pin Bar earns its spot high on this list because it’s one of the most visually distinct and frequently occurring price action trading patterns. Its strength lies in clearly showing a rejection point, providing traders with a potential edge when identified in the right context. It’s a fundamental pattern applicable across various markets (Forex, stocks, commodities, crypto) and timeframes.
Key Features:
- Long Wick/Tail: The most prominent feature, extending significantly in one direction (up or down). This wick should ideally be at least twice the length of the real body. It points away from the direction of the anticipated move (e.g., a long lower wick suggests a potential upward move).
- Small Real Body: The difference between the open and close price is small relative to the wick’s length.
- Body Location: The real body is located at the opposite end of the candle from the long wick.
- Context is Crucial: Pin Bars are most reliable when they form after a sustained move (uptrend or downtrend) and appear at key technical levels like support, resistance, trend lines, Fibonacci levels, or moving averages.
Pros:
- Easy Identification: Relatively simple to spot on a price chart, even for novice traders.
- Clear Entry & Stop-Loss: Provides logical points for trade entry (e.g., breaking the high/low of the Pin Bar) and stop-loss placement (beyond the tip of the long wick).
- Strong Rejection Signal: Often indicates a forceful rejection of price, potentially leading to significant market moves if the rejection holds.
- Combinable: Works well in conjunction with other technical analysis tools for added confirmation, increasing trade probability.
Cons:
- False Signals: Can generate false signals, especially in choppy, sideways, or low-volatility markets where price rejection doesn’t necessarily lead to a sustained move.
- Context Dependency: Effectiveness heavily relies on where it forms. A Pin Bar in the middle of nowhere carries less weight than one at a key level.
- Requires Confirmation: Often prudent to wait for confirmation from the next candle or other indicators before entering a trade.
- Risk-Reward Management: The long wick means the stop-loss distance can be considerable, requiring careful position sizing to maintain a favorable risk-reward ratio.
Successful Implementation Examples:
- Bullish Reversal: After a clear downtrend, price hits a known horizontal support level or an upward-sloping trend line. A Pin Bar forms with a long lower wick testing and rejecting this level, closing near its high. Traders might enter long on a break above the Pin Bar’s high, anticipating a move up.
- Bearish Reversal: Following a strong uptrend, price reaches a significant resistance zone. A Pin Bar appears with a long upper wick showing rejection of higher prices, closing near its low. Traders could enter short on a break below the Pin Bar’s low, targeting lower levels.
- Real Market Example: On the EUR/USD daily chart dated September 20, 2022, a prominent bearish Pin Bar formed right at the 1.0050 psychological resistance level after a rally. This rejection signaled strong selling pressure, and the price subsequently declined significantly, offering over 300 pips of movement downwards in the following days.
Actionable Tips for Traders:
- Wait for the Close: Always wait for the candlestick to fully close before confirming it as a Pin Bar. Price can change dramatically within the last few moments of a candle’s formation.
- Wick-to-Body Ratio: Look for Pin Bars where the wick is significantly longer than the body, ideally at least 2:1 or preferably 3:1. The longer the rejecting wick, the stronger the signal.
- Stop-Loss Placement: A common practice is to place the stop-loss just beyond the tip of the long wick (e.g., 10-20 pips beyond).
- Seek Confluence: Increase the probability of success by trading Pin Bars that form at the confluence of multiple technical factors (e.g., support/resistance + moving average + Fibonacci level).
- Consider the Trend: Pin Bars occurring with the prevailing long-term trend (e.g., a bullish Pin Bar pullback to support in an overall uptrend) are generally considered higher probability trades than counter-trend signals.
- Market Context: Assess the overall market environment. Is it strongly trending, ranging, or volatile? This context impacts the reliability of the pattern.
The Pin Bar pattern has been widely discussed and utilized by prominent figures in the trading world, including candlestick analysis pioneer Martin Pring and renowned price action experts like Al Brooks and Lance Beggs. Its enduring popularity stems from its effectiveness in visually capturing critical turning points in the market. For those looking to master price action trading patterns, understanding the nuances of the Pin Bar is fundamental.
To delve deeper into identifying and trading this specific setup, you can Learn more about Pin Bar Pattern and how it integrates into a broader trading strategy in our Price Action Pro course HERE.
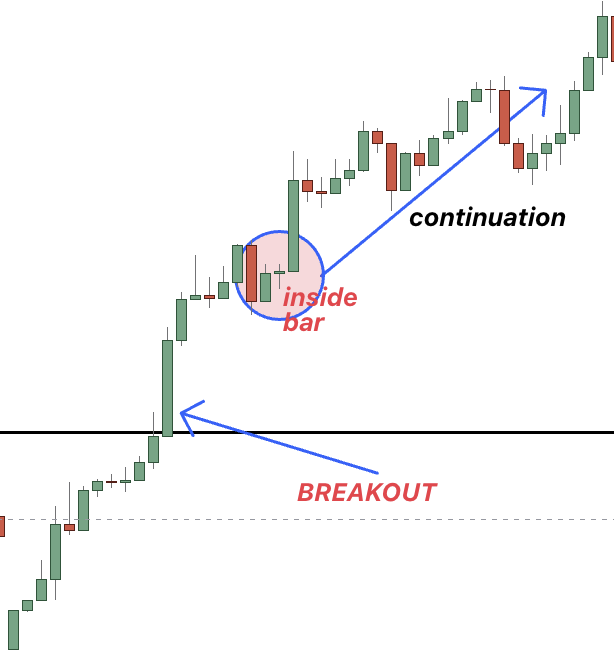
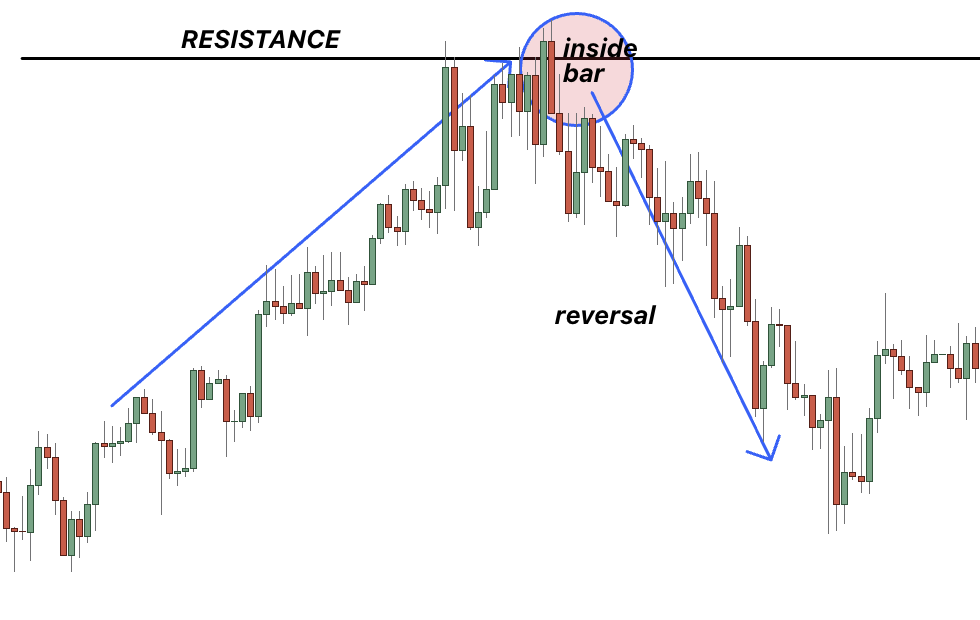
2. Inside Bar Pattern
The Inside Bar pattern is a highly regarded formation within the world of price action trading patterns. It signals a temporary pause or consolidation in the market and consists of at least two candlesticks. The key characteristic is that the second candle (and potentially subsequent candles) has a high that is lower than the high of the preceding candle, and a low that is higher than the low of the preceding candle. Essentially, the entire price range of the inside bar(s) is contained within the high-low range of the initial, larger bar, often referred to as the “Mother Bar”. This pattern visually represents a decrease in volatility and market indecision, often coiling energy before a potential significant move or breakout.

How it Works
The Inside Bar pattern works by highlighting a moment of equilibrium or contraction after a period of expansion (represented by the Mother Bar). The Mother Bar shows the range the market traded during its period, while the subsequent Inside Bar(s) show the market trading within a tighter range, unable or unwilling to push beyond the Mother Bar’s extremes. This consolidation indicates that neither buyers nor sellers are in dominant control at that moment. However, this pause is often temporary. Traders watch this pattern because this tightening range frequently precedes a volatility expansion – a breakout. The direction of this breakout can lead to either a continuation of the prior trend or a reversal.
Features:
- Mother Bar: A relatively large candlestick establishing the high-low range.
- Inside Bar(s): One or more subsequent candles whose highs are below the Mother Bar’s high and whose lows are above the Mother Bar’s low.
- Consolidation Signal: Clearly indicates a temporary pause and decrease in volatility.
- Potential Breakout: Suggests stored energy that is likely to release in a directional move.
- Multiple Inside Bars: Sometimes, several consecutive inside bars can form within the Mother Bar’s range, indicating stronger consolidation.
Why it Deserves its Place
The Inside Bar pattern earns its spot in any essential list of price action trading patterns due to its frequency, clarity, and versatility. It’s a simple pattern to identify across all timeframes and markets (forex, stocks, commodities, crypto). Its structure provides objective levels for trade entries and stop-loss placement, making it a practical tool for managing risk. For traders learning to read market sentiment directly from price charts, the Inside Bar offers clear insight into periods of indecision and potential turning points or continuations.
When and Why to Use This Approach
The Inside Bar pattern is best used in specific contexts:
- Trend Continuation: When an Inside Bar forms during a clear uptrend or downtrend, it often signals a brief pause before the trend resumes. Trading the breakout in the direction of the prevailing trend is generally considered a higher probability setup. You use it here to catch the next leg of the existing move after a minor consolidation.
- Potential Reversals: When an Inside Bar forms near a significant support or resistance level, or after a very extended move, it can sometimes signal an impending reversal. A breakout against the recent trend from a key level might indicate a shift in market control. Use it cautiously here, often requiring additional confirmation.
- Breakout Strategies: Traders use the Inside Bar specifically to capture the volatility expansion that often follows the consolidation period. The defined range of the Mother Bar provides clear levels to place entry orders just outside its boundaries.
The why behind using it centers on its ability to offer well-defined risk-reward scenarios. The consolidation period allows traders to enter a potential move early, just as momentum picks up, with a logical stop-loss level (typically beyond the opposite end of the Mother Bar).
 “
“
Description: This chart shows a clear uptrend, followed by a large bullish candle (Mother Bar), then a smaller candle fully contained within the Mother Bar’s range (Inside Bar). The subsequent candle breaks above the Mother Bar’s high, and the price continues to move upwards.
Benefits (Pros):
- Clearly Defined Levels: The high and low of the Mother Bar provide obvious points for entry triggers and stop-loss placement.
- Versatility: Effective in both trending and (with caution) ranging markets, and applicable across all financial instruments and timeframes.
- Favourable Risk-to-Reward: When a breakout occurs, the potential move can be significantly larger than the risk defined by the Mother Bar’s range, allowing for excellent R:R ratios.
- Easy Identification: The visual pattern is straightforward to spot on a price chart, even for novice traders.
Drawbacks (Cons):
- No Inherent Direction: The pattern itself signifies consolidation, not the direction of the breakout. Context (trend, key levels) is crucial.
- False Breakouts: Price may briefly break beyond the Mother Bar’s range only to reverse quickly, triggering entries into losing trades (whipsaws), especially in choppy or ranging conditions.
- Patience Required: Multiple inside bars can form consecutively, delaying the breakout and requiring traders to wait patiently or adjust their orders.
- Reduced Effectiveness in High Volatility: During major news events or periods of extreme, erratic volatility, the pattern’s reliability can decrease as ranges can expand and contract rapidly without clear follow-through.
Examples of Successful Implementation:
- GBP/USD 4-Hour Chart: Following a sustained rally (uptrend), the pair formed a distinct Mother Bar followed by an Inside Bar. Traders anticipating continuation placed buy-stop orders above the Mother Bar’s high. The price broke upwards, triggering the orders, and the bullish trend continued, yielding profits.
- Daily Crude Oil Futures: At a historically significant resistance level, Crude Oil printed a large bearish Mother Bar followed by an Inside Bar. This signaled indecision at resistance. Traders looking for a reversal placed sell-stop orders below the Mother Bar’s low. The price subsequently broke down sharply, confirming the resistance and leading to a significant bearish move.
- Apple (AAPL) Stock: Before a major earnings announcement, AAPL stock formed an Inside Bar on the daily chart, indicating uncertainty among traders. After the earnings release, the stock gapped significantly higher, breaking well above the Mother Bar’s high, rewarding those positioned for a bullish surprise.
 “
“
Description: This chart depicts price approaching a known resistance zone. A large candle (Mother Bar) touches the resistance, followed by a smaller Inside Bar. The next candle breaks decisively below the Mother Bar’s low, initiating a bearish move away from the resistance level.
Actionable Tips for Readers:
- Trade with the Trend: Prioritize trading Inside Bar breakouts in the direction of the established market trend for higher probability setups.
- Entry Placement: Place buy-stop orders a few pips/points above the Mother Bar’s high (for long trades) or sell-stop orders a few pips/points below the Mother Bar’s low (for short trades). Avoid placing orders exactly at the high/low to reduce the chance of being triggered by minor noise.
- Stop-Loss Placement: Set your initial stop-loss order just beyond the opposite end of the Mother Bar. For a long entry, the stop goes below the Mother Bar’s low; for a short entry, it goes above the Mother Bar’s high.
- Multi-Timeframe Analysis: Check higher timeframes (e.g., daily if trading on the 4-hour) to confirm the overall trend direction and identify major support/resistance levels that might influence the breakout.
- Context is Key: Be extra cautious with Inside Bars forming in very choppy markets or directly at major support/resistance levels without a clear preceding trend – these are more prone to false breakouts.
- Volume Confirmation: Ideally, look for volume to decrease during the formation of the Inside Bar(s) and then increase significantly on the breakout candle. This suggests conviction behind the move.
Popularized By:
While candlestick patterns, including variations of inside bars, have been observed for centuries (notably by Japanese rice traders like Munehisa Homma), modern emphasis on the Inside Bar as a core price action trading pattern has been championed by educators like Nial Fuller, who focuses heavily on simple price action signals. Steve Nison is renowned for bringing Japanese candlestick charting, including patterns that encompass the Inside Bar concept, to the Western world. Trading psychologist Mark Douglas also emphasized the importance of recognizing such patterns as objective signals within a trader’s methodology, helping to manage emotional decision-making.
By understanding the structure, context, and risk management principles associated with the Inside Bar, traders can add a powerful tool to their arsenal of price action trading patterns.
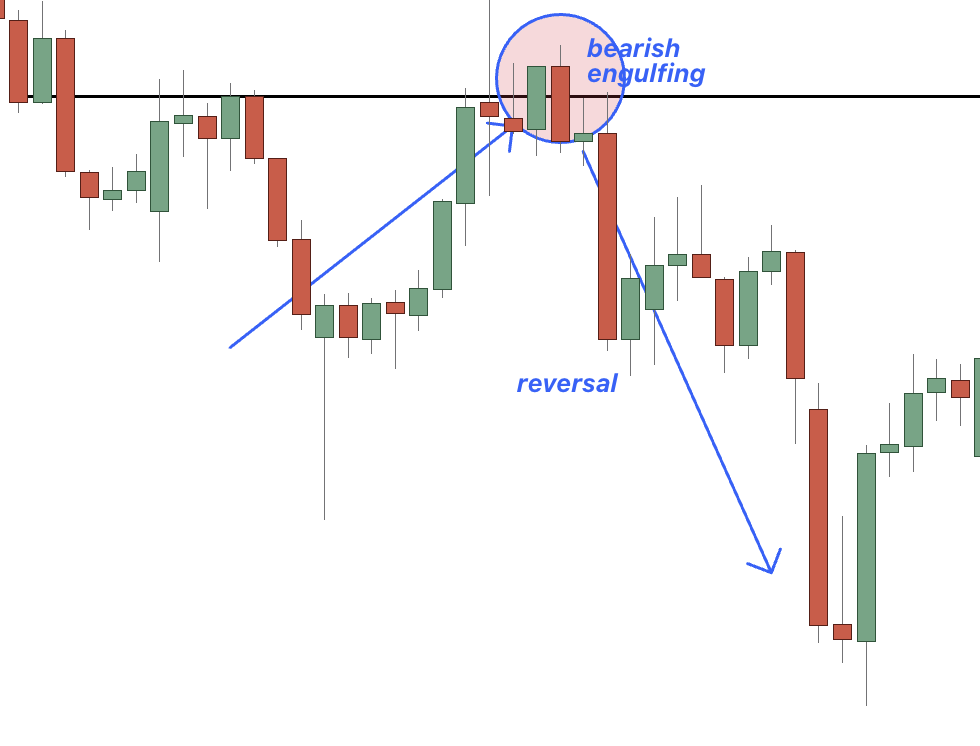
3. Engulfing Pattern
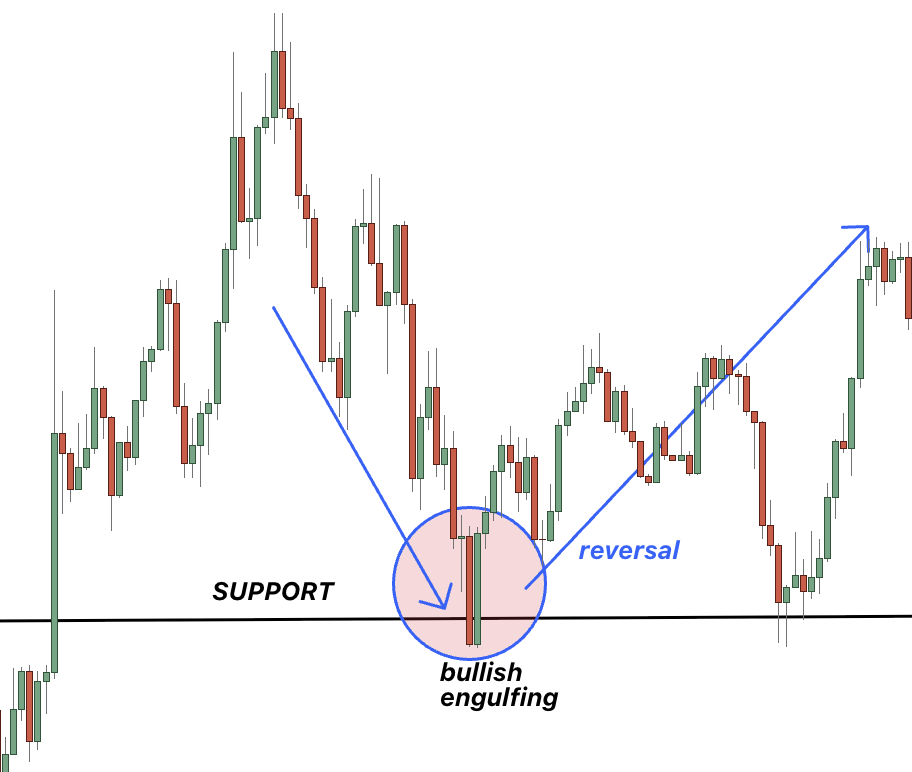
The Engulfing pattern stands as one of the most visually striking and psychologically significant signals within the realm of price action trading patterns. It’s a potent two-candle reversal pattern that signals a potential shift in market direction after a defined trend. Its power lies in its clarity: the second candle in the pattern completely ‘engulfs’ or overlaps the real body (the difference between the open and close price) of the preceding candle. This dramatic takeover visually represents a decisive change in market sentiment and control.

How it Works: The Mechanics of Reversal
The Engulfing pattern unfolds over two consecutive trading periods (candles):
- The First Candle: This candle typically follows the direction of the prevailing trend. In an uptrend, it’s usually a green (bullish) candle; in a downtrend, it’s typically a red (bearish) candle. Its size is often relatively modest compared to the engulfing candle that follows.
- The Second (Engulfing) Candle: This candle is the star of the pattern. It must have a body of the opposite color to the first candle. Crucially, its body must completely engulf the body of the first candle. This means its opening price is lower than the previous candle’s closing price, and its closing price is higher than the previous candle’s opening price (for a Bullish Engulfing), or vice versa for a Bearish Engulfing. While the wicks (highs and lows) don’t necessarily need to be engulfed, the engulfment of the real body is the defining feature.
There are two primary types:
- Bullish Engulfing: Occurs after a downtrend. A smaller red (bearish) candle is followed by a larger green (bullish) candle whose body completely engulfs the red candle’s body. This suggests that buyers have aggressively stepped in, overpowering the sellers and potentially initiating an upward reversal.
- Bearish Engulfing: Appears after an uptrend. A smaller green (bullish) candle is followed by a larger red (bearish) candle whose body completely engulfs the green candle’s body. This indicates that sellers have taken decisive control from the buyers, hinting at a potential downward reversal.
Why This Pattern Deserves its Place
The Engulfing pattern is a cornerstone of price action trading patterns for several reasons:
- Strong Psychological Signal: It visually depicts a rapid and forceful shift in market control. The larger the engulfing candle, the more decisive the shift appears.
- High Recognition: It’s relatively easy to spot on charts across any market (stocks, forex, commodities, crypto) and timeframe (from minutes to months).
- Actionable Information: The pattern provides clear potential entry points (often near the close of the engulfing candle or on a slight pullback), logical stop-loss placement (beyond the high/low of the engulfing pattern), and helps define potential take-profit targets based on subsequent price action or key levels.
Key Features and Benefits:
- Feature: Two-candle pattern with opposite-colored bodies.
- Benefit: Simple structure, easy to identify.
- Feature: Second candle’s body completely engulfs the first candle’s body.
- Benefit: Clear visual confirmation of a shift in momentum.
- Feature: Appears after a defined trend.
- Benefit: Acts as a potential reversal signal, offering opportunities to enter near the start of a new trend.
- Feature: Most potent at key Support/Resistance levels.
- Benefit: Increases the probability of the signal being valid when it forms at historically significant price points.
- Feature: Often accompanied by higher volume on the engulfing candle.
- Benefit: Increased volume adds conviction to the pattern, suggesting strong participation in the reversal.
When and Why to Use the Engulfing Pattern
The optimal time to utilize the Engulfing pattern is:
- After a Sustained Trend: Its primary function is as a reversal signal. Look for it after a clear uptrend (for Bearish Engulfing) or downtrend (for Bullish Engulfing). It’s less reliable in choppy, sideways markets.
- At Significant Price Levels: Its predictive power increases substantially when it forms at established support levels (for Bullish Engulfing) or resistance levels (for Bearish Engulfing), trend lines, or major Fibonacci retracement levels.
The “why” is rooted in market psychology. A Bullish Engulfing after a downtrend shows that sellers were in control (small red candle), but then buyers entered with such force (large green candle) that they not only negated the previous period’s selling pressure but established a significantly higher closing price, engulfing the prior candle. This demonstrates a potential exhaustion of sellers and a powerful resurgence of buyers. The opposite logic applies to the Bearish Engulfing pattern.
Pros and Cons:
Pros:
- ✅ Strong visual representation of a shift in market control.
- ✅ Easily identifiable across various markets and timeframes.
- ✅ Provides relatively clear entry, stop-loss, and initial target parameters.
- ✅ Generally considered to have a higher probability of success compared to single-candle patterns, especially with confirmation.
Cons:
- ❌ Can generate false signals, particularly in non-trending or volatile, choppy market conditions.
- ❌ Less reliable if not formed after a clear trend or at a significant technical level.
- ❌ Often requires confirmation from the next candle or other technical indicators.
- ❌ A very large engulfing candle can create a wide stop-loss distance, potentially affecting the risk-reward ratio unfavorably.
Actionable Tips for Trading the Engulfing Pattern:
- Context is King: Always analyze the preceding trend. An engulfing pattern is strongest after a prolonged move. Avoid trading it in tight consolidation ranges.
- Seek Confirmation: Wait for the next candle to close. A confirmation candle closing in the direction of the reversal (e.g., another green candle after a Bullish Engulfing) strengthens the signal. Alternatively, use indicators like RSI divergence or MACD crossovers.
- Location, Location, Location: Prioritize patterns forming at key support (for bullish) or resistance (for bearish) levels. These zones act as natural battlegrounds where reversals are more likely.
- Size Matters: The larger the engulfing candle relative to the preceding candles, the more significant the potential reversal. A massive engulfing candle shows greater conviction.
- Volume Validation: Check the volume on the engulfing candle. Higher-than-average volume suggests stronger participation and adds validity to the pattern.
- Manage Risk: Place your stop-loss just beyond the high (for Bearish Engulfing) or low (for Bullish Engulfing) of the engulfing candle itself (or the two-candle pattern).
- Consider Partial Entries: Instead of entering a full position immediately, consider entering partially on the pattern’s formation and adding the rest upon confirmation (e.g., break of the engulfing candle’s high/low).
Real-World Examples & Popularization:
The effectiveness of the Engulfing pattern is observed frequently in historical charts. Notable examples include:
- A significant Bearish Engulfing pattern forming on the S&P 500 daily chart near all-time highs, often preceding market corrections.
- The USD/JPY currency pair forming Bullish Engulfing patterns at long-term support levels, sometimes kickstarting major rallies.
- Commodities like Gold futures showing Bearish Engulfing patterns at key psychological resistance levels (like $2,000/oz), often leading to substantial pullbacks.
The understanding and application of candlestick patterns like the Engulfing were significantly boosted in the Western world by pioneers such as Steve Nison, who introduced Japanese candlestick techniques. Analysts like Thomas Bulkowski provided statistical backing for pattern effectiveness, while technical analysis authorities like John Murphy helped popularize their use among traders.
In summary, the Engulfing pattern is a vital tool in a trader’s arsenal of price action trading patterns. Its clear visual representation of a potential trend reversal, especially when combined with context and confirmation, makes it a pattern worth mastering for traders aiming to improve their market timing and analysis skills.
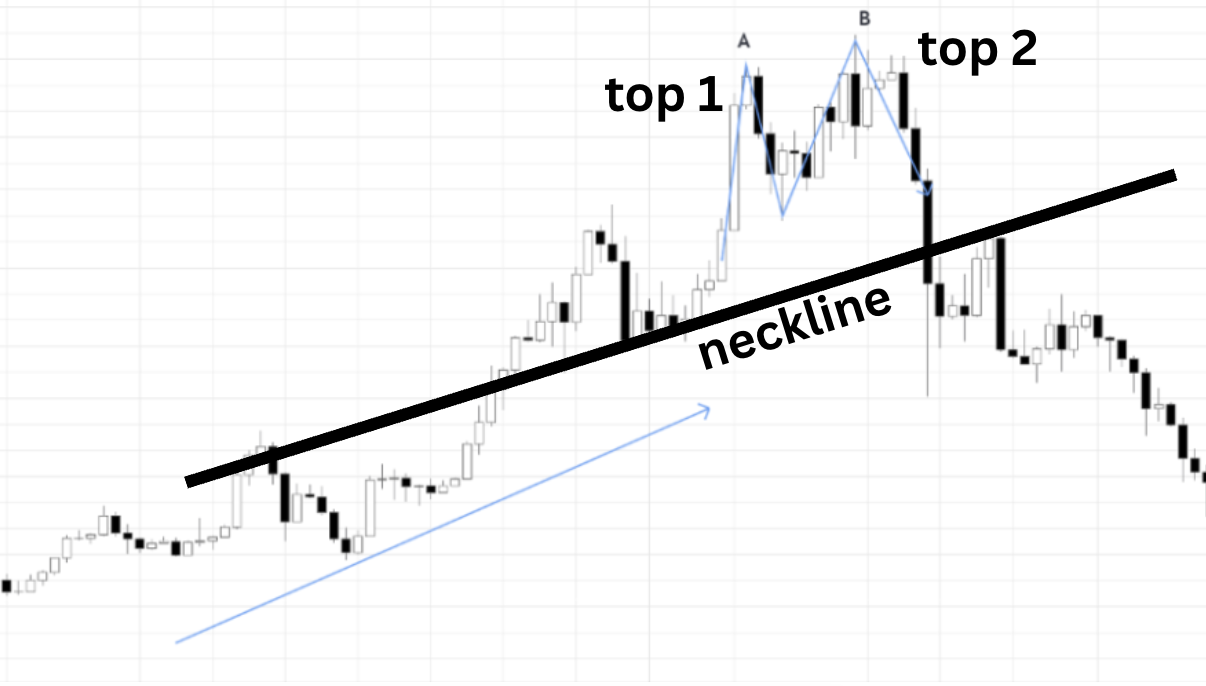
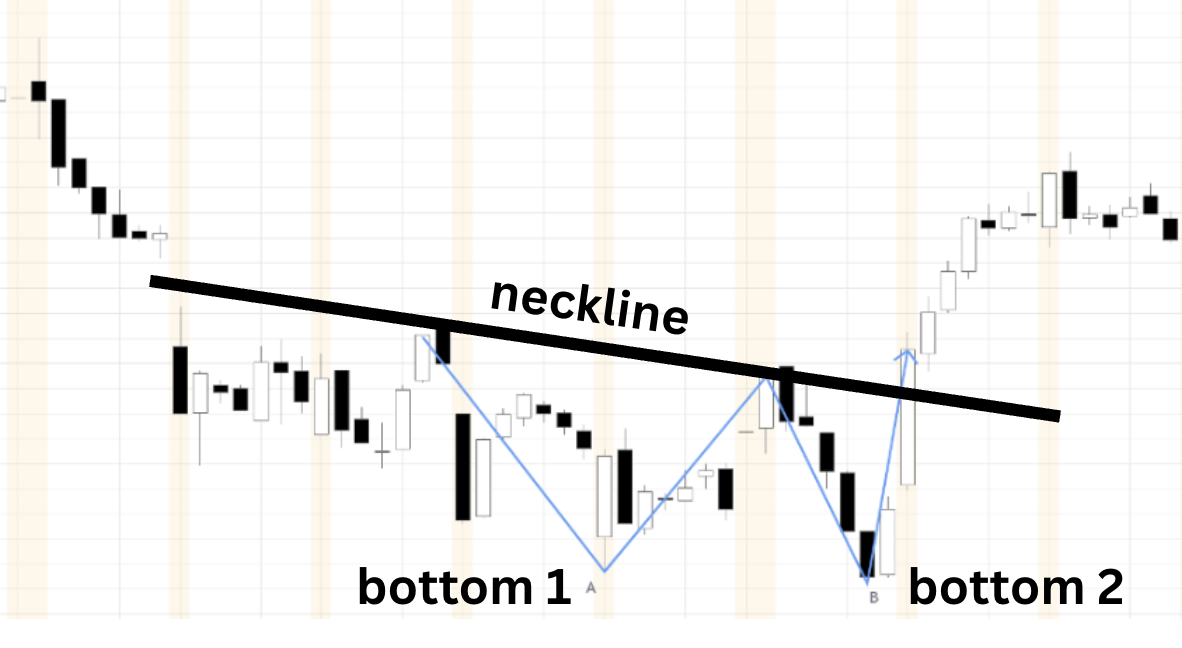
4. Double Top/Bottom Pattern
Among the most recognizable and widely respected price action trading patterns are the Double Top and Double Bottom formations. These are major reversal patterns, signaling a potential end to the prevailing trend and the beginning of a move in the opposite direction. They occur when the price makes two distinct attempts to breach a significant support or resistance level but ultimately fails, indicating that the momentum behind the prior trend is waning.
The infographic below provides a conceptual map, visualizing the core components and relationships within the Double Top/Bottom pattern analysis.
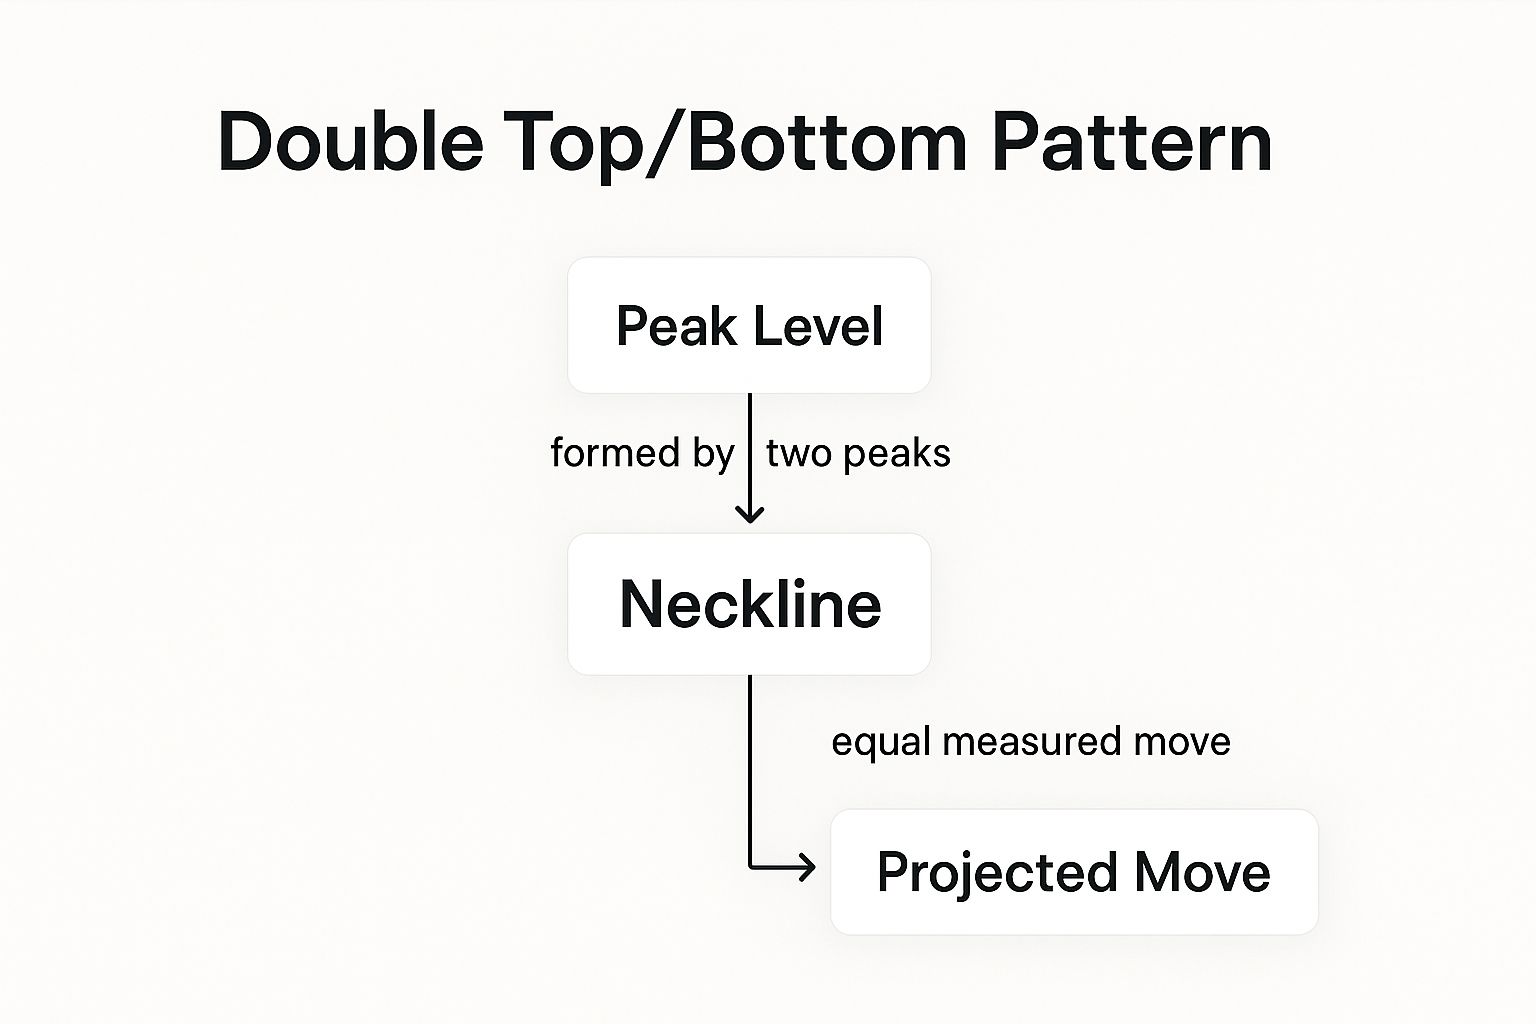
This concept map centers around the Double Top/Bottom pattern, branching out to related concepts like its Formation (requiring two peaks/troughs and a neckline), Key Features (shape, volume characteristics, confirmation signals), Trading Implications (entry, stop-loss, targets), and its overall Significance as a reversal indicator. The most important relationships highlighted are how the specific features define the pattern’s formation and how the confirmation event (neckline break) triggers specific trading actions. The visualization effectively summarizes how different elements connect to form a coherent trading strategy based on this pattern.
How Double Tops and Bottoms Work
Double Top: This pattern emerges at the peak of an uptrend and resembles the letter ‘M’.
- First Peak: Price reaches a new high, meets resistance, and retraces downwards.
- Retracement: Price pulls back, forming a temporary support level (the ‘neckline’).
- Second Peak: Price rallies again, attempting to break the previous high but fails at approximately the same resistance level. Ideally, volume on this second peak is lower than on the first, suggesting less conviction from buyers.
- Decline: Price falls back towards the neckline.
- Confirmation: A bearish reversal is confirmed when the price decisively breaks below the neckline support. This signals that buyers have lost control, and sellers are likely taking over.
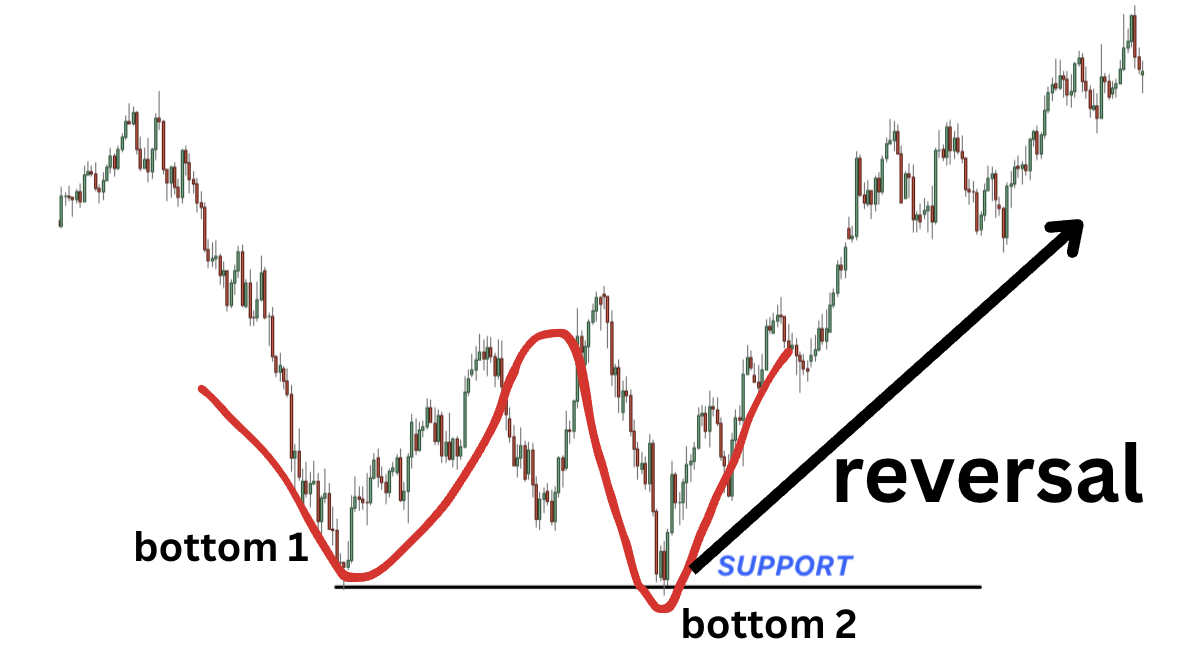
Double Bottom: Conversely, this pattern forms at the end of a downtrend and looks like the letter ‘W’.
- First Trough: Price hits a new low, finds support, and bounces upwards.
- Retracement: Price rallies temporarily, creating a resistance level (the ‘neckline’).
- Second Trough: Price declines again, testing the previous low but failing to break significantly below it. It finds support near the same level as the first trough. Volume might increase on the second trough or on the subsequent rally, indicating growing buying interest.
- Rally: Price moves back up towards the neckline.
- Confirmation: A bullish reversal is confirmed when the price decisively breaks above the neckline resistance. This suggests sellers are exhausted, and buyers are stepping in forcefully.
Why This Pattern Belongs in the List
The Double Top and Double Bottom patterns deserve a prominent place in any discussion of price action trading patterns due to their historical significance and reliability. Popularized by early technical analysis pioneers like Charles Dow and detailed extensively in seminal works like “Technical Analysis of Stock Trends” by Edwards and Magee, these formations represent a fundamental struggle between buyers and sellers at key price levels. Their clear structure and defined confirmation points make them a cornerstone of reversal pattern analysis across all markets and timeframes.
Features and Benefits
- Clear Structure: The distinct ‘M’ or ‘W’ shape makes the pattern relatively easy to identify visually once formed.
- Defined Levels: The peaks/troughs establish clear resistance/support, and the neckline provides a crucial trigger point.
- Sentiment Indicator: Represents exhaustion of the previous trend and a potential shift in market psychology.
- Measurable Objective: The pattern’s height often provides a basis for estimating potential profit targets after the breakout.
Pros and Cons
Pros:
- Highly reliable with a good historical success rate when correctly identified and confirmed.
- Provides objective entry points (neckline break), stop-loss levels (beyond the second peak/trough), and profit targets (measured move).
- Universally applicable across different timeframes (intraday to long-term) and markets (forex, stocks, crypto, commodities).
- Breakouts often lead to substantial and relatively swift price movements.
Cons:
- Can take significant time to fully develop and confirm, requiring patience.
- Trading before confirmation (neckline break) is risky and can lead to losses if the pattern fails.
- False breakouts of the neckline can occur, trapping traders, especially in choppy or volatile market conditions.
- The two peaks or troughs are rarely at the exact same price, introducing some subjectivity.
- Identifying the pattern in real-time can be challenging until the second peak/trough and subsequent move towards the neckline occur.
Successful Examples
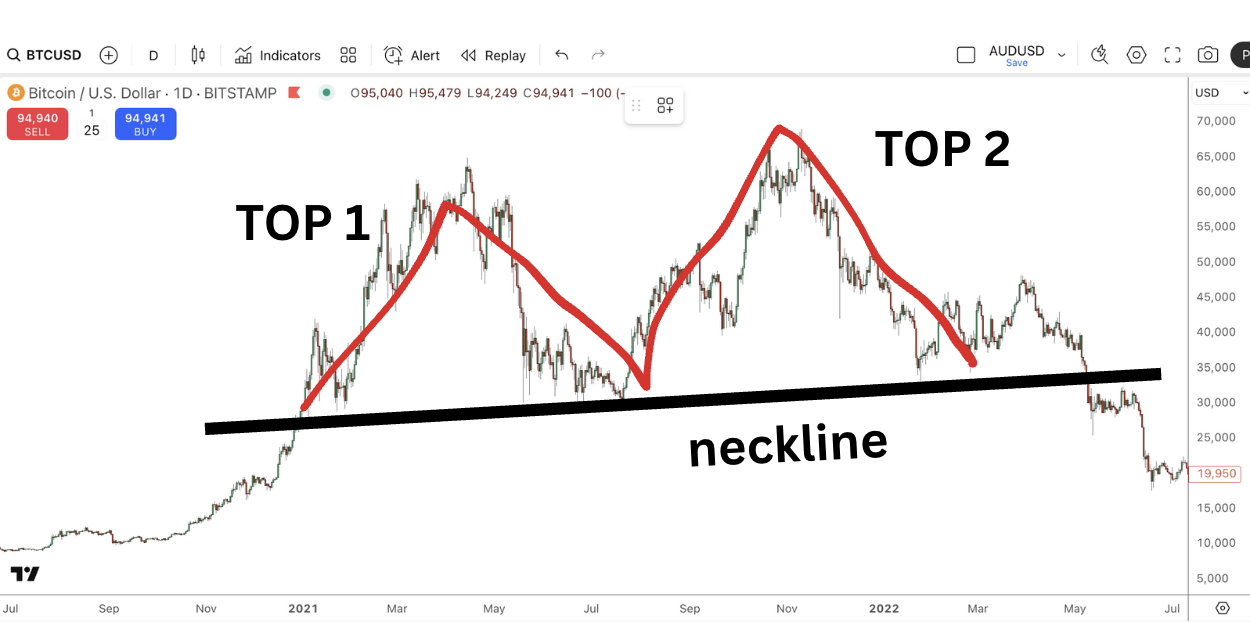
- Bitcoin (BTC/USD) – 2021: Formed a widely recognized double top pattern with peaks near $65,000 (April) and $69,000 (November), marking the end of the bull run and preceding a major bear market (see below)
- S&P 500 Index – 2020: Exhibited a rapid double bottom during the March COVID-19 panic, with troughs forming the base for a powerful new bull market.
- EUR/USD – 2021: A double top formed around the 1.2350 level in early January signaled the end of its uptrend, leading to a significant decline over the subsequent months.
Actionable Tips for Trading Double Tops/Bottoms
- Confirmation is Key: Always wait for a decisive close beyond the neckline before entering a trade. Premature entries are a common mistake.
- Measure the Target: Calculate the distance (height) from the highest peak (double top) or lowest trough (double bottom) down to the neckline. Project this distance from the breakout point to estimate a minimum price target.
- Volume Analysis: For Double Tops, look for diminishing volume on the second peak. For Double Bottoms, increasing volume on the approach to the second trough, the second trough itself, or the rally breaking the neckline adds confirmation.
- Stop-Loss Placement: Place stop-loss orders just above the high of the second peak for short trades (Double Top) or just below the low of the second trough for long trades (Double Bottom).
- Consider the Trend: While powerful reversal patterns, Double Tops/Bottoms forming against a very strong, long-term prevailing trend may have a higher failure rate. Context is important.
- Use Oscillators: Check momentum indicators like RSI or MACD for divergence. For a Double Top, price making a similar or higher high while the indicator makes a lower high (bearish divergence) strengthens the reversal signal. For a Double Bottom, price making a similar or lower low while the indicator makes a higher low (bullish divergence) adds confirmation.
To delve deeper into the nuances of identifying and trading these formations effectively, you can Learn more about Double Top/Bottom Pattern. Mastering these classic price action trading patterns provides traders with a reliable tool for spotting potential trend changes and capturing significant market moves.
Okay, here is the detailed section for item #5, the Head and Shoulders Pattern, incorporating all the provided details, instructions, and additional image placeholders.
5. Head and Shoulders Pattern
The Head and Shoulders pattern stands as one of the most recognized and statistically reliable formations in the technical analysis toolkit, making it a crucial element for anyone studying price action trading patterns. It’s primarily known as a reversal pattern, indicating that a prevailing trend might be nearing its end and a new trend in the opposite direction is likely to begin.
What it is and How it Works
This pattern gets its name from its resemblance to a human silhouette. There are two main variations:
- Standard Head and Shoulders (Bearish Reversal): This pattern forms after a significant uptrend and signals a potential shift to a downtrend. It consists of:
- Left Shoulder: Price makes a peak, pulls back, forming a trough.
- Head: Price rallies again, exceeding the previous peak (left shoulder) to form a higher peak, then pulls back again, forming a second trough.
- Right Shoulder: Price rallies once more, but fails to reach the height of the head, forming a lower peak roughly symmetrical in height to the left shoulder. It then declines again.
- Neckline: A trendline is drawn connecting the lows (troughs) established after the left shoulder and the head. This line can be horizontal or slightly sloped.
The pattern is considered complete, and the bearish reversal signal is confirmed only when the price breaks decisively below the neckline after forming the right shoulder. Volume often plays a key role: typically, volume is highest during the formation of the left shoulder, diminishes as the head forms, and is even lower on the right shoulder, suggesting waning buying pressure. A surge in volume often accompanies the neckline break, confirming the selling conviction.
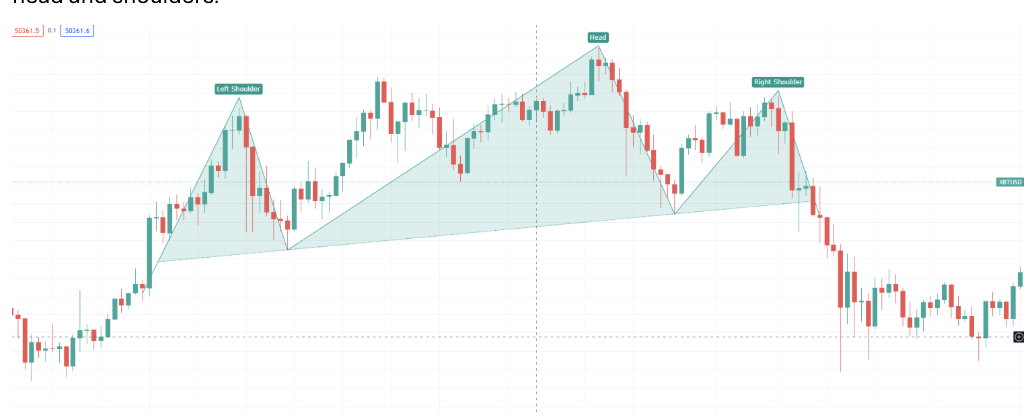 Caption: A typical Head and Shoulders top pattern formation, indicating a potential reversal from an uptrend to a downtrend upon breaking the neckline.
 - Inverse Head and Shoulders (Bullish Reversal): This is the mirror image of the standard pattern, forming after a downtrend and signaling a potential shift to an uptrend.
- It features three troughs: a central trough (the head) that is deeper than the two surrounding troughs (the shoulders).
- The neckline connects the reaction highs formed between the troughs.
- Confirmation occurs when the price breaks decisively above the neckline after the formation of the right shoulder. Volume dynamics are often reversed, with volume potentially increasing during the right shoulder formation and surging on the neckline breakout.
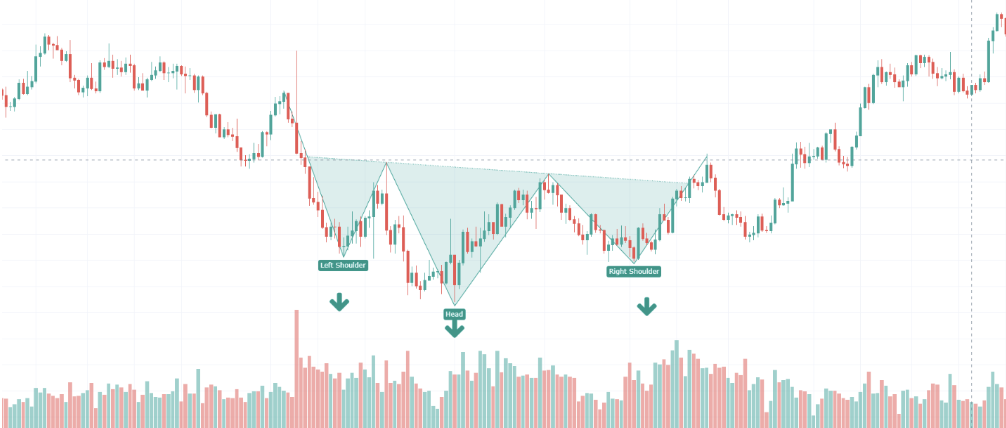 Caption: An Inverse Head and Shoulders bottom pattern, signaling a potential bullish reversal when price breaks above the neckline.
Why It Deserves Its Place in the List
The Head and Shoulders pattern earns its spot due to its historical reliability, clear structural definition, and the compelling market psychology it represents. It visually captures the struggle between buyers and sellers at a potential market top (or bottom for the inverse version), where buying momentum fails to sustain new highs (or selling pressure fails to make new lows). This makes it a powerful tool within the framework of price action trading patterns, offering traders relatively objective signals for trend changes.
Key Features & Benefits
- Structure: Consists of three sequential peaks (or troughs for inverse), with the middle one (head) being the most extreme.
- Symmetry: The shoulders are often (but not always perfectly) symmetrical in height/depth and width.
- Neckline: Acts as a critical support (standard) or resistance (inverse) level. Its break confirms the pattern.
- Volume Confirmation: Volume typically decreases during the right shoulder formation and increases on the neckline break, adding validity to the signal.
- Reliability: Considered one of the more dependable reversal price action trading patterns.
- Clear Targets: Provides a method for projecting potential price targets after the breakout.
- Defined Risk: Offers logical points for placing stop-loss orders.
- Universality: Applicable across various timeframes (intraday to weekly/monthly) and markets (stocks, forex, commodities, crypto).
- Psychological Insight: Reflects shifting market sentiment from optimism to pessimism (standard) or vice versa (inverse).
Pros:
- High reliability compared to many other patterns.
- Provides clear target projections based on the pattern’s height (distance from head to neckline).
- Offers well-defined entry points (neckline break or retest) and stop-loss levels (beyond the right shoulder).
- Works across diverse timeframes and financial instruments.
- The underlying market psychology (failing momentum, shifting control) adds robustness.
Cons:
- Can take significant time (weeks, months, even years on higher timeframes) to fully form.
- Susceptible to false breakouts, where price briefly breaks the neckline but then reverses back.
- The pattern can be invalidated if price rallies significantly above the right shoulder’s peak (standard) or falls significantly below the right shoulder’s trough (inverse).
- Identifying the components (shoulders, head, neckline) can sometimes be subjective.
- May be less effective in highly volatile, choppy, or illiquid market conditions.
When and Why to Use This Approach
Use the Head and Shoulders pattern primarily to identify potential major trend reversals.
- When: Look for the standard pattern after a prolonged uptrend when you suspect the trend might be exhausting. Look for the inverse pattern after a significant downtrend when anticipating a potential bottom and bullish reversal.
- Why: The pattern provides a structured way to anticipate and trade trend changes. Its completion via a neckline break offers a relatively objective signal, backed by shifts in market psychology and often confirmed by volume, making it a valuable component of price action trading patterns strategies. It helps traders transition from riding the old trend to potentially capitalizing on the new one.
Examples of Successful Implementation
- S&P 500 (2007): A major Head and Shoulders top pattern formed on the weekly chart throughout 2007, with the neckline break occurring late in the year, preceding the significant market decline during the 2008 financial crisis.
- Gold (2015-2016): An Inverse Head and Shoulders pattern developed over many months. The break above the neckline in early 2016 signaled the end of the preceding bear market and kicked off a multi-year rally that eventually took gold prices from around $1,050 to over $2,000 per ounce.
- USD/JPY (Q4 2016): A textbook Head and Shoulders top appeared on the daily chart, leading to a substantial decline of over 1,000 pips in the following months after the neckline was broken.
Actionable Tips for Traders
- Target Projection: Measure the vertical distance from the peak of the head down to the neckline. Project this same distance downwards from the point where the price breaks the neckline (for a standard pattern) or upwards (for an inverse pattern) to estimate a minimum price objective.
- Volume Confirmation: Always check volume. Decreasing volume on the right shoulder and increasing volume on the neckline break significantly strengthen the pattern’s validity.
- Stop-Loss Placement: For a standard Head and Shoulders, place your stop-loss order slightly above the high of the right shoulder. For an inverse pattern, place it slightly below the low of the right shoulder.
- Neckline Slope: Be aware of sloping necklines. An upward-sloping neckline in a standard pattern requires a more decisive break and might indicate less bearishness. A downward-sloping neckline in an inverse pattern needs a strong break and might show less bullish conviction. Horizontal necklines are generally considered more reliable.
- Momentum Divergence: Look for bearish divergence (e.g., using RSI or MACD) between the price action of the head and the right shoulder in a standard pattern (price makes a lower high on the right shoulder, but the indicator makes an even lower high or fails to confirm the price peak). Bullish divergence can strengthen an inverse pattern.
- Entry Strategy: Consider entering a trade on the decisive break of the neckline. Some traders prefer to wait for a potential pullback and retest of the neckline (as new resistance for standard, new support for inverse) before entering, which can offer a better risk/reward ratio but risks missing the move if no retest occurs. Consider partial entries.
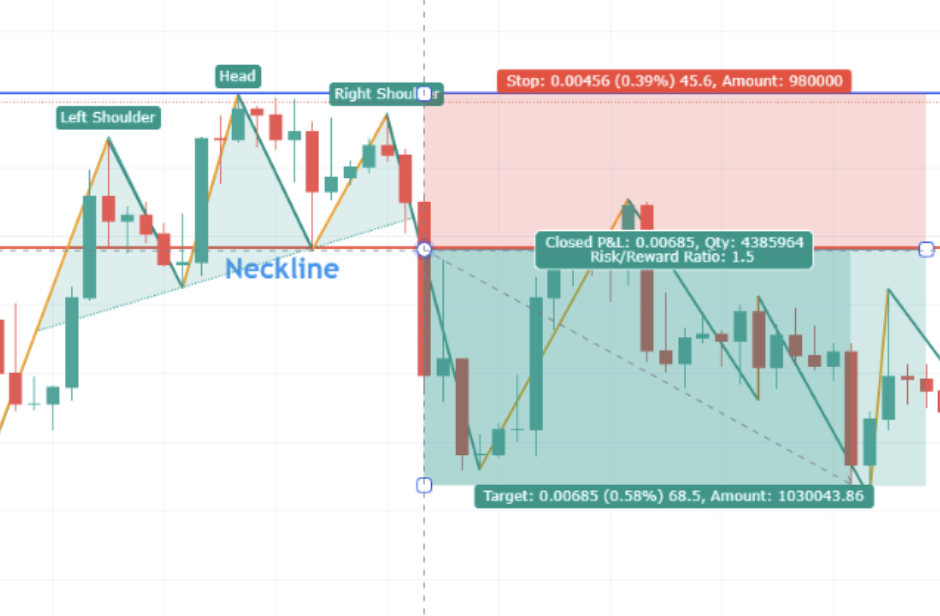 Caption: Trading the Head and Shoulders: Note the volume surge on the neckline break, the target measured from the head to the neckline, and typical stop-loss placement above the right shoulder.
Video Resource:
Watch this video for a visual explanation and further insights into trading 15 chart patterns:
Popularized By:
While a classic pattern recognized for decades, its analysis and popularization in modern technical analysis owe much to figures like:
- Thomas Bulkowski: Conducted extensive statistical research on chart patterns, including Head and Shoulders, quantifying their performance and reliability.
- John Murphy: A prominent technical analyst whose books (like “Technical Analysis of the Financial Markets”) helped bring chart patterns, including this one, to a wider audience of traders.
- Alexander Elder: Author and trader who often delves into the psychological aspects behind pattern formations like the Head and Shoulders in his works.
In summary, the Head and Shoulders pattern is a fundamental and highly regarded formation within the study of price action trading patterns. Its ability to signal major trend reversals with relatively clear entry, stop-loss, and target parameters makes it an indispensable tool for traders across all markets and timeframes.
6. Bullish/Bearish Rectangles (Consolidation Patterns)
Among the most recognizable and widely utilized price action trading patterns are Bullish and Bearish Rectangles. These formations represent periods of consolidation or pause within a larger, established trend. Essentially, they depict a temporary stalemate between buyers and sellers before the market typically resumes its prior direction. Understanding rectangles is crucial for traders looking to identify potential trend continuation opportunities.
What Are Rectangle Patterns and How Do They Work?
A rectangle pattern forms when price action becomes bounded between two horizontal, parallel lines – a resistance level capping the highs and a support level containing the lows. This creates a distinct rectangular shape on the price chart.
- Formation: The pattern requires at least two comparable highs touching the upper resistance line and at least two comparable lows touching the lower support line. The more times price touches these boundaries without breaking through, the more established and significant the pattern becomes.
- Consolidation: During the formation of a rectangle, price tends to bounce back and forth between the support and resistance levels. This indicates a period of equilibrium where neither buyers nor sellers have enough conviction to push the price decisively in a new direction or immediately resume the prior trend.
- Volume: Typically, trading volume diminishes as the rectangle pattern develops. This reflects the decreasing certainty and participation during the consolidation phase. A significant increase in volume accompanying a breakout beyond the support or resistance level is a key confirmation signal.
- Bullish vs. Bearish:
- Bullish Rectangle: Forms during an established uptrend. It signifies a pause where buyers absorb selling pressure before potentially driving prices higher. The expectation is an eventual breakout above the resistance level, signaling a continuation of the uptrend (see below)
- Bearish Rectangle: Forms during an established downtrend. It represents a pause where sellers consolidate gains and absorb buying pressure before potentially pushing prices lower. The expectation is an eventual breakout below the support level, signaling a continuation of the downtrend (see below)
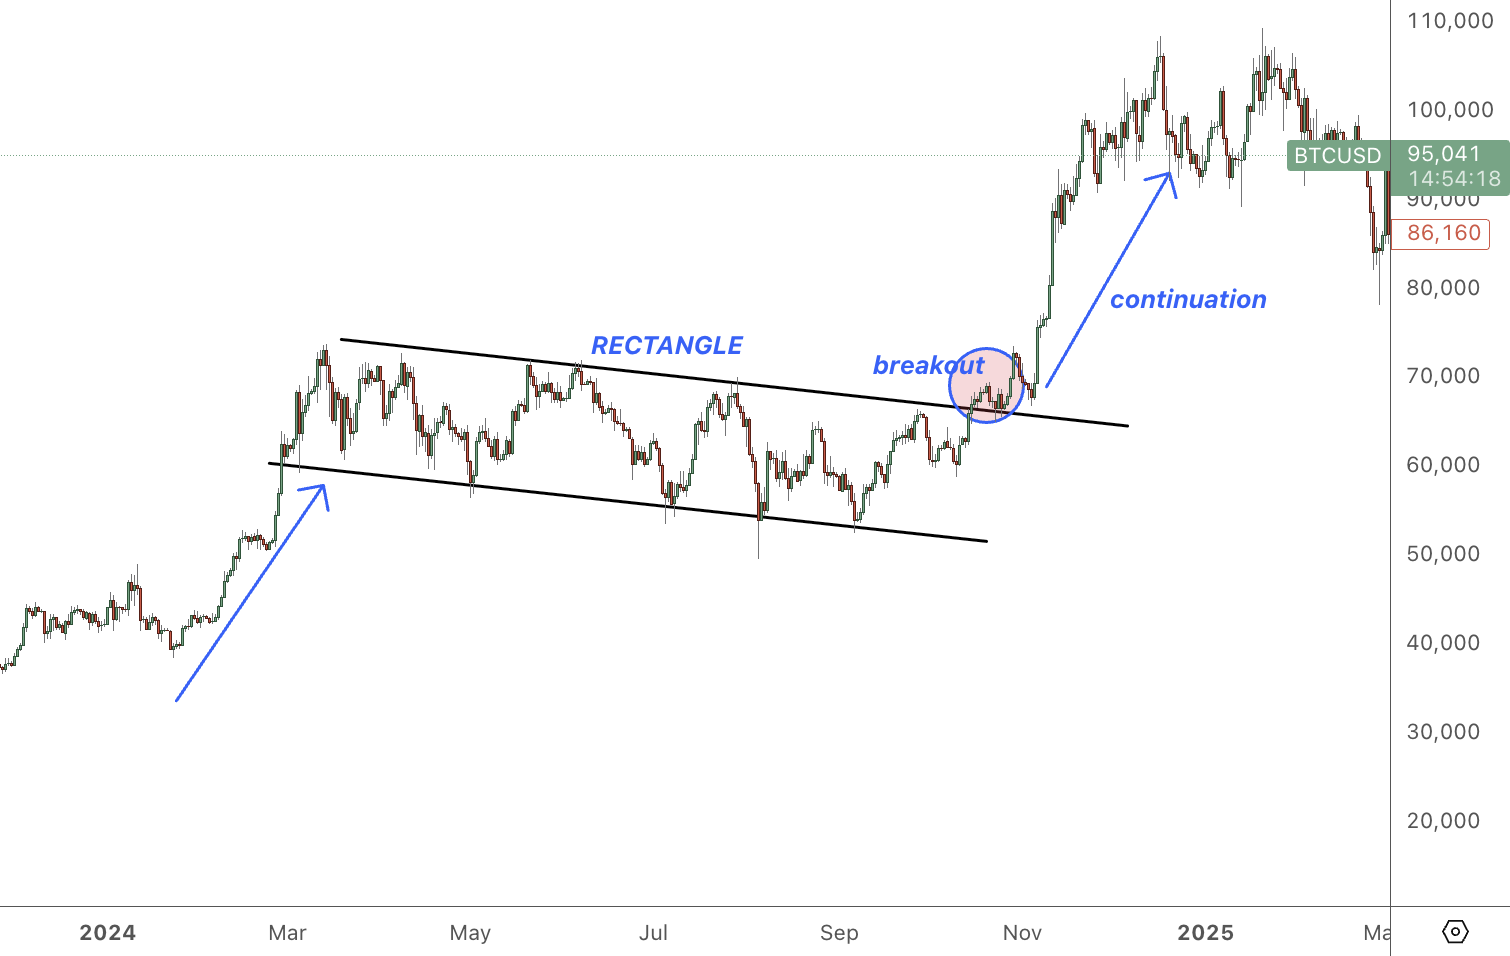
Caption: Example of a Bullish Rectangle formation within an uptrend.
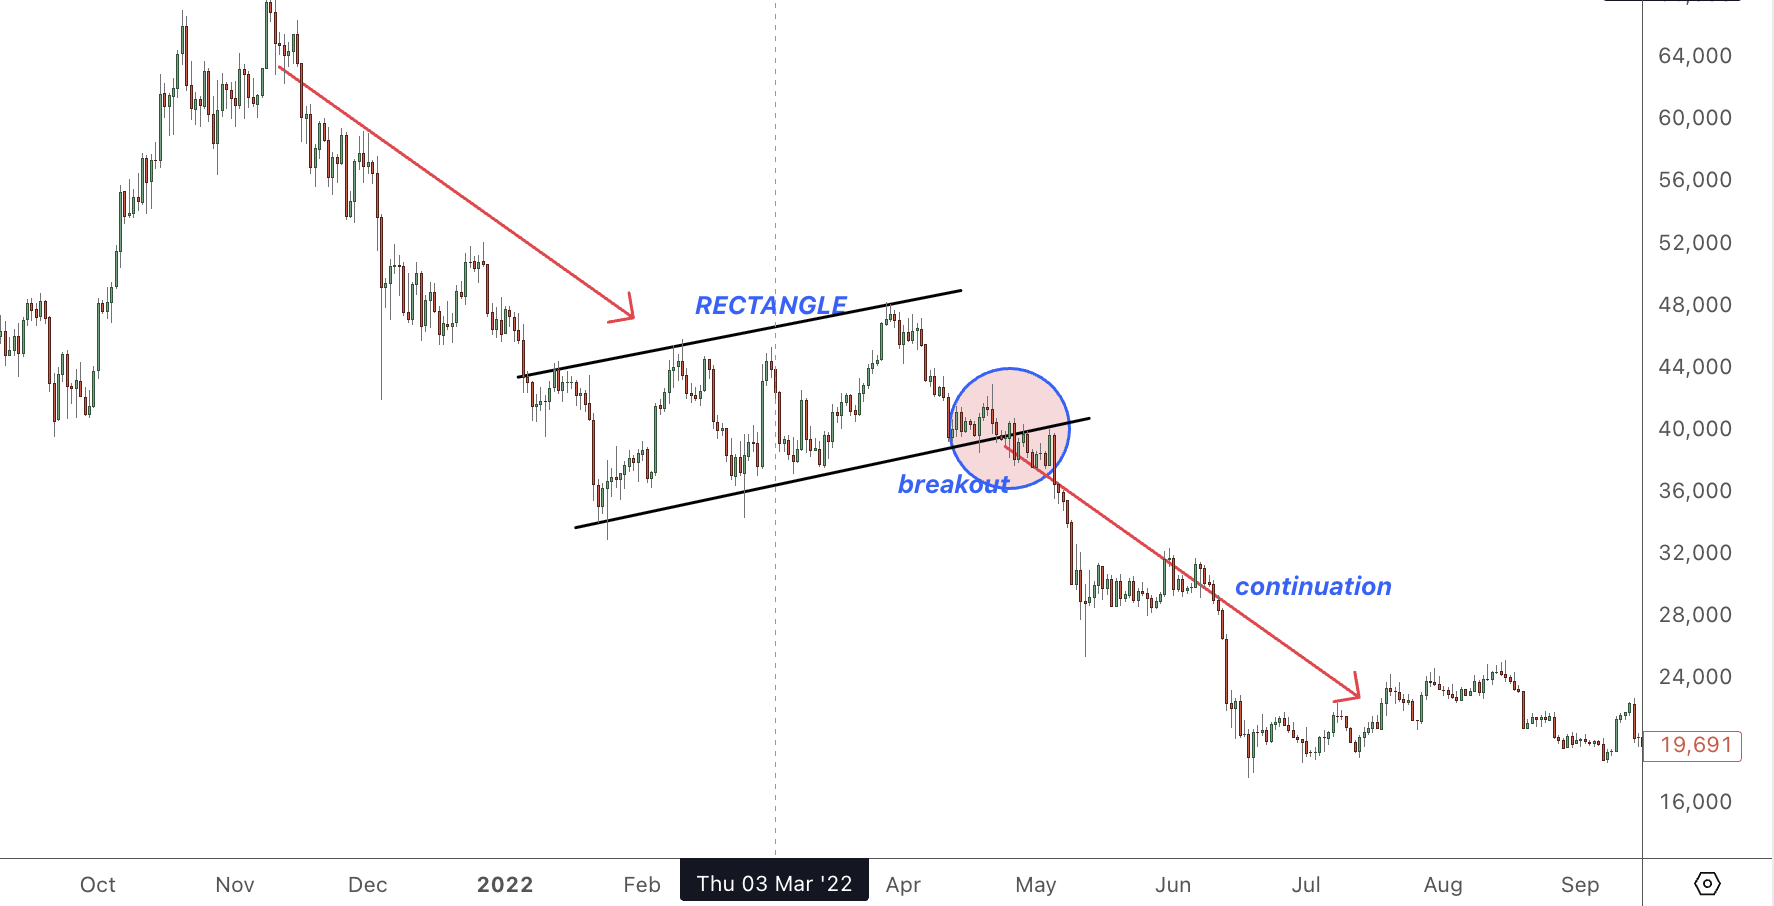
Caption: Example of a Bearish Rectangle formation within a downtrend.
Why This Pattern Deserves Its Place
Rectangles are fundamental price action trading patterns because they visually represent a clear battle between supply and demand within defined boundaries. Their structure offers objective entry, stop-loss, and profit target levels, making them a practical tool for traders of all experience levels. They highlight periods where market energy is building, often leading to strong directional moves upon resolution.
Key Features & Benefits (Pros):
- Clear Boundaries: Defined by horizontal support and resistance, making identification relatively straightforward once established.
- Objective Entry Points: Breakouts above resistance (bullish) or below support (bearish) provide clear signals to enter a trade.
- Defined Risk: Stop-losses can be logically placed just inside the opposite boundary of the rectangle (e.g., below support for a long entry on a bullish breakout).
- Measurable Profit Targets: A common technique is to measure the height of the rectangle (distance between support and resistance) and project that distance from the breakout point to estimate a minimum price target.
- Range Trading Opportunity: While waiting for a breakout, some traders engage in range trading, buying near support and selling near resistance within the rectangle (though this carries its own risks).
- Trend Confirmation: A valid breakout often results in a strong, momentum-driven move in the direction of the prior trend.
Potential Drawbacks (Cons):
- False Breakouts (Shakeouts): Price might briefly break one boundary only to reverse sharply back inside the rectangle, trapping breakout traders. This is a common frustration.
- Pattern Failure/Transformation: Rectangles are continuation patterns, but they can sometimes fail and lead to a trend reversal instead. They might also morph into other patterns.
- Time Consuming: These patterns can take considerable time to form, requiring patience from the trader. Weeks or even months of consolidation are not uncommon.
- Market Conditions: They tend to be less reliable in extremely volatile, news-driven markets where price can gap significantly beyond the pattern’s boundaries without respecting them.
- Late Identification: It often takes multiple touches of both support and resistance to confidently identify the pattern, meaning a portion of the consolidation may have already passed.
When and Why to Use Rectangle Patterns:
Use rectangle patterns when you identify a clear pause within an existing trend (uptrend for bullish, downtrend for bearish). They are valuable because:
- They signal a potential resumption of the dominant trend after a period of indecision.
- They provide a structured way to plan trades with clear risk and reward parameters based purely on price action structure.
- They help filter out market noise by focusing on defined horizontal levels.
Actionable Tips for Trading Rectangles:
- Wait for Confirmation: Don’t anticipate the breakout. Wait for a decisive candle close outside the rectangle boundary (above resistance for bullish, below support for bearish).
- Volume is Key: Look for a noticeable increase in volume on the breakout candle. This suggests strong conviction behind the move and increases the probability of a successful breakout. Low-volume breakouts are more prone to failure.
- Set Realistic Targets: Use the rectangle’s height projected from the breakout point as an initial target. Monitor price action as it approaches this level.
- Manage Risk: Place your stop-loss strategically. A common placement is just back inside the broken boundary (e.g., just below the resistance line after a bullish breakout).
- Consider the Context: Always assess the overall market trend and context. A bullish rectangle breakout is more likely to succeed in a strong bull market.
- Patience Pays: The longer the rectangle persists and the more touches it has, the more significant the energy being built, potentially leading to a more powerful breakout. Don’t rush entries.
- Use Momentum Indicators (Optional): Indicators like RSI or MACD can sometimes show divergences near the pattern boundaries, potentially offering clues about the breakout direction, though price action confirmation remains paramount.
Examples of Successful Implementation:
- Tesla (TSLA): In early 2023, TSLA stock consolidated between roughly $280 (support) and $330 (resistance), forming a bullish rectangle within its uptrend, before eventually breaking higher towards $380.
- EUR/USD: The currency pair formed a bearish rectangle between approximately 1.0750 (support) and 1.0850 (resistance) for several weeks in 2022 during a broader downtrend, subsequently breaking lower.
- Bitcoin (BTC): During May-June 2021, Bitcoin consolidated in a wide bearish rectangle roughly between $28,000-$31,000 before experiencing a significant breakdown.
Historical Context & Popularizers:
While basic horizontal support and resistance are timeless concepts, the formalization and strategic use of rectangle patterns were advanced by technical analysis pioneers. Early traders like Jesse Livermore inherently used such formations. Richard Wyckoff’s work on accumulation and distribution phases often visually manifests as rectangle-like structures. Robert Edwards and John Magee, in their seminal work “Technical Analysis of Stock Trends,” extensively documented and popularized chart patterns, including rectangles, solidifying their place in classic technical analysis.
Mastering the identification and trading of these consolidation phases is a valuable skill in building a robust strategy based on price action trading patterns. Understanding the nuances of these formations is crucial. Learn more about Bullish/Bearish Rectangles (Consolidation Patterns) to deepen your knowledge and explore further examples.
Key Traits Comparison of 6 Price Action Patterns
| Pattern | Implementation Complexity 🔄 | Resource Requirements 💡 | Expected Outcomes 📊 | Ideal Use Cases 💡 | Key Advantages ⭐ |
|---|---|---|---|---|---|
| Pin Bar Pattern | Low – Single candle pattern, easy to spot | Minimal – Can be identified on any timeframe | Moderate – Signals potential reversals | Reversal entries at key support/resistance | Clear entry/stop-loss, strong price rejection |
| Inside Bar Pattern | Moderate – Requires understanding bar ranges | Moderate – Needs multiple candle analysis | Moderate – Indicates consolidation before breakout | Consolidation phases and trend continuations | Good risk-reward, works in trending/ranging |
| Engulfing Pattern | Low – Two-candle pattern with clear rules | Minimal – Visible across markets/timeframes | High – Strong reversal signals | Trend reversal identification | High probability, clear entry/stop targets |
| Double Top/Bottom Pattern | High – Multi-bar pattern with neckline concept | Moderate – Requires pattern confirmation | High – Major reversal with significant moves | Major trend reversals on key levels | Reliable, works on all timeframes/markets |
| Head and Shoulders Pattern | High – Complex three-peak pattern | High – Needs detection of symmetry, neckline | Very High – Strong reversal with price targets | Clear reversal after extended trends | Robust, provides precise targets & entries |
| Bullish/Bearish Rectangles | Moderate – Multiple touches at support/resistance | Moderate – Needs observation of channel | Moderate to High – Continuation or breakout moves | Trend continuation after consolidation | Clear breakouts, strong momentum post-breakout |
From Patterns to Profits: Your Trading Roadmap
You’ve now explored a powerful toolkit of price action trading patterns, from the reversal signals often indicated by Pin Bars, Engulfing patterns, Double Tops/Bottoms, and Head and Shoulders, to the continuation signals frequently seen in Inside Bars and Bullish/Bearish Rectangles. Recognizing these formations on your charts is a vital first step towards understanding market sentiment and potential future movements.
However, the most crucial takeaway is that simply identifying these shapes isn’t enough. The journey from recognizing price action trading patterns to achieving consistent profitability hinges on much more:
- Context is King: Where does the pattern form? Is it at a key support/resistance level? Aligning with the dominant trend? Context drastically changes a pattern’s reliability.
- Practice Makes Proficient: Theoretical knowledge must translate into practical skill. Spend time scrolling through charts, identifying these patterns historically, and then practice spotting them in real-time (ideally in a demo account initially).
- Discipline & Risk Management: This is paramount. Successful trading isn’t just about winning patterns; it’s about managing losses effectively and sticking to your trading plan even when emotions run high. Consistent application, as emphasized by professional trading educators, is key.
Mastering these price action trading patterns and the principles behind them is invaluable. It builds confidence, fosters consistency, and moves you away from relying on lagging indicators towards reading the market’s raw language. This understanding forms the bedrock for developing a flexible trading approach adaptable to various market conditions, a significant step towards achieving goals like location-independent income or simply greater financial self-reliance.
Your actionable roadmap from here should involve:
- Deep Dive Practice: Go back through historical charts specifically looking for the 6 patterns discussed. Note the context in which they succeeded or failed.
- Demo Trading Application: Start applying your pattern recognition skills in a risk-free demo environment. Focus on entry, stop-loss placement, and take-profit targets based on the patterns and surrounding price structure.
- Continuous Learning: Price action analysis is a deep field. Continue studying market structure, support/resistance, and candlestick analysis to refine your edge.
Remember, transforming knowledge into skill requires dedicated effort and often benefits from structured guidance.
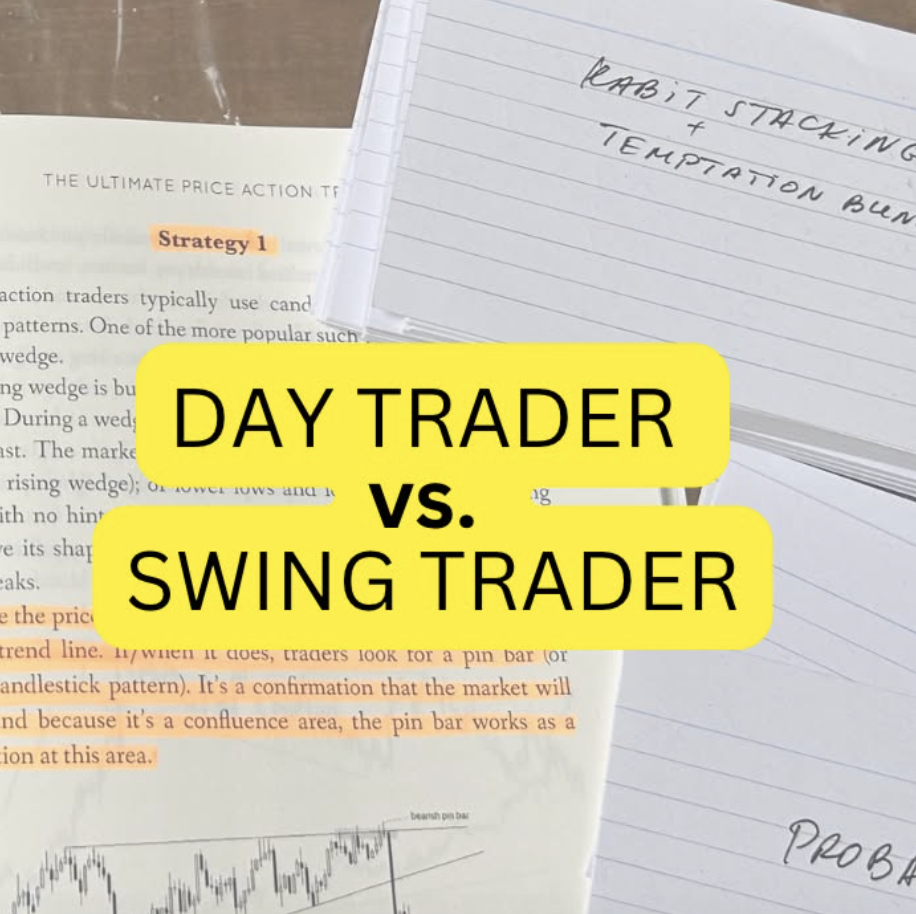
“Take Your Free Trading Potential Quiz”- Are you a Day Trader or a Swing Trader?
Take the test before to figure out what you will be better at- Start Quiz Now
If you’re serious about mastering price action trading patterns and want a proven, action-based path focused on discipline and consistent application, consider exploring the resources at Colibri Trader. Our programs are designed to help traders like you build practical skills and apply these concepts effectively under expert guidance.
The path from patterns to profits requires dedication, but understanding the language of price action is a powerful foundation for your trading journey. Start practicing today, stay disciplined, and watch your trading evolve.
Start with the Price Action Course- no experience is needed: