NASDAQ Daily Chart: A Two-Day Bearish Engulfing Could Signal a Major Reversal
A Two-Day Bearish Engulfing Could Signal a Major Reversal
The NASDAQ is approaching a potentially important turning point. After a strong rally, the daily chart is now showing a two-day bearish engulfing formation near a major resistance area. Could this be the beginning of a much larger bearish move?
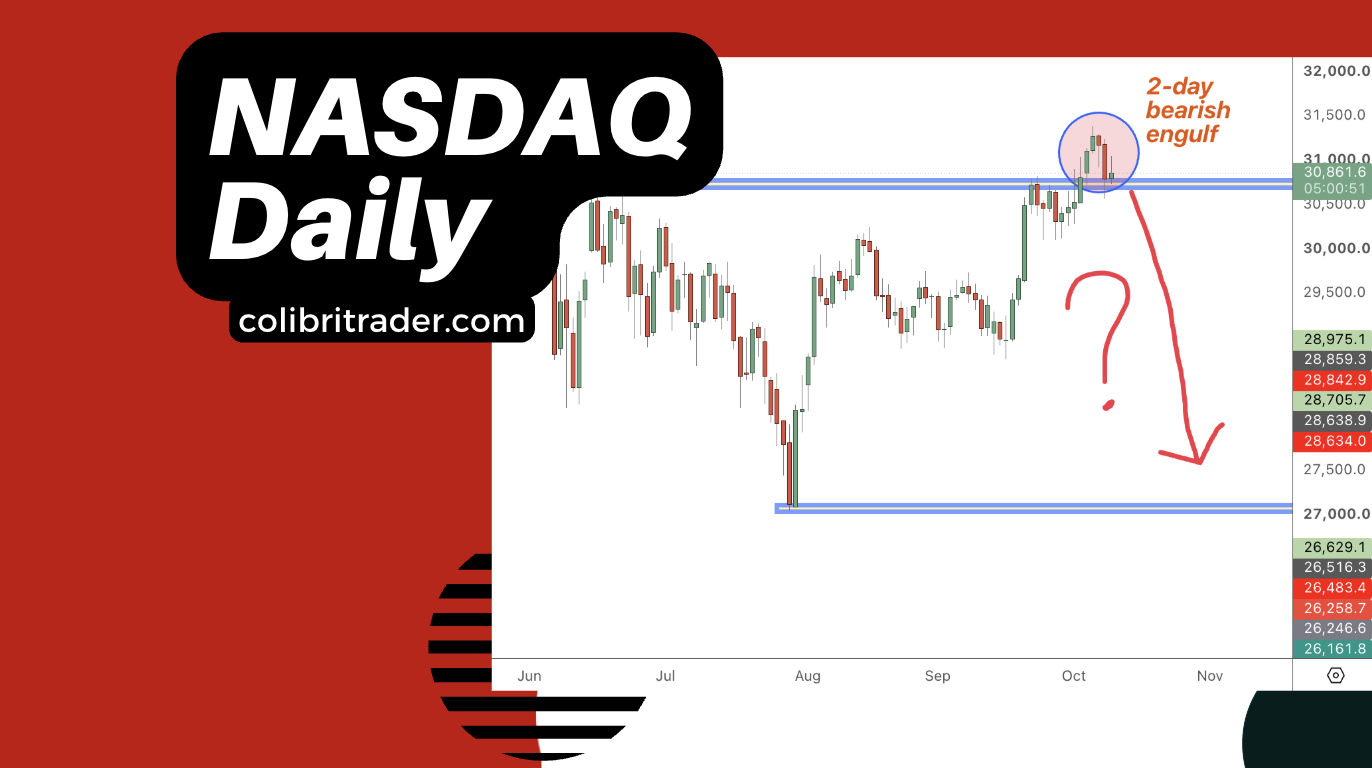
Over the past few months, the NASDAQ has demonstrated considerable strength, recovering from its July lows and pushing back towards the 31,000–31,500 region.
However, something interesting is developing on the daily chart.
We are now seeing what appears to be a two-day bearish engulfing formation, right around a significant technical level.
And while one candlestick formation alone is never enough to justify a trade, its location makes this particular development worth watching.

Why This Bearish Engulfing Matters
The first thing that catches my attention is not necessarily the bearish engulfing itself.
It’s where it is forming.
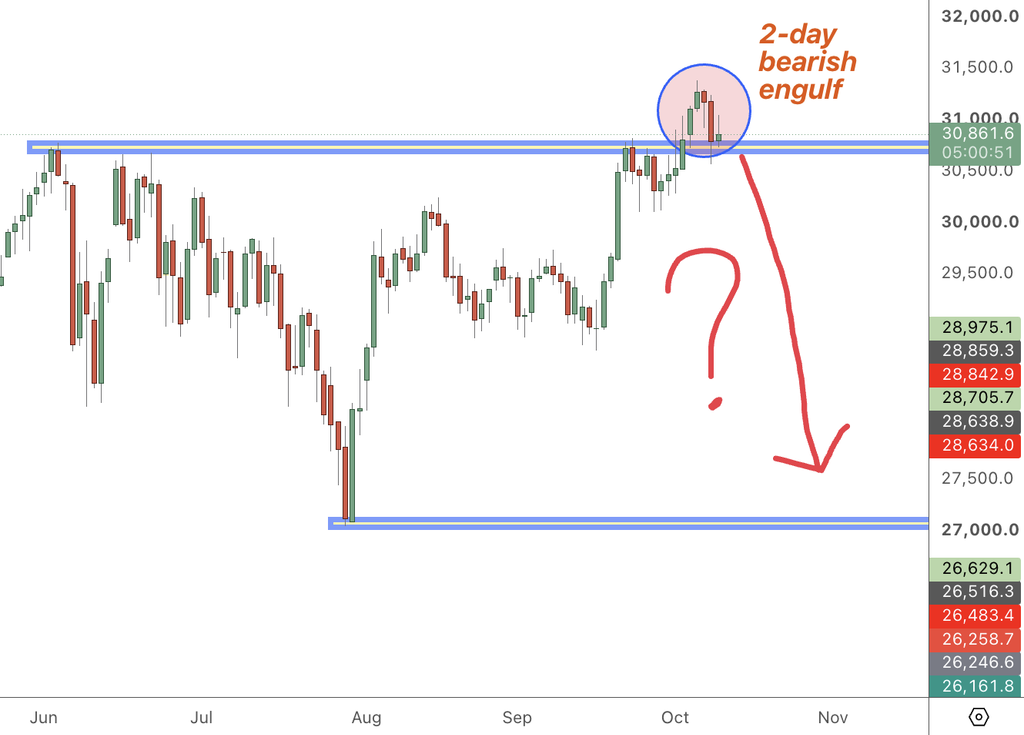
Looking at the daily chart, the NASDAQ recently pushed above the 30,500–30,800 area, a zone that has previously acted as an important resistance level.
After breaking higher, the market extended towards 31,300 before sellers began stepping in.
The resulting price action has created a potential two-day bearish engulfing formation, suggesting that buyers may be losing momentum.
This is particularly interesting because the market is now testing the same area that previously prevented prices from moving higher.
In technical analysis, the location of a candlestick formation is often more important than the formation itself.
A bearish engulfing in the middle of nowhere tells me very little.
A bearish engulfing near a major technical level, following an extended rally, is a different story.
But there is one important detail.
The NASDAQ has not yet confirmed a bearish reversal.
And that distinction matters.
The 30,500 Level Is My Line in the Sand
For now, the most important level on my chart is approximately 30,500.
This is the area I will be watching closely over the coming trading sessions.
Although the market is showing early signs of weakness, price remains around a significant supply zone following its recent breakout.
If buyers successfully defend this zone, the bullish structure could remain intact, and we might see another attempt to push towards the recent highs.
However, if the NASDAQ breaks decisively below 30,500 on the daily chart, the technical picture becomes considerably more interesting from a bearish perspective.
Why?
Because a confirmed break would suggest that the recent move above resistance has failed.
And failed breakouts can sometimes produce powerful moves in the opposite direction.
In this scenario, I would start considering the possibility of a much deeper correction, potentially towards the next significant demand area around 27,000.
That is a potential downside scenario, not a price target I am assuming the market must reach.
My Trading Plan: Daily Confirmation First, 4H Entry Second
One of the biggest mistakes I see traders make is trying to predict a reversal before the market has actually confirmed one.
They see a bearish candlestick.
They immediately enter short.
And then they wonder why the market continues moving higher.
I prefer a more structured approach.
For this particular NASDAQ setup, my plan is relatively straightforward.
Step 1: Wait for a clear daily break below 30,500.
I want to see convincing bearish price action, ideally with a daily candle closing below this level.
A temporary move below support followed by a strong recovery would not provide the confirmation I am looking for.
Step 2: Move to the 4-hour chart.
Once the daily chart confirms a bearish break, I will switch to the 4H timeframe and look for a suitable entry opportunity.
Specifically, I will be watching for one of two candlestick formations:
- Bearish engulfing: A strong bearish candle that engulfs the previous bullish candle, indicating renewed selling pressure.
- Inverted pin bar: A candle with a long upper wick and a relatively small body, suggesting that buyers attempted to push prices higher but were rejected by sellers.
Ideally, these formations would develop around a meaningful resistance area or following a retest of the broken support zone.
Step 3: Evaluate the asymmetric opportunity.
Even if all the technical conditions align, that does not automatically make it a trade worth taking.
I still need to assess the potential reward relative to the risk.
If the stop-loss distance is too large, or if the next demand zone is too close, the opportunity may not offer sufficient asymmetry.
And in that case, I am perfectly happy to do nothing.
Why I Am Not Shorting the NASDAQ Yet
This is perhaps the most important part of the entire analysis.
I have a bearish scenario in mind.
I can see a potential reversal developing.
I can identify the level that would strengthen the bearish case.
But none of that means I should enter a short position immediately.
Having a market bias and having a valid trading setup are two completely different things.
The market does not owe me a reversal simply because a bearish engulfing has appeared on the daily chart.
The 30,500 area could hold.
Buyers could regain control.
The NASDAQ could continue towards new highs.
All of these outcomes remain possible.
My job is not to predict which one will happen.
My job is to identify the conditions under which an opportunity becomes attractive and then wait for the market to present them.
This is a fundamental part of how I approach asymmetric day trading.
I am not interested in catching every market movement.
I am interested in finding situations where a relatively small, predefined risk could provide exposure to a significantly larger move.
Final Thoughts: Patience Before Prediction
The NASDAQ is currently sitting at an interesting technical crossroads.
The developing two-day bearish engulfing formation suggests that sellers may be gaining strength after the recent rally.
But the key remains the 30,500 level.
A decisive daily break below this area would strengthen my bearish outlook and potentially open the door to a larger downward move.
If that happens, I will be looking for a bearish engulfing or inverted pin bar on the 4H chart before considering an entry.
Until then, I am simply observing.
Because in trading, the objective is not to be the first person to predict a move. It is to be prepared when a genuinely asymmetric opportunity presents itself.
And sometimes, the best trading decision is to wait.
Disclaimer: This article reflects my personal technical analysis and trading approach. It is for educational purposes only and does not constitute financial advice. Trading involves risk, and no technical formation or trading strategy guarantees a particular outcome.