NASDAQ Trading Analysis 15 May, 026
Dear traders,
Last time, I shared my thoughts on GBPUSD.
Since then, the pair has delivered mixed price action.
Initially, GBPUSD moved higher, playing out one of the scenarios I discussed. However, momentum quickly faded, and the market has since broken below the key support zone we were watching closely.
At the moment, price is trading below that level, with the next major support sitting nearly 200 pips lower.
Because of this, I’m staying patient and avoiding any trades on GBPUSD for now.
The overall picture remains mixed, and I’d rather wait for cleaner price action than force a setup that isn’t there.
What does look interesting right now, however, is NASDAQ.
Here is why.
NASDAQ Trading Analysis 15 May, 2026
I’ve been following this closely because NASDAQ has been on an absolute tear lately.
In fact, this may be one of the strongest one-month rallies in its history.
The index has climbed nearly 30% in just the past month alone.
Moves like these are usually seen at two key moments in the market cycle: either at the beginning of a powerful new bull trend… or near the end of one.
Considering we are not in the early stages of a fresh bull market, I’m leaning more toward the possibility that we could be approaching a major reversal point.
Technically, the picture is quite interesting.
Because NASDAQ is trading at all-time highs, it becomes difficult to draw traditional supply and demand zones. There simply isn’t enough historical price action at these levels to identify strong institutional areas.
That leaves us relying primarily on pure price action.
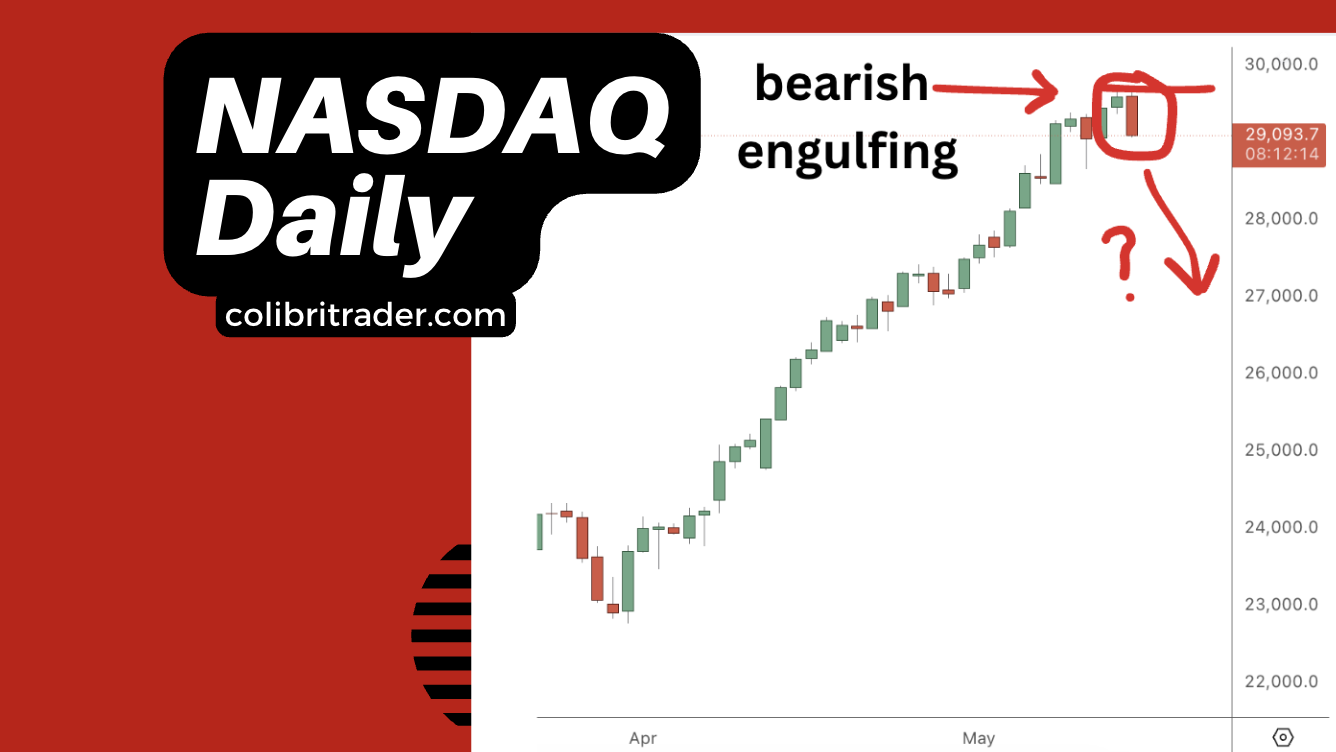
And from a price action perspective, we’ve already seen a bearish engulfing candle form on the daily timeframe — an early warning sign that momentum may be slowing down.
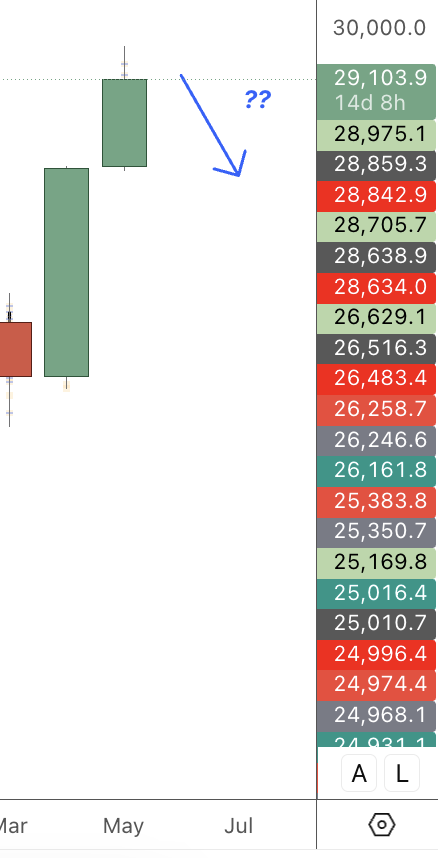
The monthly chart, however, is still developing, with around 15 days left until the candle closes.
If the current correction continues, we could eventually end up with a strong bullish rejection candle on the monthly timeframe.
And if that happens, I would become even more cautious about what may follow afterward.
Here’s how the monthly chart currently looks:
What I’m looking for now is a potential bearish confirmation on the 4H timeframe.
Ideally, I’d like to see price revisit the 29,400 area and show a clear candlestick rejection around that level.
If we get that kind of setup, I may consider taking action.
Until then, patience remains key.
Happy Friday,
Atanas