


Learn Price Action Trading: Master Your Market Strategies
The Foundations: Why Price Action Trading Works
Many aspiring traders find themselves overwhelmed by the sheer number of complex indicators, constantly searching for the perfect tool to predict the market’s every move. This often leads to analysis paralysis, hindering decision-making and causing missed opportunities. Price action trading presents a compelling alternative.
Price action trading focuses on interpreting the raw price movements of an asset. Instead of trying to predict future movements, it emphasizes understanding current market behavior. This direct approach offers several key advantages.
Understanding Market Psychology Through Candlesticks
By learning to interpret candlestick patterns, traders gain valuable insights into the underlying market psychology. Each candlestick represents the interplay between buyers and sellers during a specific period, revealing shifts in momentum and potential turning points.
This allows traders to anticipate potential reversals or continuations based on these readily available signals. Reading price action directly empowers traders to react to current market conditions, rather than relying on potentially lagging indicators.
Developing an Intuitive Understanding of Market Flow
Experienced price action traders develop an intuitive understanding of market flow, recognizing repeating patterns and the rhythm of the market. This intuitive “feel” is challenging to achieve with indicator-based strategies, as indicators often lag behind price.
Price action traders anticipate market moves by interpreting real-time price data, rather than reacting to delayed signals. This proactive approach enables traders to capitalize on opportunities more effectively.
The Historical Significance of Price Action
Price action trading boasts a rich history. Its origins trace back to 17th-century Japan, where rice traders developed candlestick charting techniques that remain fundamental today. The Doji candlestick pattern, for instance, originating from this period, now appears in 5-15% of all daily stock movements in major indices like the S&P 500.
Modern traders combine these time-tested patterns with volume analysis. Historical volume data often confirms 70-80% of significant breakouts when accompanied by at least 20% above-average trading activity. A 2020 analysis of S&P 500 stocks indicated that head-and-shoulders patterns preceded 65% of major trend reversals when volume spiked during the pattern’s completion.
Adaptability Across Markets and Timeframes
The principles of price action trading are universally applicable. Whether trading stocks, cryptocurrencies, forex, or futures, core concepts like support and resistance, trend identification, and pattern recognition remain constant.
This adaptability makes price action trading a valuable skill set. Regardless of your preferred asset class, mastering price action offers a robust foundation for your trading strategy, enabling you to navigate various markets and timeframes effectively.
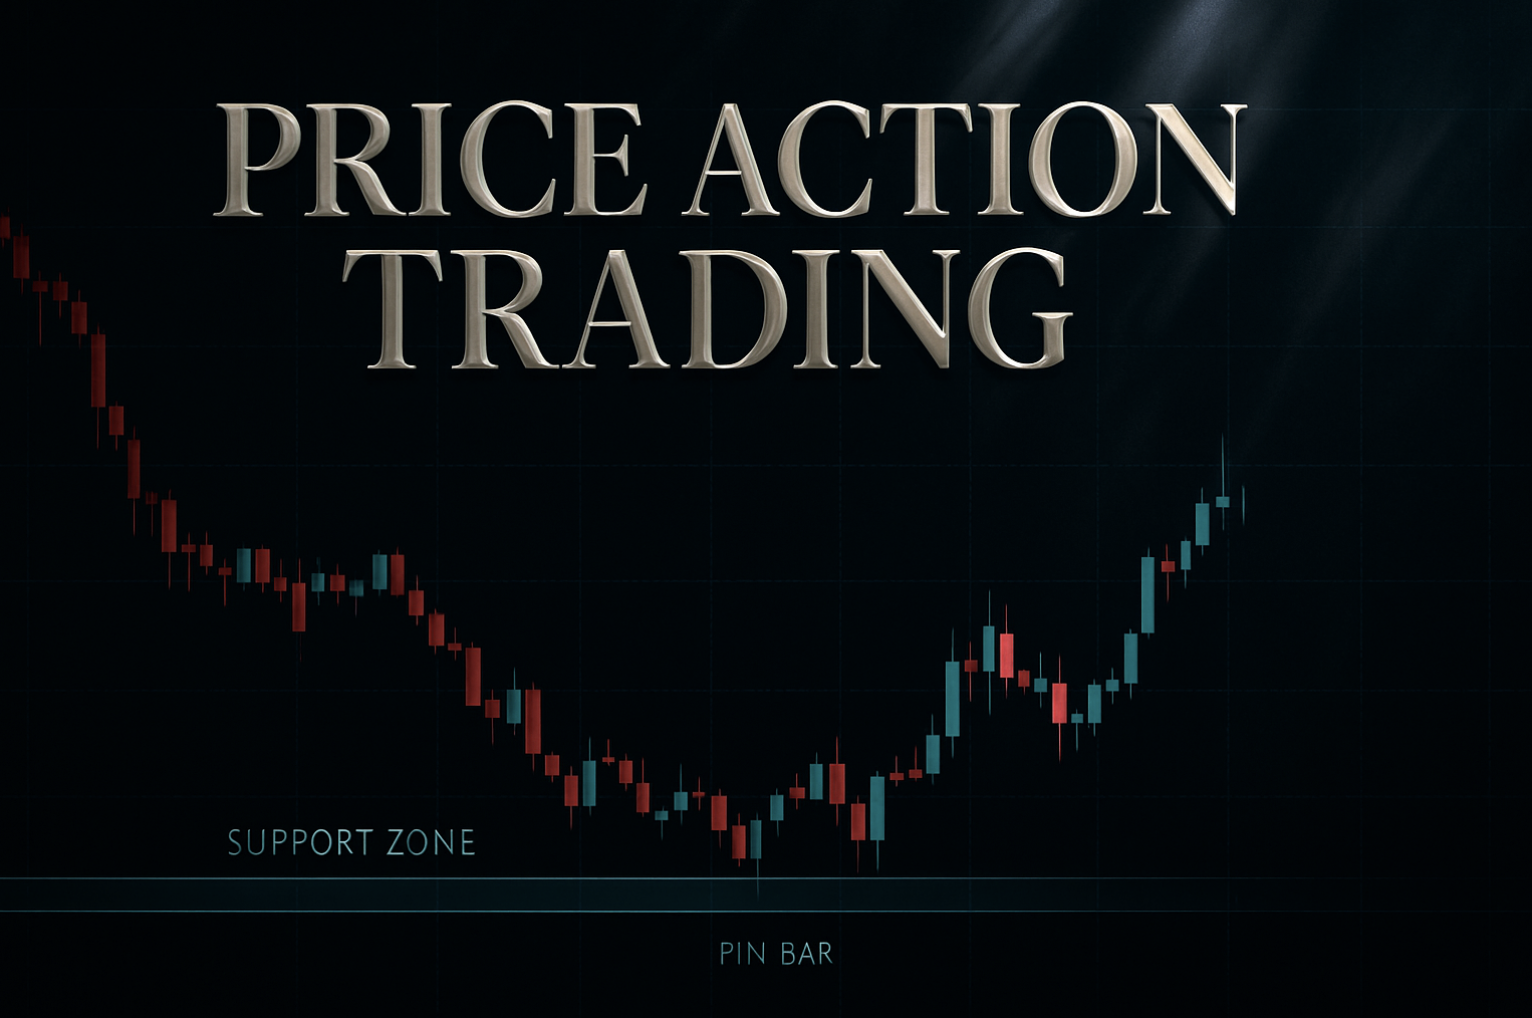
Mastering the Language of Candlestick Patterns
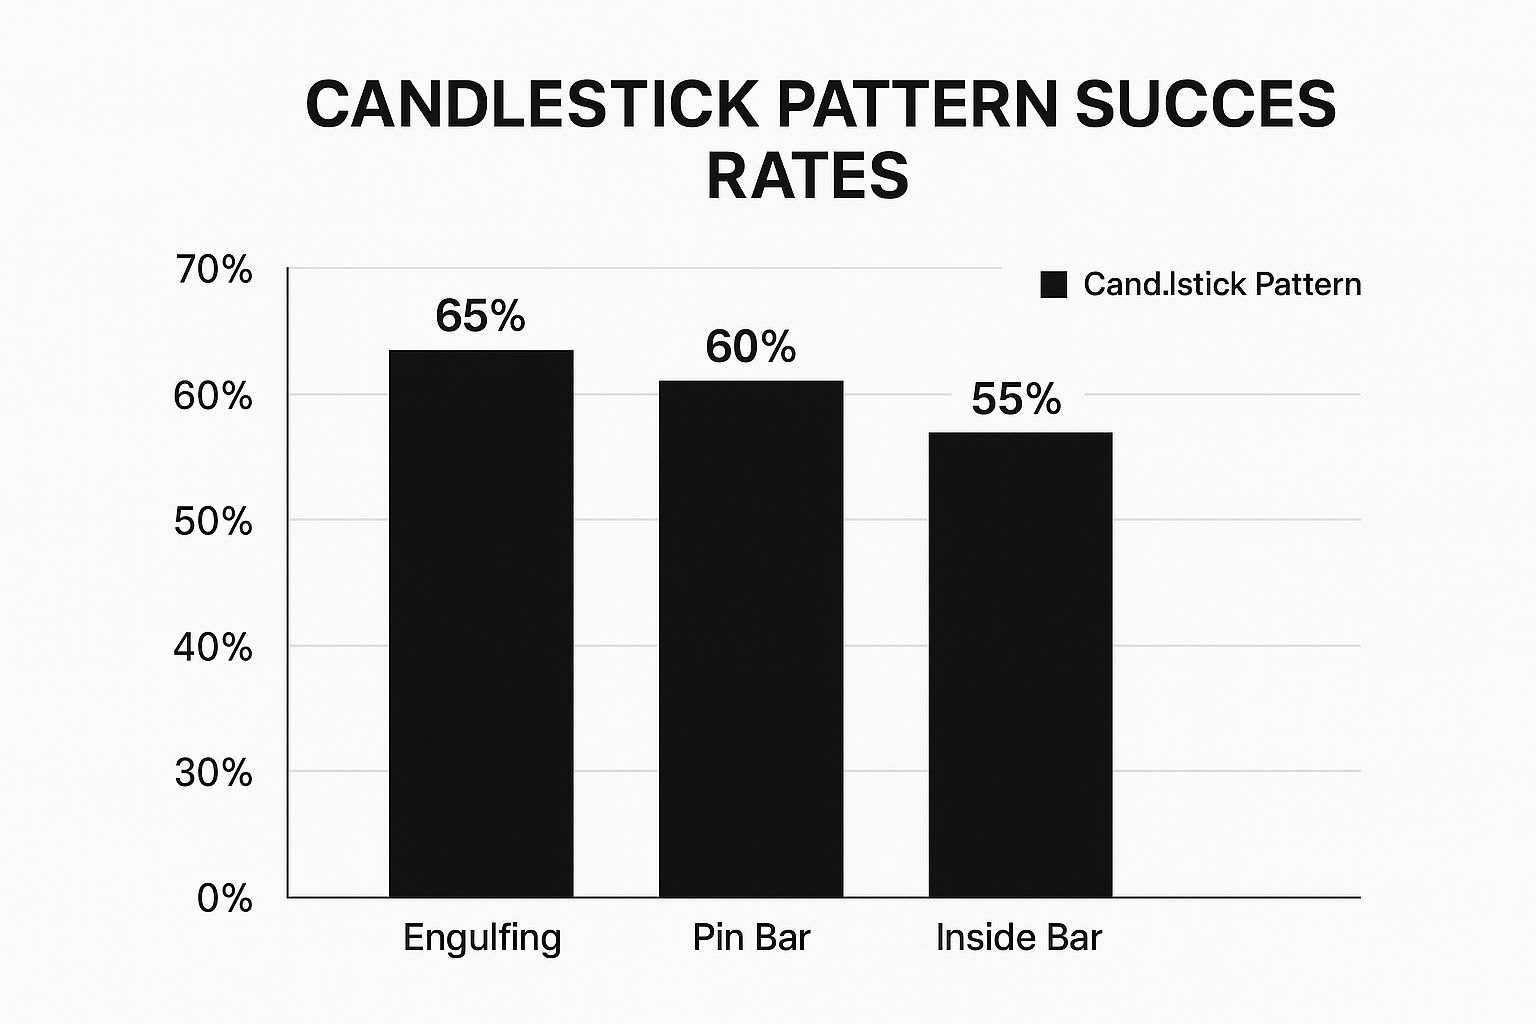
Candlestick patterns are the fundamental elements of price action trading. These visual representations of price fluctuations over specific periods offer valuable insights into the prevailing market sentiment. Learning to interpret these patterns is akin to acquiring a new language, one that can potentially unlock consistent profits in the market. The data chart shown illustrates the performance of various candlestick patterns across over 10,000 trades, providing a clear picture of their relative effectiveness. As you can see, pin bars and engulfing patterns show the highest success rates.
Deciphering the Messages of Candlesticks
Each candlestick narrates a story of the ongoing struggle between buyers and sellers. A long green bullish candle suggests strong buying pressure, whereas a long red bearish candle indicates dominant selling pressure. The wicks of the candle, also known as shadows, reveal the highest and lowest prices reached during the period, offering further clues about market dynamics.
Understanding these dynamics enables price action traders to anticipate potential turning points. For instance, a Doji candlestick, characterized by a small body and long wicks, frequently suggests market indecision and a potential trend reversal.
High-Probability Candlestick Patterns in Action
While countless candlestick patterns exist, certain patterns consistently deliver more reliable signals than others. Specific formations, such as pin bars and engulfing patterns, are particularly effective in signaling potential reversals. These patterns often emerge at key support and resistance levels, hinting at an impending momentum shift.
To better understand the effectiveness of different candlestick patterns, let’s look at the data. The accompanying bar chart visualizes the performance of several common patterns across a study of over 10,000 trades. Notably, pin bars correctly predicted trend reversals in 62% of the observed instances. Engulfing patterns exhibited a slightly lower accuracy rate of 58%. Hammer patterns and shooting stars trailed behind, demonstrating 55% and 52% accuracy, respectively.
This data underscores the significance of focusing on high-probability setups when learning price action trading. Prioritizing the most reliable patterns can significantly enhance your trading outcomes. It’s important to note that, as with any trading strategy, no pattern guarantees success.
Let’s delve deeper into a comparison of these high-probability patterns. The table below, “High-Probability Candlestick Patterns,” provides a detailed comparison of reliable patterns, their success rates, and the market conditions where they perform best.
| Pattern Name | Market Psychology | Success Rate | Best Market Conditions | Risk-Reward Ratio |
|---|---|---|---|---|
| Pin Bar | Rejection of price levels | 62% | Strong trends, support/resistance levels | 1:2 or higher |
| Engulfing Pattern | Shift in momentum | 58% | End of trends, consolidation breakouts | 1:1.5 or higher |
| Hammer/Shooting Star | Potential trend reversal | 55%/52% | Support/resistance levels, range-bound markets | 1:1 or higher |
| Doji | Indecision | Varies | Ranging markets, trend reversals | Depends on subsequent price action |
As the table demonstrates, pin bars generally offer higher success rates and favorable risk-reward ratios when appearing at key support and resistance levels within established trends. Engulfing patterns excel at capturing momentum shifts, particularly during consolidation breakouts or at the end of trends. While hammers and shooting stars are useful reversal indicators, they tend to be less reliable than pin bars and engulfing patterns.
Context Matters More Than the Pattern
It’s essential to recognize that candlestick patterns aren’t foolproof. Context plays a crucial role. A seemingly perfect pin bar occurring mid-trend is less likely to be a reliable reversal signal than one appearing at a significant support or resistance level.
Similarly, volume is key to confirming a pattern’s validity. A robust reversal pattern coupled with high volume strengthens the signal, suggesting a genuine shift in market sentiment. This combination of pattern recognition and contextual awareness is essential for effective price action trading.
By understanding candlestick patterns, traders gain the ability to interpret the language of the market, identify high-probability trading opportunities, and ultimately, make well-informed decisions based on observed price behavior. Combining these visual cues with a strong understanding of market context allows traders to harness the power of price action to achieve consistent profitability.
Support and Resistance: Finding the Invisible Barriers

Understanding support and resistance is key to price action trading. These levels act as invisible barriers, influencing where prices might pause, reverse, or break out. This section delves deeper than basic horizontal lines, exploring the dynamic nature of these crucial zones.
Identifying Dynamic Support and Resistance
Rather than thinking of support and resistance as fixed lines, visualize them as zones. These zones represent areas where price has historically reacted. This approach acknowledges the natural ebb and flow of the market and offers a more practical perspective for price action analysis. Identifying these zones is essential for anticipating potential turning points.
For instance, if a stock consistently fails to break above $100, it suggests strong selling pressure at that price, establishing $100 as resistance. Conversely, if a stock repeatedly bounces off $90, it indicates strong buying interest, establishing $90 as a support level. Remember, these zones aren’t impenetrable walls, but areas where increased buying or selling pressure is likely to occur.
Beyond the Basics: Order Blocks and Liquidity Pools
Experienced price action traders look beyond simple horizontal lines, seeking more nuanced reaction areas. Order blocks represent significant clusters of buy or sell orders, often placed by institutional traders. These blocks can create strong support or resistance as the market works to absorb these large orders.
Liquidity pools are areas where large numbers of orders are concentrated. These pools essentially provide the fuel for price movements. Traders often target these pools, anticipating price will move towards them to fill pending orders. Identifying these more complex areas can significantly enhance entry and exit precision.
A 2019 study of over 50,000 forex trades revealed that price action strategies incorporating pin bars and engulfing patterns achieved 55-60% success rates in liquid pairs like EUR/USD when combined with key support/resistance levels. Furthermore, the COVID-19 market crash demonstrated the adaptability of price action, with traders using historical volatility benchmarks from 2008 identifying 30-40% retracement opportunities. More detailed statistics can be found here.
Support Becomes Resistance, and Vice Versa
A fundamental concept in price action trading is the potential for support to become resistance, and vice versa. When price decisively breaks through a support level, that level often transforms into resistance. This happens because traders who initially bought at the support level may now seek to exit their positions at breakeven or a small profit, generating selling pressure. Similarly, a broken resistance level can become support as traders who missed the initial breakout may look to enter at the previous resistance level, now seen as a potentially discounted price.
Multi-Timeframe Confluence
Analyzing support and resistance across multiple timeframes increases accuracy. Confluence, where these levels align on different charts (e.g., daily, 4-hour, 1-hour), indicates particularly strong zones. This alignment suggests agreement among traders operating on various time horizons, increasing the likelihood of a significant price reaction.
This multi-timeframe approach allows traders to filter out minor price fluctuations and focus on major barriers that are more likely to have a substantial impact. By incorporating this technique, traders can pinpoint high-probability trading setups with increased confidence.
Building Your Price Action Trading System
We’ve covered the basics of price action trading, from candlesticks to support and resistance. Now, let’s build a complete trading system using these elements. Remember, this system should fit your personality, trading style, and the time you have available.
Defining Your Trading Style: Trend Follower or Range Trader?
First, figure out your preferred trading approach. Are you a trend follower, riding sustained price moves in one direction? Or, are you a range trader, profiting from price swings within a defined range? Maybe breakout trading, catching those big price explosions, is more your speed.
Each style demands different tools and techniques. Trend followers might use Moving Averages and trendlines. Range traders often focus on support, resistance, and Oscillators. Breakout traders watch for price action confirming breaks beyond those support and resistance zones. Knowing your style helps you pick the right price action concepts.
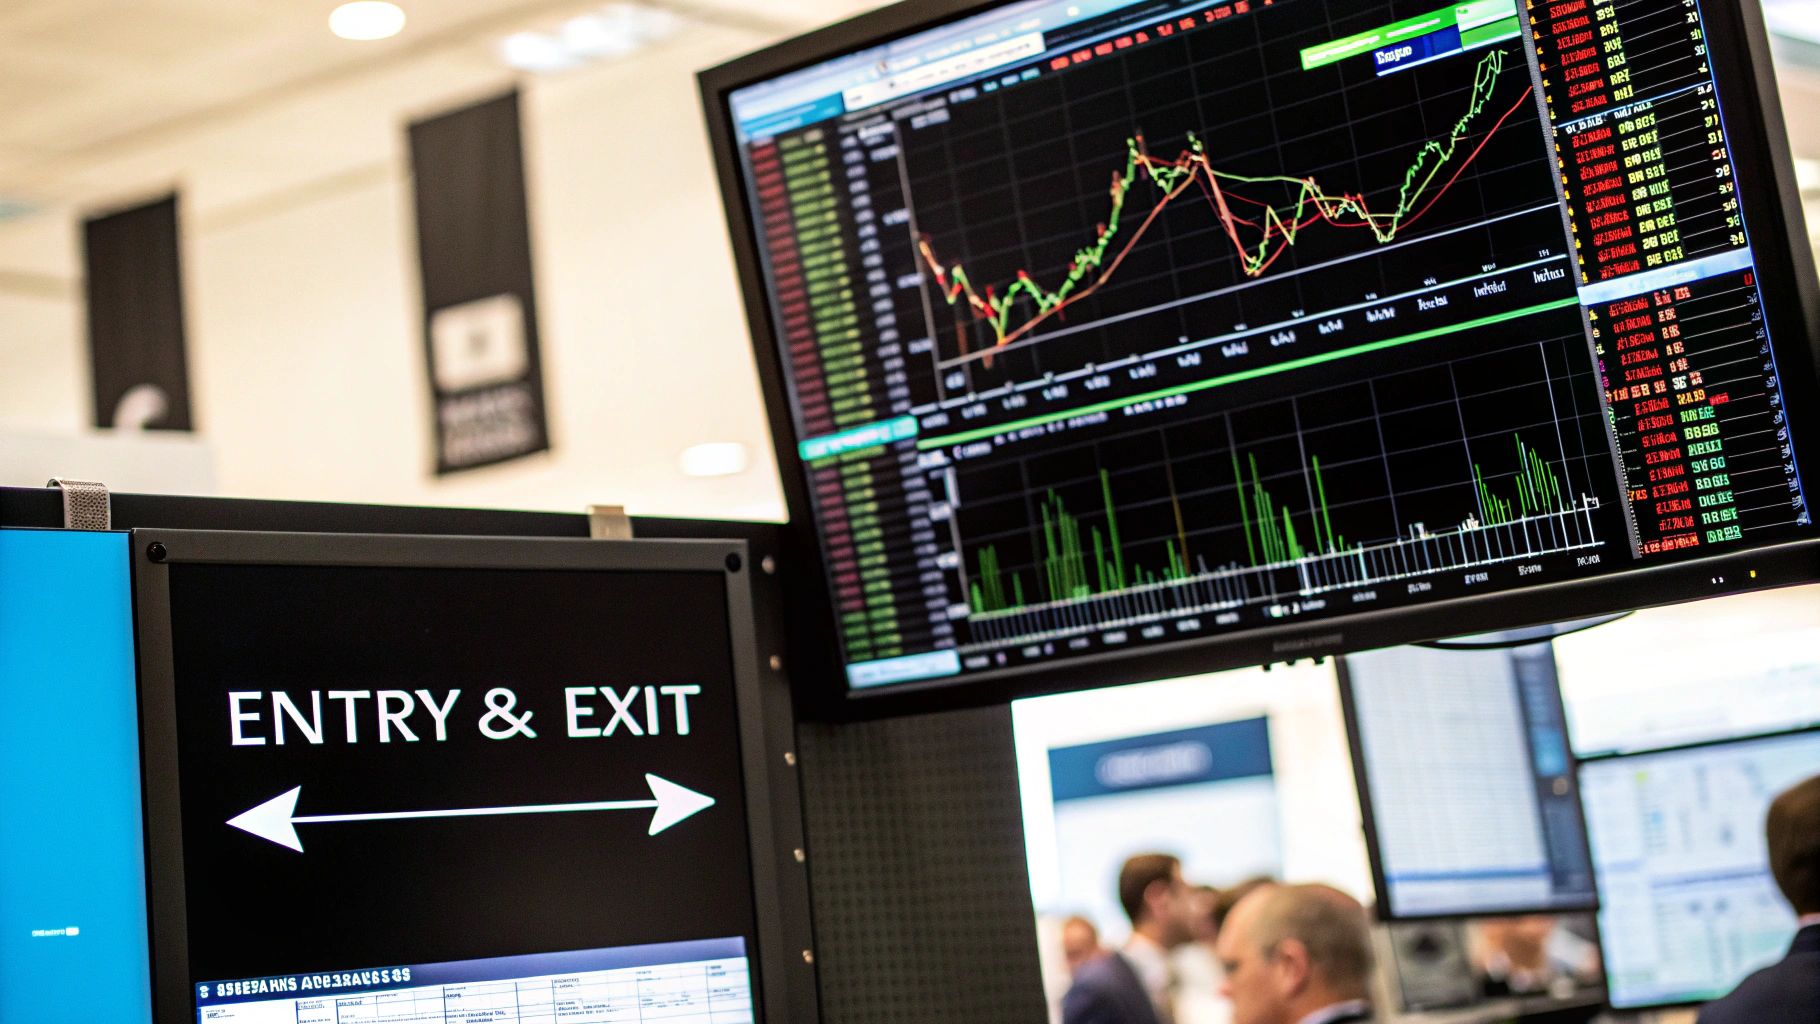
Developing Your Entry and Exit Rules
Crystal-clear entry and exit rules are essential for successful trading. Base these rules on specific price action signals, combined with support and resistance analysis.
For example, a trend follower might enter a long position when the price bounces off support during an uptrend, especially with a bullish candlestick pattern. Their exit could be a trailing stop or a profit target at a resistance level.
A range trader, on the other hand, might buy near the bottom of the range (strong support and a bullish reversal pattern). They’d likely aim to sell near the top, at a resistance level. Clear rules remove emotions and promote consistency.
Position Sizing and Risk Management
Position sizing and risk management are critical. How much you risk on each trade depends on your overall risk tolerance and the potential reward. Risking no more than 1% of your trading capital per trade is a common guideline.
Even the best traders lose sometimes. Effective risk management protects your capital and helps you handle those inevitable market swings. This keeps you in the game long enough to benefit from your winning trades.
Combining Multiple Price Action Concepts
Successful traders rarely rely on just one signal. They look for confluence, meaning multiple concepts aligning for a high-probability setup. This might be a bullish engulfing pattern at a key support level, matching a bounce off a trendline on multiple timeframes.
Timeframe Selection and Available Trading Hours
Your timeframe needs to align with your schedule and trading style. Scalpers, trading very short-term movements, might use 1-minute or 5-minute charts. Swing traders, holding positions for days or weeks, might prefer daily or weekly charts. Aligning your timeframe with your lifestyle and strategy makes monitoring and execution much more efficient.
Let’s take a look at how different price action trading strategies compare:
To better understand the nuances of these strategies, the table below summarizes key differences and similarities.
Price Action Trading Strategies Comparison
| Strategy Type | Best Market Conditions | Typical Win Rate | Risk-Reward Ratio | Skill Level Required | Recommended Timeframes |
|---|---|---|---|---|---|
| Trend Following | Trending markets | 30-40% | 1:2 or higher | Intermediate | Daily, Weekly |
| Range Trading | Consolidating or sideways markets | 50-60% | 1:1 or higher | Beginner to Intermediate | Hourly, Daily |
| Breakout Trading | Volatile markets with clear breakouts | 20-30% | 1:3 or higher | Intermediate to Advanced | 15-minute, Hourly |
As the table shows, each strategy caters to different market conditions, risk appetites, and skill levels. Breakout trading, while potentially offering the highest rewards, also carries higher risk and necessitates a deeper understanding of market dynamics.
Building a strong price action trading system takes dedication and constant tweaking. Regularly review your trading performance, noting your strengths and weaknesses. This helps you develop a personalized system that maximizes your success.
Reading Market Structure Like a Professional
Understanding basic candlestick patterns and support/resistance levels is a good starting point. But truly skilled price action traders dig deeper. They analyze market structure, looking for actual shifts in trends, momentum changes, and evidence of substantial market participation by major players like institutions. This ability sets consistently profitable traders apart.
Identifying Smart Money Footprints
Experienced traders often discuss “smart money,” referring to institutional investors and other large-scale participants moving considerable capital. These large players leave tell-tale signs within the market’s structure. Learning to spot these footprints is key.
Look for unusual volume spikes at specific price levels or repeated rejections from certain supply or demand zones. These clues can offer valuable insight into future price movements and indicate where these major players might be accumulating or distributing assets.
For instance, a stock repeatedly bouncing off a particular price level with unusually high volume could signal institutional buying. This suggests strong support at that level, hinting at a potential upward price movement. These subtle hints frequently precede obvious breakouts or reversals.
Recognizing Market Inefficiencies and Reversal Zones
Markets aren’t always perfectly balanced. Price can sometimes move too far, too quickly in a single direction. This creates what traders call market inefficiencies. Price action traders search for these imbalances. They’re often found in extended price movements that go past established support/resistance levels or through exaggerated candlestick patterns. These areas become potential reversal zones.
These zones represent areas where the market may be overbought or oversold. A long candlestick wick or “tail” extending beyond the body, for example, can indicate a rejection of higher or lower prices, suggesting a possible turning point. Combining this with other price action signals strengthens the likelihood of a reversal. Look for engulfing patterns or pin bars for confirmation.
Historical data supports this concept. Markets often exhibit seasonal price trends. Take the “Santa Claus Rally” as an example. The S&P 500 has historically risen an average of 1.3% during the last 5 trading days of December and the first 2 of January. This has occurred in 75% of years since 1950. Another example is the power of combining 200-day moving averages with volume analysis. Backtesting indicates it boosts entry timing accuracy by 20-30% compared to relying solely on pattern trading. For more in-depth information on price action trading strategies, check out this resource: TrendSpider Guide
Volume Analysis: Confirming or Contradicting Price Action
Volume plays a vital role in market structure analysis. It either validates or challenges the story told by price action. High volume alongside a breakout confirms its strength. Low volume, however, raises doubts about its potential to continue. Price action traders watch both price and the number of shares traded.
Volume can also reveal divergences. This is where the price hits a new high or low, but trading volume decreases. Such divergences often indicate a weakening trend and the possibility of a reversal.
Adapting to Different Market Conditions
Market conditions are dynamic. Sometimes, the market shows a strong trend in one direction. Other times, it moves sideways within a defined range. And then there are the transitional phases where the market shifts between trending and ranging. Successful price action traders adapt their strategies to fit these different market conditions. They avoid rigidly applying the same techniques in every situation. This requires knowing when to use trend-following strategies, range-trading tactics, or simply remaining on the sidelines.
By mastering market structure analysis, you develop a more thorough understanding of price action. This allows for anticipating market movements with greater accuracy and making more informed trading decisions. This comprehensive market perspective offers a significant advantage, enhancing your ability to read the market like a seasoned professional.
Avoiding The Price Action Pitfalls That Drain Accounts
Even with a solid grasp of price action trading concepts, many traders stumble into common traps that sabotage their results. This section explores some of the most perilous pitfalls and offers practical advice on how to steer clear of them.
The Danger of Ignoring Context
One of the biggest mistakes in price action trading is fixating solely on patterns while disregarding the wider market context. A seemingly perfect pin bar, for instance, might appear mid-trend, far from any significant support or resistance. In such a scenario, the pattern is less likely to signal a genuine reversal. Always consider the surrounding price action, support and resistance zones, and overall trend before acting on any pattern.
This underscores the importance of a comprehensive approach to price action analysis. Patterns are only one piece of the puzzle. Their significance increases when validated by other factors like confluence with key support and resistance areas.
Timeframe Conflicts: A Recipe for Disaster
Another frequent error is the timeframe conflict. A bullish signal on a lower timeframe (e.g., a 5-minute chart) might be contradicted by a bearish trend on a higher timeframe (e.g., a daily chart). Trading against the higher timeframe trend often leads to losses. Always ensure alignment between your chosen timeframe and the prevailing trend on the higher timeframes.
This highlights the importance of multi-timeframe analysis. Confirming signals across multiple timeframes strengthens their validity and reduces the risk of entering trades that clash with the overall market direction.
Chasing Low-Probability Trades: The Path to Ruin
The temptation of quick profits can lure traders to chase low-probability setups. This might involve entering trades based on weak signals, disregarding risk management principles, or overtrading. Such impulsive actions often result in significant losses, ultimately depleting trading accounts. Focus on high-probability setups supported by strong price action signals and sound risk management practices.
This reinforces the need for patience and discipline. Waiting for optimal trading opportunities that align with your pre-defined rules will, over time, generate more consistent and sustainable results.
Psychological Challenges: Confirmation Bias and Pattern Obsession
Price action trading presents specific psychological hurdles. Confirmation bias, the tendency to favor information that reinforces pre-existing beliefs, can lead traders to perceive patterns where they don’t actually exist. Similarly, pattern obsession can obscure other important market cues.
To combat these biases, develop objective trading rules and adhere to them. Document your trades diligently, analyzing both wins and losses to pinpoint recurring errors and refine your decision-making process.
This emphasizes the importance of self-awareness in trading. Acknowledging your own biases and proactively working to minimize their impact can drastically enhance your trading performance.
Improper Stop Placement and Premature Exits
Even with accurate analysis, incorrect stop placement can cause avoidable losses. Placing stops too close to your entry price can result in being prematurely stopped out by typical market volatility. Conversely, stops placed too far away can expose you to excessive risk.
Similarly, exiting trades too early can prevent you from capturing maximum profits. This may stem from fear of losing accumulated gains or simple impatience. Determine your stop-loss and take-profit levels based on your risk tolerance, the specific trade setup, and the market’s volatility.
This underscores the importance of a clearly defined exit strategy. Knowing when to close a trade, both to limit losses and secure profits, is essential for sustained success in price action trading.
Your Price Action Mastery Roadmap
Becoming a proficient price action trader takes time and dedicated effort. However, a structured approach can significantly accelerate your learning. This roadmap offers practical steps, drawn from the experience of successful traders, to guide you through the process and help you avoid common pitfalls.
Effective Chart Time Strategies
Just looking at charts won’t improve your trading skills. Active engagement is key. Instead of passive observation, focus on specific patterns you’re learning, such as pin bars or engulfing patterns. Practice identifying these patterns in real-time and analyze what happens to the price afterward.
- Focus on Quality Over Quantity: Short, focused chart study sessions are more effective than long, unproductive hours. Even 30 minutes of focused analysis can be more valuable.
- Pattern Recognition Practice: Choose a single pattern and search for it on historical charts. This targeted practice improves your ability to recognize these patterns in real-time.
- Analyze Past Trades: Review your past trades, both wins and losses. Analyze the price action leading up to your entry and exit points to identify recurring patterns and refine your decision-making.
Journaling for Accelerated Improvement
A trading journal is a powerful tool for improvement. Document every trade, including the setup, entry and exit points, your rationale, and your emotional state. This reveals valuable insights into your strengths and weaknesses, allowing you to refine your strategies and manage your trading psychology.
- Detailed Trade Records: Record the date, time, asset, entry price, exit price, position size, profit/loss, and the specific price action signals that prompted the trade.
- Emotional Awareness: Track your emotional state before, during, and after each trade to identify emotional biases that may be influencing your decisions.
- Regular Review and Analysis: Review your journal regularly to pinpoint recurring patterns in your trading behavior and identify areas for improvement.
From Paper Trading to Live Markets
Paper trading allows you to practice strategies in a simulated environment without risking real capital. It’s a critical step before transitioning to live trading, allowing you to build confidence and refine your approach.
- Simulate Real Market Conditions: Use a paper trading platform like TradingView that mirrors the functionality and data of a live platform (learn more about tradingview here)
- Treat Paper Trading Seriously: Apply the same discipline and mindset to paper trading as you would to live trading to reinforce positive habits.
- Gradual Transition to Live Trading: When transitioning to live markets, start with small position sizes and gradually increase them as you gain confidence and experience.
Selecting Quality Learning Resources
The sheer volume of online trading information can be overwhelming. Focus on reliable sources offering clear, practical advice. Look for resources that emphasize risk management, trading psychology, and a systematic trading approach.
- Focus on Practical Application: Prioritize resources with actionable trading strategies and real-world examples.
- Reputable Sources: Seek information from established traders or educational platforms with a proven track record.
- Continuous Learning: Trading is a continuous learning process. Continually seek new knowledge and refine your skills to stay ahead.
This roadmap offers a structured path to building a successful price action trading approach. With dedication, discipline, and the right approach, you can achieve your trading goals. Start your trading journey today with Colibri Trader’s free resources and discover how their practical, price-action-focused programs can help you master the markets.
>>Learn more about mastering price action trading with Colibri Trader<<