


10-Day Moving Average: Formula, Application & Strategies

The 10-day Moving Average (MA) is among the top tools to analyze the prices of numerous asset classes.
Due to the tool’s simplicity and versatility, retail and institutional players base trading approaches on Moving Averages.
Let’s look at the 10-day Moving Average formula, the interpretation, and how to apply the MA for long and short setups.
****DOWNLOAD THE FREE MOVING AVERAGES PDF EBOOK
Contents in this article
- Where does 10-Day Moving Average stand?
- What does a 10-day MA show?
- The 10-day Moving Average in three steps
- Timeframes and closing prices with Moving Averages
- How to use MA (10)?
- Trend direction validation with Moving Averages
- Reversal confirmation and Moving Averages
- Dynamic critical levels and Moving Averages
- Moving Average breakouts
- 10-day Moving Average as the part of a system
- Moving Average Types
- Final Words on Moving Averages
Where Does 10-Day Moving Average Stand?
First, let’s dig into the 10-day Moving Average positioning in the context of the trader’s toolkit.
There are two main kinds of analysis in financial markets: fundamental and technical.
Fundamentalists look at the economic data to assess what may happen to an asset in the future.
For example, if we analyze the EURUSD, we’ll need to look at the GDP or unemployment of the Eurozone and the US.
On the other hand, technicians use the asset’s price data to project where the market can go in the future.
What Does a 10-day MA Show?
Often, the absolute prices are not as crucial as their dynamics – that’s where technical indicators come in handy.
The indicators assist us in interpreting the price movements.
The 10-day Moving Average (MA) is a primary, time-tested technical indicator.
We employ 10-day MA to see the average price of an asset for the last ten days.
The average gives us a new perspective about the market, smoothening out the prices.
We can see the trend’s direction, whether the movement develops or ends, and if the prices are “normal” or overextended.
In the chart window, the MA appears as a line above, below, or at the current market price.
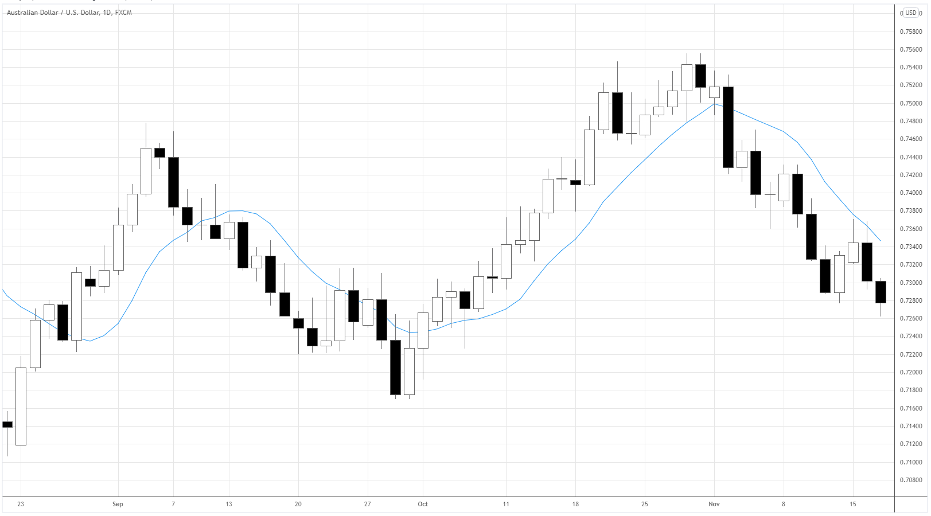
The 10-day Moving Average (see the blue line) is plotted on the AUDUSD daily chart in the illustration above.
The 10-day Moving Average in Three Steps
Let’s break down the formula of the MA.
The classic concept is called Simple Moving Average (SMA).
SMA is the arithmetic mean of ten data points.
We’ll need a set of prices over a particular period – the close prices of the last ten trading days in our case.
Next, follow the three steps to find the 10-day Moving Average.
- Get the closing prices of the last ten trading periods of an asset.
- Find the sum of the closing prices.
- Divide the sum by the number of periods.
The following is the formula of the 10-day Moving Average.
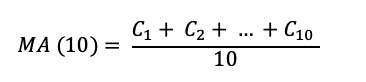
Where:
A = The close price of the day
The concept of MA came from statistics, so professionals use it in numerous ways other than financial markets.
Timeframes and Closing Prices With Moving Averages
You may be wondering what the “ten days” really mean and the specific prices that represent those days.
Traders view the market prices in different time intervals.
For instance, you may choose to analyze 1-hour, 4-hour, daily, or a weekly timeframe.
The time horizons are represented in various ways, depending on the chart type.
We’ll look at the candlestick chart as it’s a widely popular type, which vividly shows the critical price data.
Below is the candlestick chart, where each candle represents the daily price action.
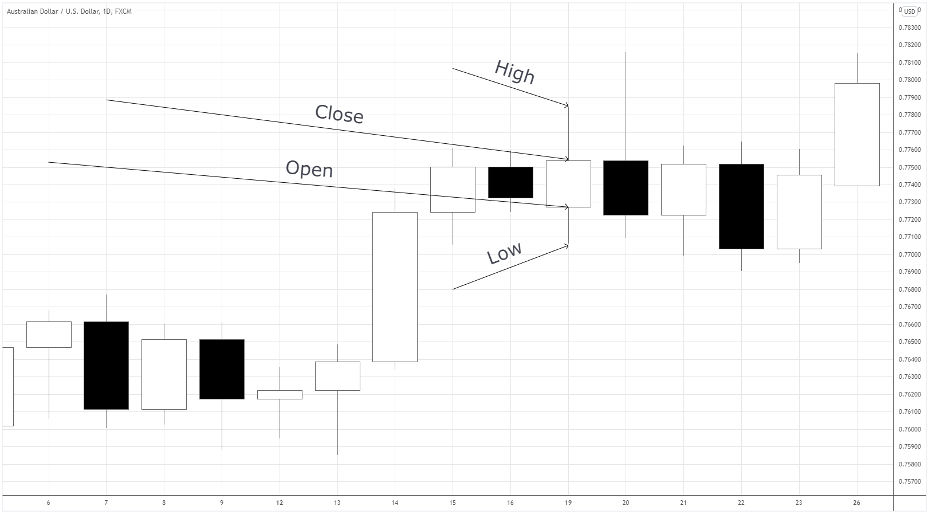
Each candlestick has four data points: open, close, high, and low.
We apply daily closing to find a 10-day Moving Average, as the final prices are considered the most critical for the trading period.
How to use MA (10)?
We’ve figured out the purpose of the 10-day Moving Average and its formula.
Now, let’s delve into the ways to apply MA (10) in trading.
Here are several ways to employ the 10-day Moving Average.
- Trend validation
- Reversal confirmation
- Dynamic critical levels
Next, we’ll look in detail at each of the approaches.
Trend Direction Validation With Moving Averages
Many solid trading systems attempt to open positions in the direction of the prevailing trend.
However, the markets are often pretty erratic, making it challenging to objectively perceive the prices’ dynamics.
It’s helpful to use the 10-day Moving Average to clarify where the asset heads.
When the asset is consistently above the MA’s line, we state it’s an uptrend (see the illustration below).
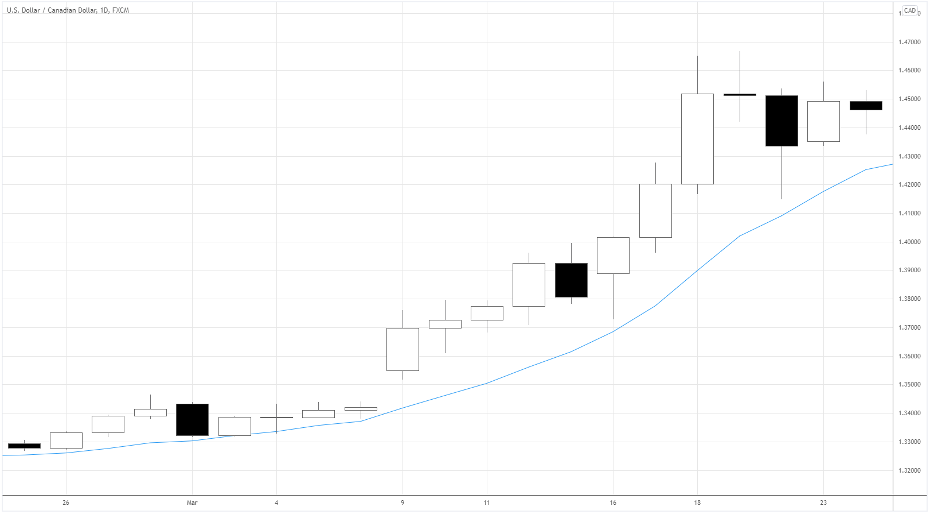
Conversely, if the asset stays below the 10-day Moving Average, a downtrend takes place.
In the illustration above, you see USDCAD staying below the MA, indicating the pair’s trend is downward.
Be aware of trading sideways markets with Moving Averages
Just like most of the things in trading, each signal of an indicator should be taken with a grain of salt.
If we don’t look at the context, sometimes the MA may misinterpret the environment, leading to false signals.
Besides an uptrend and a downtrend, the market can also enter the third condition – sideways.
In a sideways market, the MA is not effective and should be treated cautiously.
When the indicator flattens, prices cross the MA back and forth, and the market usually enters a range state.
Check the next illustration of EURCHF, where a 10-day Moving Average stays flat, signaling the absence of a trend on a daily timeframe.
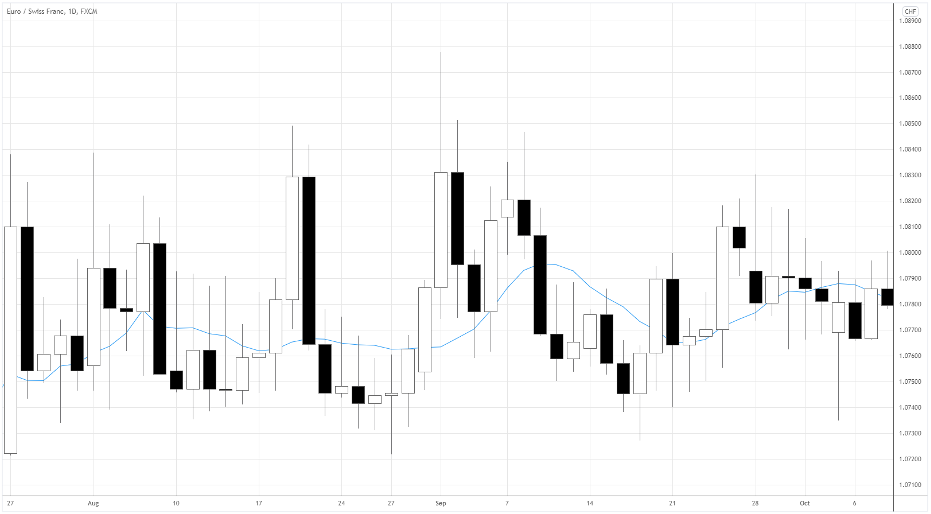
It’s impossible to know for sure if the price crossing the MA is a trend reversal or an interim consolidation.
Reversal Confirmation and Moving Averages
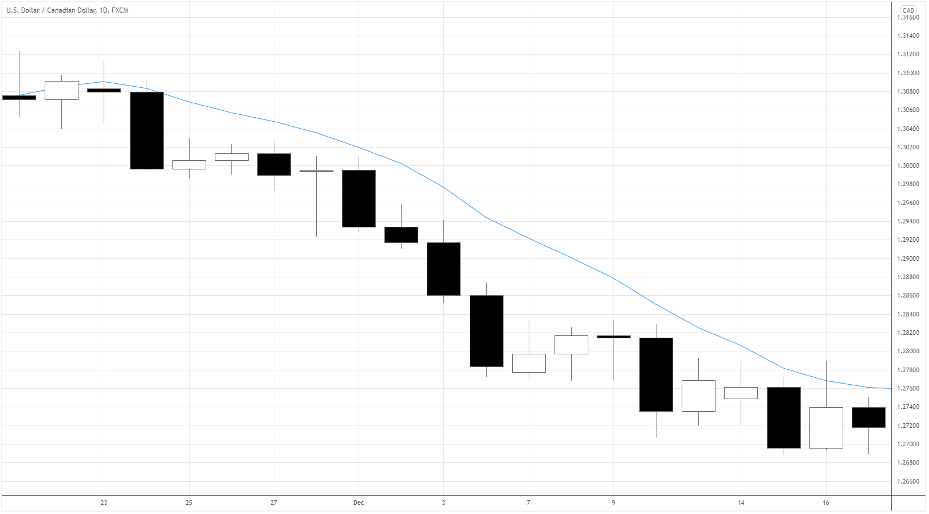
We can get a signal of a bearish reversal when the prices get below the 10-day Moving Average.
The market should stay above the MA for a while, and the crossing may result from a sideways environment.
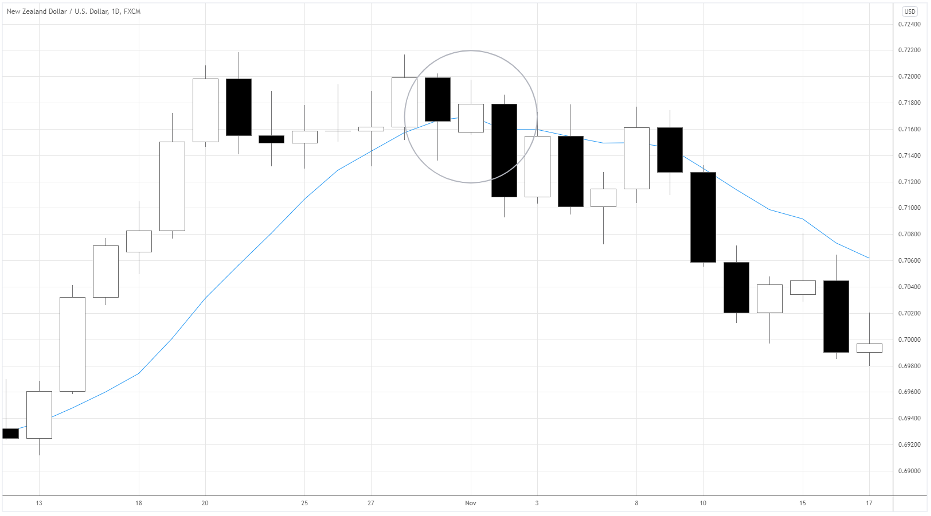
In the image below, you can see the forex pair reversing down after prices crossed below the 10-day Moving Average.
The bullish reversal works oppositely.
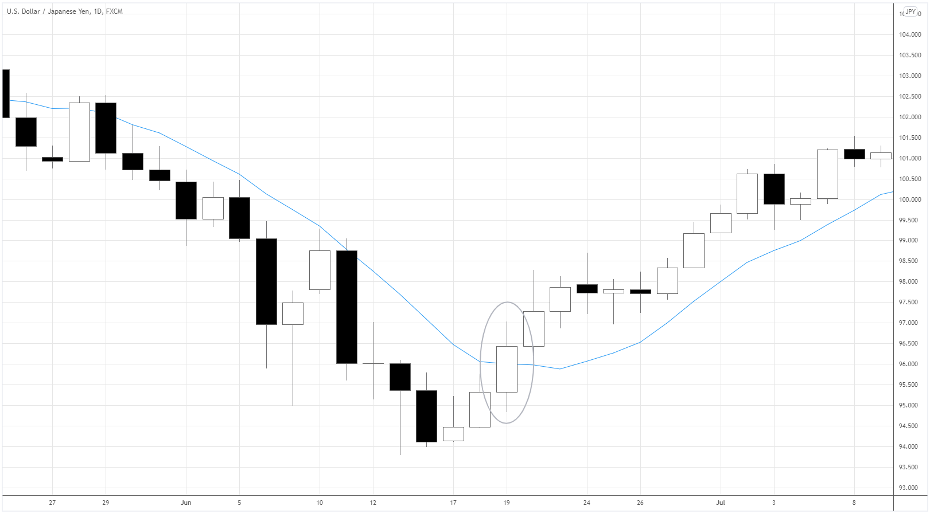
In the USDJPY illustration, the pair started growing after prices crossed the indicator from below.
Another way to find a reversal is by combing the 10-day Moving Average with the MA of a more extended period.
We get a sign of reversal when the fast MA crosses the slow MA.
Let’s combine our MA (10) with the slower one, MA (20).
The blue MA (10) moved above the green MA (20), producing a buy signal in the illustration below.
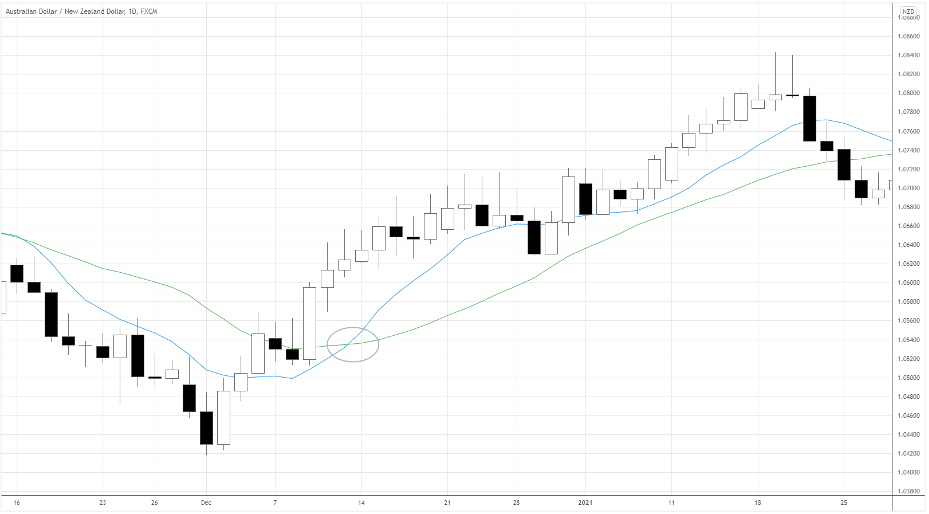
The sell signal works in the opposite way.
Dynamic Critical Levels and Moving Averages
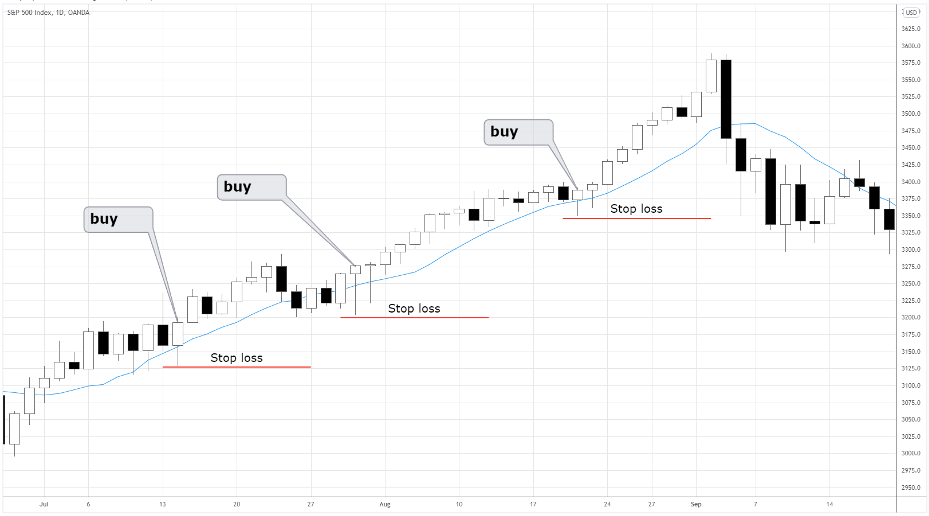
The 10-day Moving Average is an excellent way to spot the optimum entry points while limiting the risk.
In an uptrend, the MA serves as a support area.
Traders seek to open long positions slightly above the support and hide their stop losses below the critical level.
After the prices test the MA and set the protective order below the indicator or candles’ wicks, we can enter the market.
The image below shows possible buy entries and the spots to limit the risk below the 10-day Moving Average.
We would try to enter a short position in proximity to the 10-day Moving Average in a downtrend. Hide protective stop above the MA.
Moving Average Breakouts
We can even trade breakouts of the 10-day Moving Average.
It’d be helpful to have some price action skills and move to the lower timeframe.
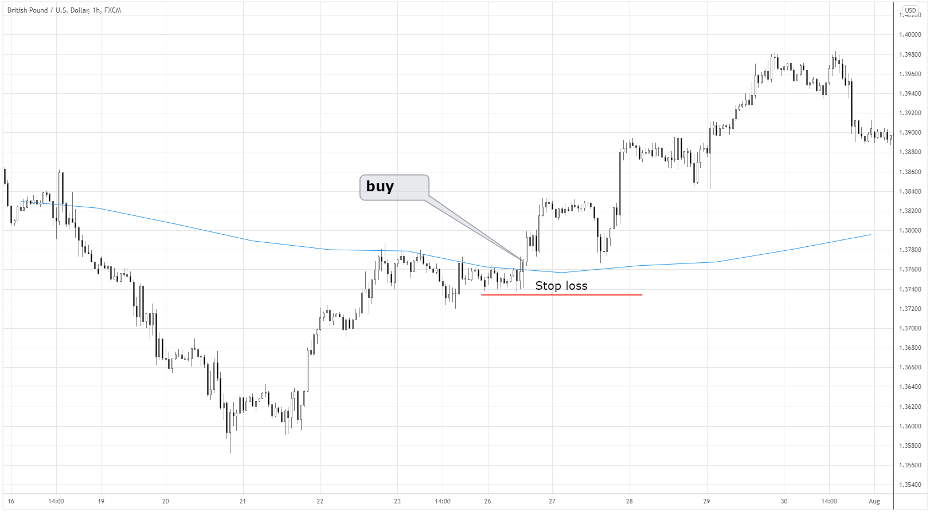
Note that the MA should still be set as 10-days, although we may work with a shorter timeframe.
The hourly chart above shows how we can buy the pair when it breaks out above the 10-day MA.
We would hide the stop loss below the MA; the opposite works for the short-sell setups.
10-Day Moving Average As Part of a System
Considering the techniques above, we can devise trading systems with a 10-day Moving Average.
Remember that an entry signal is only a part of the system.
It would be best if you also had a clear plan of how to limit losses and take profits.
When all parts of the strategy are planned and backtested, we can expect consistent profits.
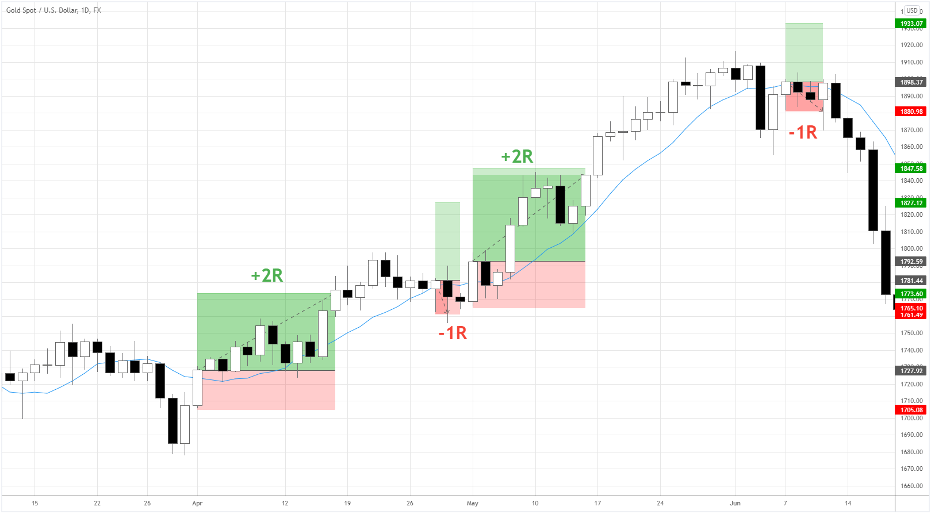
Here is the sample set of entry rules, stop loss and take profit.
- Buy entry: the day moves above 10-day Moving Average; enter at the close
- Stop loss: below the entry day’s low
- Take profit: two risks (R)
Let’s see how the system would perform backtesting it on the past market data of XAUUSD (gold spot).
Such a set of rules is pretty simple and can even be programmed as an algorithm.
You can add a discretionary twist, like “take profits at a long-term resistance” instead of a fixed two-risk target.
MA Types
There are also other varieties of MA, such as Exponential, Smoothed, and Weighted.
For instance, the Exponential MA considers recent data as more significant; thus, the line reacts better to fresh fluctuations.
On the other hand, Smoothed MA takes into account all candles equally, therefore “smoothening” data.
Final Words Moving Averages
Market participants use the 10-day Moving Average to analyze price dynamics in various assets.
The set 10-day period is universal: whether you’re a scalper or a swing trader, you’ll benefit from a 10-day MA.
Due to MA’s simplicity, the trading systems based on it are easy to implement.
They all vary in how the initial data set is modified.
Among the drawbacks are an inefficiency in a sideways environment and the lagging nature of setups.