


Divergence in Trading: Spot & Master Price Action
Most traders learn divergence in trading the same way. Add RSI or MACD, connect two highs or two lows, and treat the mismatch like an early warning siren.
That advice isn't wrong. It's incomplete.
The problem is that traders often treat divergence like a signal generator when it's really a clue about weakening pressure. Worse, they outsource that clue to an indicator that only reprocesses price instead of reading the chart itself. If you can read swings, failed pushes, candle quality, and how price behaves near key levels, you can often spot the same loss of momentum without waiting for an oscillator to tell you what already happened.
The Hidden Problem with Trading Divergence
Divergence gets sold as an early signal. In practice, traders often use it as a shortcut for calling tops and bottoms before price has turned.
That is where the trouble starts.
A market can print bearish divergence and still squeeze higher. It can show bullish divergence in a downtrend and then keep falling because the selling pressure has not changed in any meaningful way. I have seen charts print multiple divergences before the actual reversal ever showed up. Traders who treat the first one like a trigger usually learn the same lesson the hard way.
The problem is not that divergence is useless. The problem is that traders confuse slowing momentum with reversal.
Practical rule: Divergence is information, not an entry signal.
The textbook explanation is familiar. Price makes one swing, the oscillator makes another, and the mismatch is labeled bullish, bearish, regular, or hidden. That framework is fine for classification. Where trades usually break down is in the decision that follows. A weakening push is only one piece of the picture. It says nothing by itself about structure, location, or whether the other side has taken control.
Where divergence trades break down
The same mistakes show up again and again:
- Traders fade a strong trend too early. A chart making clean higher highs and higher lows is still strong, even if RSI prints a lower high.
- They ignore where the pattern forms. Divergence near a major swing high, prior resistance, or a failed breakout matters more than a random signal in the middle of the range.
- They enter on the indicator instead of the candle. The oscillator turns first, so they jump in before price confirms weakness and get caught in the next trend leg.
This is why divergence frustrates so many traders. The indicator can be technically correct while the trade is still poor.
What matters more than the indicator
A better question is simple.
Is price struggling to continue, or is the indicator just lagging behind a normal trend pause?
That answer is on the chart itself. Look at the quality of the push into highs or lows. Look at whether breakout candles are closing strong or getting rejected. Look at whether pullbacks are getting deeper, whether swings are shortening, and whether price stalls at an obvious level instead of driving through it.
That is the hidden problem with divergence trading. Traders often hand too much authority to an oscillator and not enough to price. The indicator measures momentum after the move. Price shows whether buyers or sellers are still in control right now.
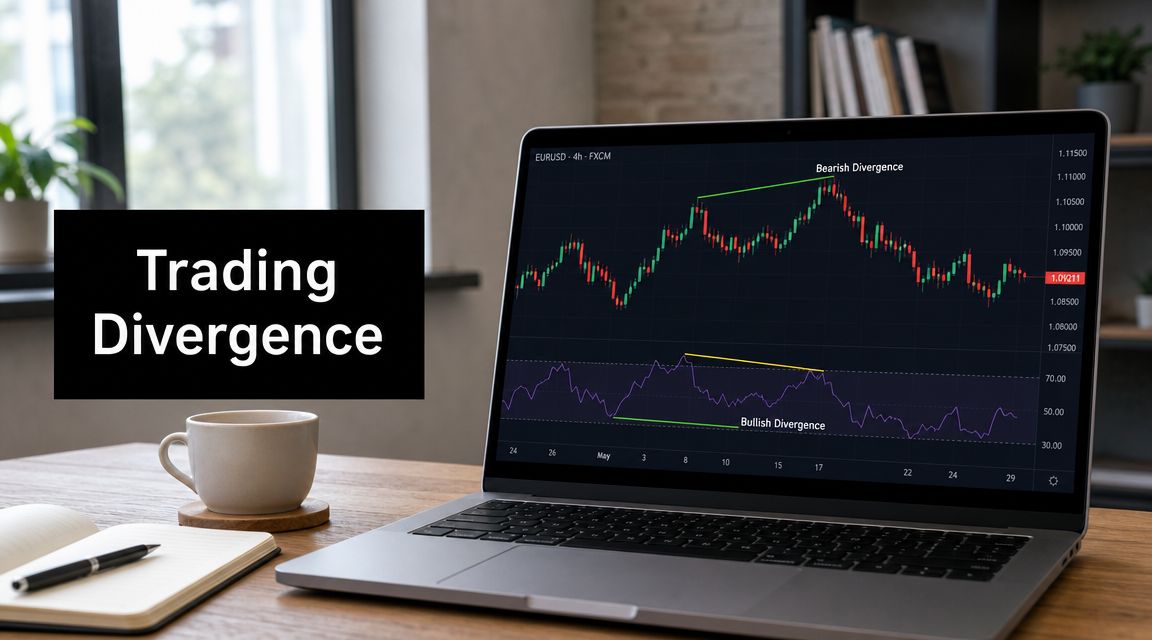
Understanding the Four Types of Trading Divergence
Divergence is a mismatch between price and momentum. The standard framework breaks it into four patterns, but the labels only help if you understand what they are really describing on the chart.

Most traders learn divergence through RSI, MACD, or stochastics. That is fine as a starting point. The better way to use these categories is to treat them as descriptions of behavior, then check whether price itself confirms the same story. If you have studied RSI bearish divergence setups in this guide, the same logic applies here. The indicator is only one translation of what price may already be showing.
The four forms at a glance
| Type | What price does | What the indicator does | Typical meaning |
|---|---|---|---|
| Regular bullish | Makes a lower low | Makes a higher low | Possible upside reversal |
| Regular bearish | Makes a higher high | Makes a lower high | Possible downside reversal |
| Hidden bullish | Makes a higher low | Makes a lower low | Possible uptrend continuation |
| Hidden bearish | Makes a lower high | Makes a higher high | Possible downtrend continuation |
Regular bullish and regular bearish divergence
Regular bullish divergence appears when price prints a lower low while the oscillator prints a higher low. Traders usually read that as downside momentum fading. In practice, it means the market pushed to a fresh low but did not do it with the same force.
Regular bearish divergence is the mirror image. Price tags a higher high, but the oscillator fails to confirm and prints a lower high. Traders take that as a warning that buyers are losing strength near the highs.
These are the divergence patterns that attract newer traders because they look like early reversal signals. The problem is obvious once you have traded them live. A market can lose momentum and still continue trending, especially if the move is pressing into open space with no meaningful resistance or support in the way.
That is why regular divergence works best as an alert, not a trade signal by itself.
Hidden bullish and hidden bearish divergence
Hidden divergence is less popular, but from a price action perspective it often lines up better with how trends continue.
Hidden bullish divergence forms when price makes a higher low while the oscillator makes a lower low. Price held trend structure even though the indicator looked weaker. That usually tells you buyers defended the pullback and did not allow the market to break the prior swing low.
Hidden bearish divergence forms when price makes a lower high while the oscillator makes a higher high. The indicator may look stronger, but price could not reclaim the previous high. Sellers kept control of the structure.
Continuation setups usually offer cleaner trade location than reversal attempts. Traders active in spot, DeFi, and derivatives trading see this often. Hidden divergence during a trend pullback is generally easier to manage than trying to pick the exact top or bottom of a fast market.
Why the distinction matters
Traders get into trouble when they treat all divergence as the same signal. The labels point to two different jobs.
- Regular divergence warns that a move may be running out of force.
- Hidden divergence suggests the trend may still be intact after a pullback.
That difference changes the trade plan. Regular divergence asks for stronger confirmation because fading momentum is not the same as a reversal. Hidden divergence fits better when market structure is already clear and you want to join the existing trend from a better price.
From a price action first view, that is the primary value of the four-type framework. It gives names to behavior. It does not replace reading swings, failed breaks, rejection candles, and trend structure on the chart itself.
How Traders Traditionally Identify Divergence with Indicators
The textbook method is straightforward. Plot price on the chart. Add a momentum oscillator below it. Then compare swing highs and swing lows on both.

Most traders use RSI, MACD, or stochastics for this job because divergence is generally applied to momentum-based oscillators rather than lagging tools like moving averages, and traders are also advised to combine it with confluence instead of using it alone, as explained in Schwab's guide to chart divergences.
The textbook process
Here's how traders usually do it:
Mark clear swing points on price
They identify two recent highs or two recent lows.Compare those same points on the oscillator
If price makes a higher high but RSI or MACD makes a lower high, they label it bearish divergence. If price makes a lower low but the indicator makes a higher low, they label it bullish divergence.Add confirmation tools
They often use support and resistance, trendlines, candlestick patterns, or moving averages to avoid taking every signal blindly.
A trader working through crypto, forex, or multi-market execution might use the same concept across spot, DeFi, and derivatives trading, because the logic of momentum disagreement applies across instruments. The tool changes less than the context does.
Why the method appeals to traders
This approach is popular because it gives visual structure to something otherwise abstract. Momentum is hard to see for a new trader. An oscillator turns it into a line that looks easy to compare.
That's also why many traders start with RSI-specific examples, including setups like RSI bearish divergence in practice. The chart gives them a template they can repeat.
The indicator doesn't create the setup. It only translates price into another format.
The weakness in the traditional approach
The classic method has one obvious advantage. It trains your eye to notice when new price extremes aren't being confirmed.
It also has a serious flaw. Traders can become dependent on the oscillator and stop reading the actual auction. They focus on matching lines instead of asking harder and more useful questions:
- Is the breakout clean or labored?
- Did price reject quickly from the new high or low?
- Are pullbacks getting deeper?
- Is the market still respecting trend structure?
Those answers often matter more than the oscillator itself.
Seeing Divergence Directly Through Price Action
The best way to use divergence in trading is to stop treating it as an indicator event and start treating it as a price behavior problem. Momentum loss shows up on the chart before most traders give it a name.

If price is rising but each new push is weaker, less decisive, and more heavily rejected, you're looking at the same story an oscillator is trying to summarize. The difference is that price shows it raw. No smoothing. No extra layer. No split attention between the chart and a lower panel.
What weakening momentum looks like without indicators
A healthy trend usually has a rhythm. In an uptrend, buyers push to new highs with conviction, pullbacks stay controlled, and candles often close well off the lows. In a downtrend, sellers press lower cleanly and rallies struggle to reclaim prior breakdown points.
When that rhythm starts to break, you don't need RSI to alert you.
Look for these clues:
- Shorter thrusts: New highs or lows extend less distance than earlier swings.
- Deeper pullbacks: Countertrend moves start biting back harder.
- Poor closes: Bull candles stop closing strong near the highs, or bear candles stop finishing near the lows.
- Fast rejection at extremes: Price breaks a prior swing and quickly snaps back.
- Failure to follow through: A breakout prints, then stalls almost immediately.
That cluster of behavior tells you the same thing divergence is supposed to tell you. Pressure is fading.
Read the swing structure first
Price action outperforms indicator dependence. Structure gives you context.
If an uptrend keeps printing higher highs and higher lows, one bearish divergence signal means little on its own. But if the latest higher high forms after multiple labored pushes, a long upper wick, and a break back below a minor support shelf, now the warning has teeth.
A simple way to read this is:
| Price behavior | What it often suggests |
|---|---|
| Clean expansion and shallow pullback | Trend still healthy |
| New extreme with weak close | Exhaustion risk |
| Repeated failure near prior high or low | Pressure is fading |
| Break of recent swing structure | Possible shift, not just slowdown |
This is the same philosophy behind learning to trade without indicators. You're reading the source instead of the derivative.
Chart-reading rule: If you can explain the struggle from candles and structure alone, the oscillator is optional.
Focus on location, not just pattern
A bearish divergence idea near random mid-range price action is weak. The same loss of momentum near a weekly resistance zone, after an extended run, matters more.
A bullish divergence idea after a long selloff into prior demand matters more than the same shape in a choppy center of the chart.
That's why experienced traders don't just ask whether momentum weakened. They ask where it weakened and who is likely trapped.
Price action gives faster decision points
Indicators often make traders wait for visual confirmation on the lower panel. Price action gives you earlier, more actionable signs:
- a failed auction beyond a prior high
- an engulfing rejection near resistance
- a lower high after a stretched rally
- a break in trendline behavior
- a loss of support after repeated hesitation
For traders who want to see this logic in motion, this walkthrough helps:
The practical edge of chart simplicity
A clean chart forces better thinking. You stop asking, "What does my indicator say?" and start asking, "Who failed here?"
That shift matters. Traders who rely too heavily on divergence indicators often end up taking a pattern out of context. Traders who read price first usually see the same weakening pressure and then demand proof from the chart before acting.
That isn't anti-indicator. It's just better sequencing. Price first. Interpretation second. Execution only after confirmation.
Common Mistakes and How to Manage Divergence Trades
Most divergence losses don't come from spotting the pattern wrong. They come from trading it badly.
Divergence is commonly treated as a leading clue, but its reliability depends on context such as trend strength and timeframe, false signals are common, and it's better used as a timing and risk-management tool with confirmation rather than as a standalone entry trigger, as discussed in OANDA's divergence analysis.

The mistakes that keep repeating
Some errors are almost universal:
Entering on divergence alone
The mismatch appears, and the trader hits buy or sell before price confirms anything.Fighting strong trend structure
A single regular divergence setup against a clean trend usually isn't enough.Using vague stops
Traders place stops where the account size feels comfortable, not where the chart proves them wrong.Overtrading every signal
Divergence appears often, especially if you force swing points.Ignoring timeframe conflict
A setup on a lower timeframe can run straight into higher-timeframe structure.
A divergence setup gets stronger when the chart also shows a failed breakout, a key level reaction, or a break in recent structure.
A practical management framework
A simple process works better than a clever one.
First, define the market condition.
Is the market trending cleanly, grinding, or chopping sideways? Hidden divergence can fit trend continuation. Regular divergence often needs more evidence if you're trying to catch a reversal.
Second, wait for price to confirm.
That can be a break of a recent swing, a rejection candle at support or resistance, or loss of control by the prior trend side.
Third, place the stop where the setup fails.
For a bearish idea, that usually means beyond the swing high that shouldn't be broken. For a bullish idea, beyond the swing low that should hold.
Fourth, plan the exit before entry.
The next structural level is often more useful than a random target. If the nearest support or resistance leaves little room, skip the trade.
Risk management matters more than pattern quality
Even a clean divergence read can fail. That's why execution matters more than being "right" about the concept.
A few habits improve survival:
- Cut invalid setups quickly: If price breaks the level that invalidates your idea, get out. This mindset is central to learning how to cut losses without hesitation.
- Reduce size in weaker contexts: A countertrend divergence setup deserves more caution than a continuation setup with trend support.
- Pass on cluttered charts: If the swing points are ambiguous, the setup probably is too.
The trader's job isn't to prove divergence works. It's to manage risk when pressure appears to shift.
The Colibri Trader View Why Price Action Is King
A simple fact governs divergence trading. Traders usually do not need another indicator. They need to read the chart better.
Divergence gets taught as if the oscillator found something price could not show on its own. It did not. The oscillator is derived from price, so the signal is always secondhand. By the time many traders spot a clean divergence line on RSI or MACD, the more useful information was already sitting in the swing structure, the size of the pushes, and the way price behaved at a key level.
That is why a price-action-first approach holds up better in live trading. It keeps the focus on what moves the trade decision: Is momentum fading into resistance? Is a trend pullback staying shallow and controlled? Did buyers fail to extend after a strong leg? Those reads come from the chart itself, without waiting for an indicator to translate them.
Indicators still have a place. They can confirm a read or help a newer trader organize what they see. The trade-off is delay and dependence. If the indicator is doing all the seeing, the trader is usually late, hesitant, or forcing setups that look cleaner in the pane below price than they do on the chart.
That shift matters for traders who want to simplify trading with price action. Clean chart reading usually gives the same clue earlier and with better context. You are not just spotting a mismatch between price and momentum. You are judging whether the market is accepting higher prices, rejecting lower prices, or stalling in the middle of noise.
Colibri Trader teaches that style directly. The focus is on structure, levels, candle behavior, and risk management rather than indicator dependence.
Divergence still has value. Treat it as supporting evidence, not a standalone reason to trade. Read price well first, and divergence becomes easier to use, easier to filter, and much less likely to pull you into weak setups.
If you want to build that skill with a cleaner, price-action-first framework, explore Colibri Trader. It focuses on reading structure, managing risk, and trading without clutter so you can make decisions from the chart itself.