




Day Trading Strategy That Works: A Price Action Plan

Most day trading advice starts with a signal. Find a candlestick pattern, add an indicator, wait for confirmation, and assume the next move will pay for the last one. That approach skips the part that decides whether a strategy survives: costs, position size, drawdown, and repeatable execution.
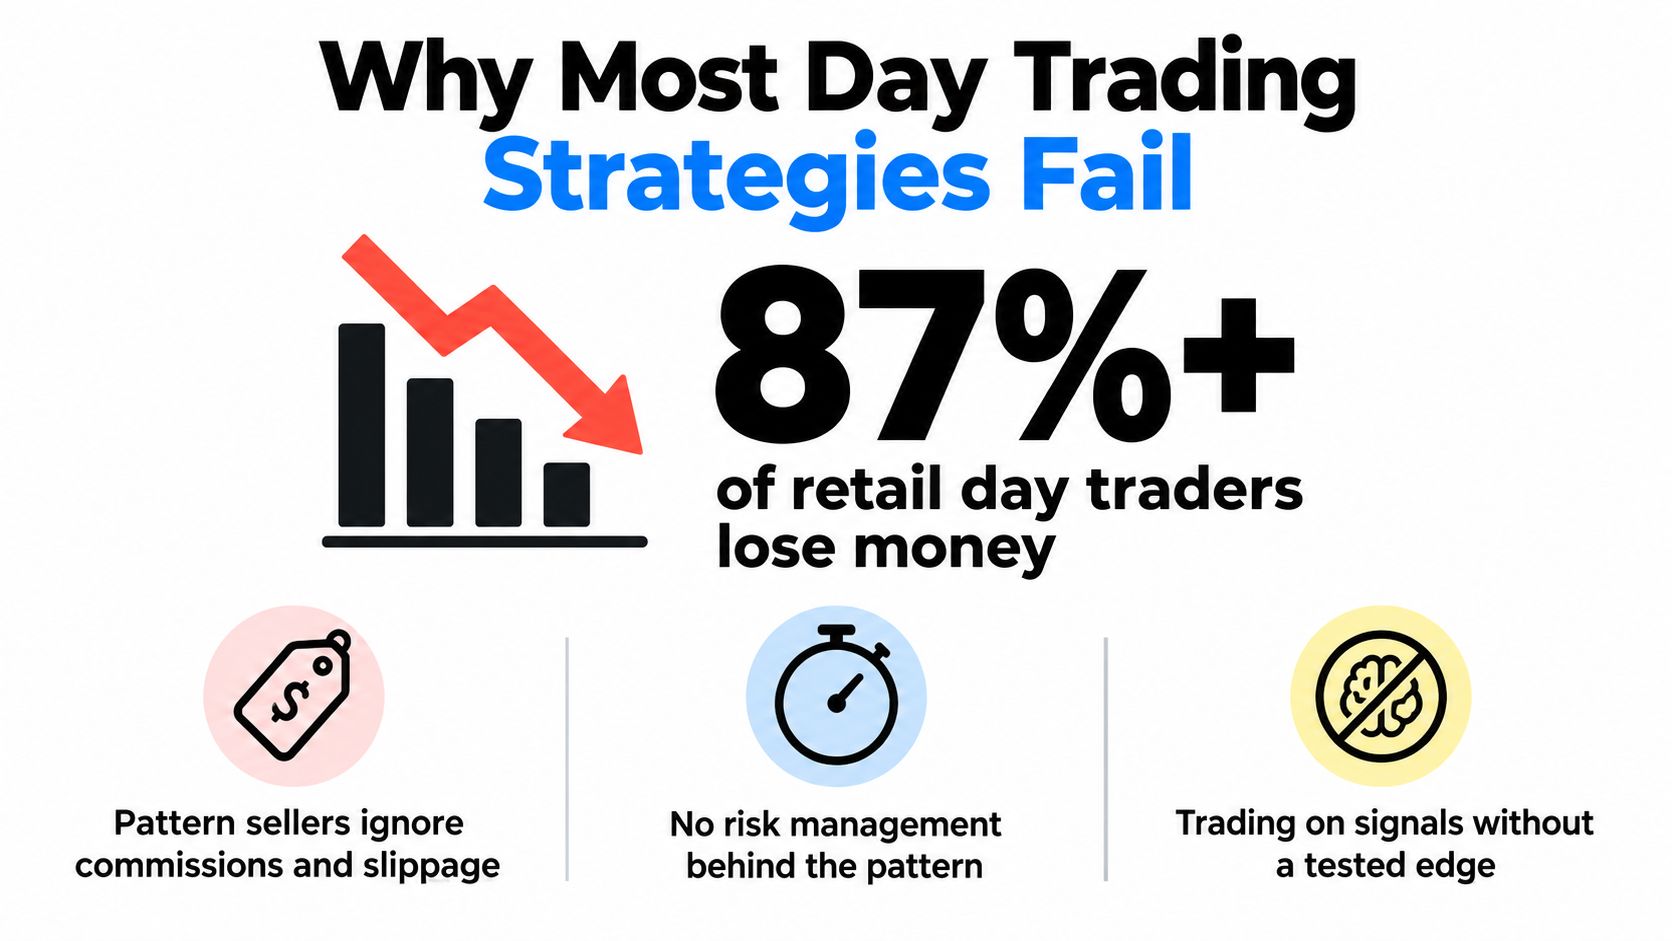
A University of California Berkeley study of about 360,000 day traders found that only about 13% earned profits net of fees in a typical year, while fewer than 1% consistently outperformed over time. The same research found that roughly 87% lost money on an unconditional basis. The Berkeley study on day trading skill is a useful starting point because it shifts the question from “Which pattern wins?” to “What process can remain profitable after friction and losing trades?”
The playbook below uses price action, stocks in play, defined stops, and controlled exits. It won't predict every intraday move. It gives you a framework for taking fewer trades, sizing them coherently, and finding out through testing whether your edge is real.
Why Most Day Trading Strategies Fail Before They Start
A candlestick pattern does not create an edge on its own. An engulfing candle at a random price only records recent buying and selling. It becomes useful when it appears at a meaningful level, on a liquid instrument, after a catalyst, and with a stop distance that leaves room for the trade to work.
The Berkeley research provides a hard starting point: the large majority of day traders lost money, while only a small minority remained profitable after fees. The underlying study matters because commissions, spread, slippage, and overtrading decide whether a small theoretical edge reaches your account. A setup can look attractive on a chart and still fail after execution costs.
A trader can also be directionally right and lose. Buying a breakout late often means a worse entry, a wider stop, and more slippage. Repeating that process turns several small losses into a drag that average winners may not cover.
The survival conditions
A day trading strategy earns real capital only after it meets three operating requirements:
- A defined edge with a meaningful sample. Test at least 100 trades before drawing conclusions. Use the same market, setup, entry, stop, and exit rules you plan to trade live.
- Controlled trade risk. Risk 0.5% to 1% of account equity per trade, and calculate the dollar amount before sending the order.
- A hard daily stop. Close the desk after two consecutive losses, or use a daily loss ceiling of 2% to 3%, applying whichever rule is stricter for your account.
These are guardrails, not promises of profitability. They limit the damage from a bad session and keep one emotional decision from changing the size of every later trade.
Practical rule: If you cannot explain the setup, invalidation point, and maximum dollar loss before entry, you do not have a trade.
Pattern-hopping replaces measurement with mood. After a failed breakout, a trader may switch to moving-average pullbacks, then try a reversal pattern after the next loss. That sequence produces no reliable sample because the rules keep changing.
Start with survival conditions, then test whether the entry has an edge.
The Price Action Foundation You Actually Need
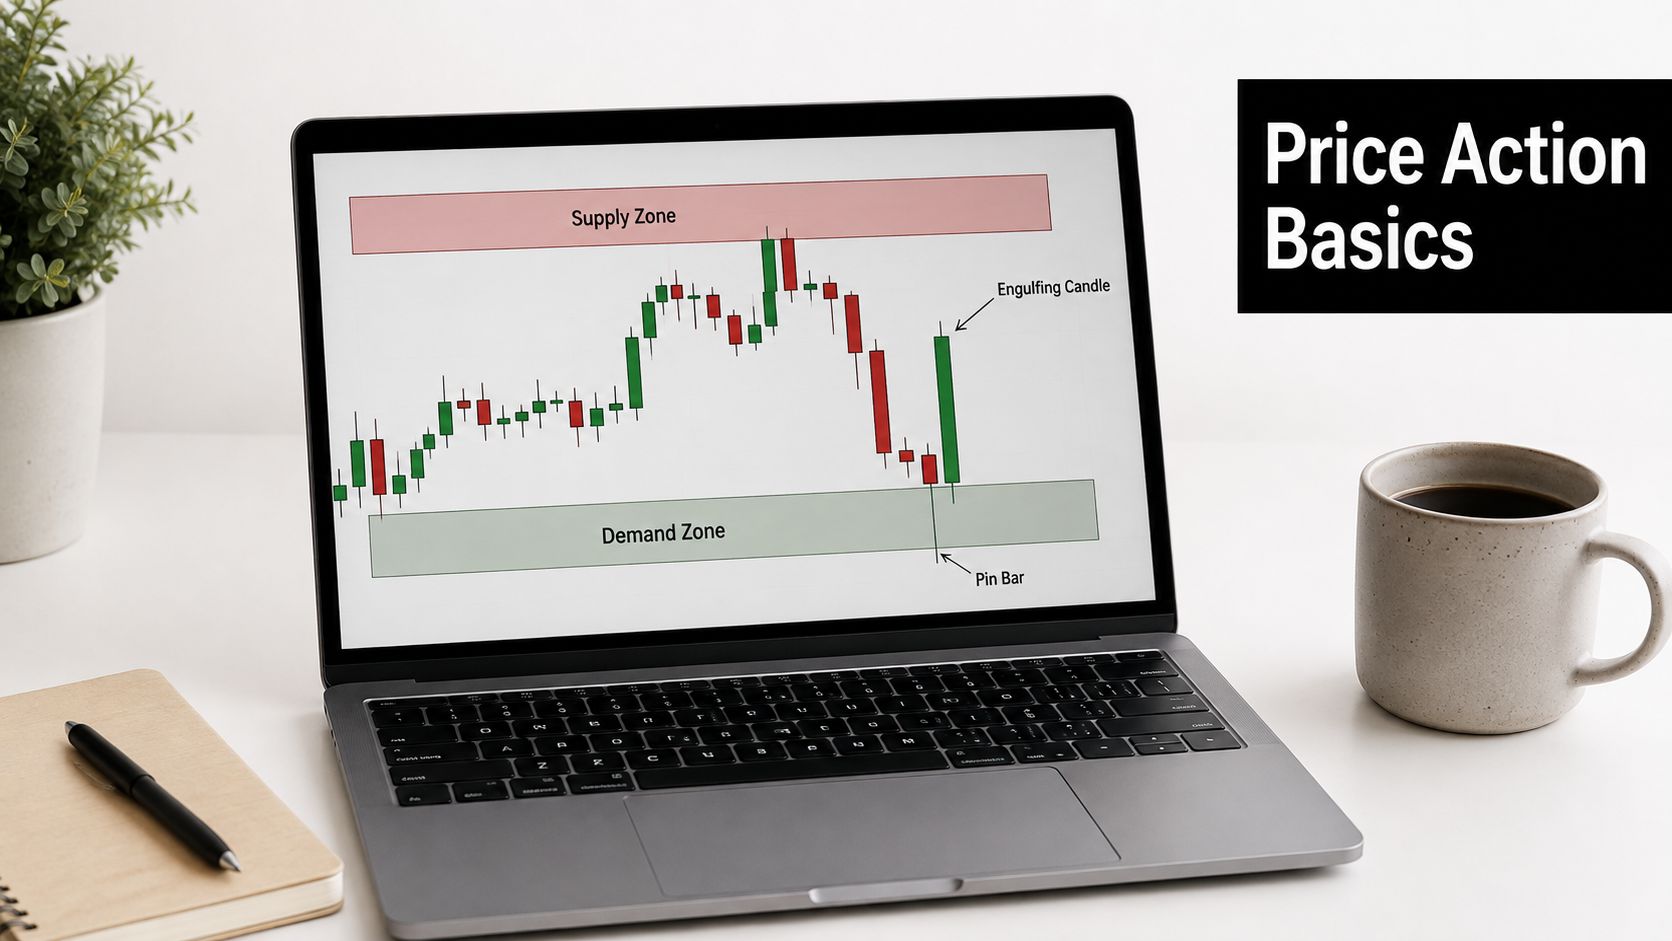
Keep the chart simple. This approach uses horizontal supply and demand zones, engulfing candles, and pin bars. The candle is the trigger, but the zone supplies the context.
A zone begins with a base of two or more candles where price pauses before a decisive move. Mark the compact area around that pause, then wait for price to return. The first retest is usually the cleanest test because the level hasn't been repeatedly consumed by trading.
A bullish demand zone forms before an impulsive move higher. A bearish supply zone forms before a strong move lower. Don't draw every minor pause. The level should explain a visible expansion in range or momentum.
Confirmation belongs at the level
An engulfing candle confirms that one side has taken control. For this playbook, the candle must close through the midpoint of the zone. A wick that merely touches the area isn't confirmation.
A pin bar signals rejection. The wick must be at least twice the length of the body to qualify. A hammer at demand can support a long entry. A shooting star at supply can support a short entry. In both cases, the wick needs to reject a level that already matters.
The mistake is trading the pattern in isolation. A perfect-looking hammer in the middle of a range is just a hammer. A shooting star directly below a well-tested supply zone, after a catalyst-driven extension, gives you a defined place to act and invalidate the idea.
For a detailed explanation of the broader method, use this price action trading guide.
A practical short example
Suppose a stock gaps higher after an earnings announcement. On a 15-minute chart, it forms a tight base between 9:45 and 10:00, then pushes upward before returning to that range. When price prints a bearish engulfing candle back into the base and closes through the zone's midpoint, the short setup becomes valid.
The stop belongs above the rejection high or the supply zone, depending on which gives the trade a clear invalidation point. The target should be the next demand area or a pre-defined multiple of the initial risk. If price only taps the range and produces no qualifying candle, skip it.
This is a reaction plan, not a prediction contest.
Scanning for Stocks in Play and Confirming Entries
The best setup is useless if the symbol has no reason to move or can't absorb your order. Build the watchlist before the opening bell, then let price earn your attention.
Start with stocks gapping 5% to 7% above average volume. Add a catalyst column for earnings, an FDA decision, sector news, or an analyst action. A gap without a cause can fade quickly, while a catalyst gives you a reason to expect participation. This isn't a guarantee of continuation. It's a filter for where attention may already be concentrated.
Then remove weak candidates:
- Relative volume: Reject symbols below 1.5 times their normal volume.
- Float: Reject names with a float above 100 million shares when your plan depends on concentrated momentum.
- Liquidity: Check the spread and the depth before considering an entry.
- Structure: Mark the pre-market high, pre-market low, and any compact base created before the open.
The selection logic is consistent with research on “stocks in play.” An academic study of liquid U.S. equities focused on names with clear catalysts and unusually high relative volume, using a top-20 portfolio that produced over 1,600% total net performance, a 2.81 Sharpe ratio, and 36% annualized alpha in its tested framework. Those figures describe that study's methodology and period, not a retail trader's expected return. Read the SSRN study on stocks in play.
The opening confirmation
Don't enter just because the stock gaps. At the open, require price to hold above the pre-market high for three candles before a long setup is valid, or below the pre-market low for three candles before a short setup qualifies. This keeps the first burst of volatility from dictating the trade.
Your entry checklist has five yes-or-no questions:
- Is there a clear catalyst?
- Does the level contain a prior base?
- Is there a confirming engulfing candle or pin bar?
- Is the spread below 0.05% of price?
- Is the setup forming between 9:45 and 11:30, or after 14:00?
One “no” means no trade. Don't negotiate with a checklist while watching a fast candle.
A watchlist you can copy
Create columns for ticker, catalyst, gap, relative volume, float, pre-market high, pre-market low, nearest zone, and planned direction. During the session, add the confirmation time and the precise invalidation level.
If a candidate gaps higher on earnings, clears its pre-market high, and returns to a demand base with a bullish engulfing candle, it stays eligible. If it breaks the level on heavy selling or the spread widens, remove it. The watchlist should shrink as the session develops, not expand because you feel bored.
Position Sizing and Risk Rules That Keep You in the Game
Position sizing converts a chart idea into a controlled financial decision. The formula is simple:
Shares = risk dollars ÷ stop distance
If your account is $5,000 and you risk 1%, your maximum planned loss is $50. A $0.10 stop permits 500 shares, assuming the stop fills as planned and excluding trading costs. That doesn't mean you should automatically use the maximum. It means the share count follows the stop, not the stock's headline price.
A common error is trying to scale a $5,000 account to a $50 position with a $0.10 stop. That would mean only 500 shares, or $50,000 in notional exposure, which is far larger than the account and may be unsuitable or unavailable depending on the broker and instrument. The risk number must remain the anchor.
Worked examples
| Setup | Account Size | Risk % | Stop Distance | Shares | Dollar Risk |
|---|---|---|---|---|---|
| Tight stop on a $20 stock | $5,000 | 1% | $0.10 | 500 | $50 |
| Volatile $50 momentum name | $5,000 | 1% | $0.50 | 100 | $50 |
| Maximum-loss day | $5,000 | 2% daily cap | Determined before entry | Based on stop | $100 maximum |
The second example shows why volatile names need smaller share counts. If the chart requires a $0.50 stop, using the same 500 shares would risk $250, not $50. Scaling to volatility, including ATR as a context measure, prevents a news-driven name from becoming an oversized position.
Trading costs also change the required move. If commissions and ECN fees total $0.04 round-trip, a trader needs a 0.2% price move just to clear those costs under the stated example. This position management guide explains how entry risk, stop placement, and trade management fit together.
The order-ticket check
Before submitting, verify:
- Risk dollars: Is the maximum loss within the plan?
- Stop location: Is the stop beyond a genuine invalidation point?
- Share count: Did you divide risk dollars by stop distance?
- Spread: Can the position be exited without excessive friction?
- Daily status: Have you reached the session loss limit?
- Event risk: Is scheduled news likely to invalidate the setup?
A daily loss cap of 2% to 3% is a ceiling, not a target. After two consecutive losses, close the platform and protect tomorrow's decision-making.
Managing the Trade Once You Are In It
The entry only starts the job. Your management rules should already be visible on the chart before the order fills.
During the first 30 minutes, avoid reacting to every tick. Let the opening range form, watch whether volume supports the move, and keep the original stop fixed. A position that immediately moves against you is not asking for a wider stop. It is testing whether you can accept invalidation.
At a 1:1 reward-to-risk move, take the planned partial or move the remaining stop toward breakeven according to your tested rules. Many traders take part of the position at 1R, another portion at 2R, and trail the remainder beneath prior candle lows for a long setup, or above prior candle highs for a short setup.
Match management to the session
- First 30 minutes: Favor clean continuation and avoid chasing extended candles.
- Middle of the day: Demand stronger confirmation because thinner participation often produces chop.
- Final hour: Take only setups that still offer a clear level, defined stop, and sufficient room to target.
If the trade makes no progress for 3 to 5 candles, cut it or reduce it. A time stop closes stagnant positions by 11:30 a.m. EST when the setup has failed to develop, freeing attention for higher-quality opportunities.
Never average down. Never move a stop farther away. If news breaks and invalidates the catalyst, exit within 60 seconds rather than debating the original thesis.
The trade is wrong when the level fails, not when your hope runs out.
Discretionary exits can account for order-book, tape, and Level 2 context that a backtest may not capture. That discretion still needs boundaries. Use it to recognize a failed auction or sudden loss of liquidity, not to rationalize a loser.
Backtesting and Forward Testing Before Real Money
An untested strategy is a belief with chart decorations. Before risking normal size, run a four-week validation process that separates historical recognition from live execution.
Weeks one and two
Manually replay 100 historical examples on TradingView or Sierra Chart. Use the same market and timeframe you plan to trade. For each example, record:
- Entry price and time
- Stop location
- Intended target
- Position size
- Outcome in R
- Whether the setup met every rule
Then calculate win rate, average R-multiple, profit factor, and maximum drawdown. Don't remove ugly trades because they look obvious in hindsight. If the strategy only works after selective editing, you haven't tested it.
Week three
Paper trade live for 10 sessions. Use a simulator, but model realistic slippage rather than assuming every order fills at the displayed price. Record emotional state, execution quality, hesitation, missed entries, premature exits, and rule adherence.
A paper account won't reproduce every pressure of real money, but it exposes workflow defects. You may discover that the setup appears often when the spread is too wide, or that your stop is placed inside normal noise.
Week four
Trade live at 25% of normal size for another 10 sessions. Compare results with the paper period. Look for degradation in entry quality, slippage, rule adherence, and emotional control.
Use these go-live thresholds as a gate, not a guarantee:
- 45% or higher win rate
- Average R greater than 1.5
- Profit factor above 1.5
- No more than two rule breaks per week
These are internal validation criteria for this playbook. They don't prove future profitability.
A useful journal template is:
| Date | Ticker | Setup Grade | Entry Reason | Exit Reason | Lessons Learned |
|---|
Include screenshots before entry and after exit when possible. Walk-forward testing guidance can help you compare historical expectations with later unseen results.
A strategy becomes evidence only when the same rules survive different samples and real execution.
Common Pitfalls and the Rules That Stop Them
Most traders know the rules before they break them. The failure usually begins with a small exception, “one more trade,” a stop moved by a few cents, or a position increased because the last three trades won.
Overtrading is easy to spot if you define the warning sign in advance. Entering during the second half of the lunch session without a fresh catalyst, taking a trade within 60 seconds of a stop-out, or opening a position just because no setup has appeared are behavioral alarms.
Convert each warning into an automatic response
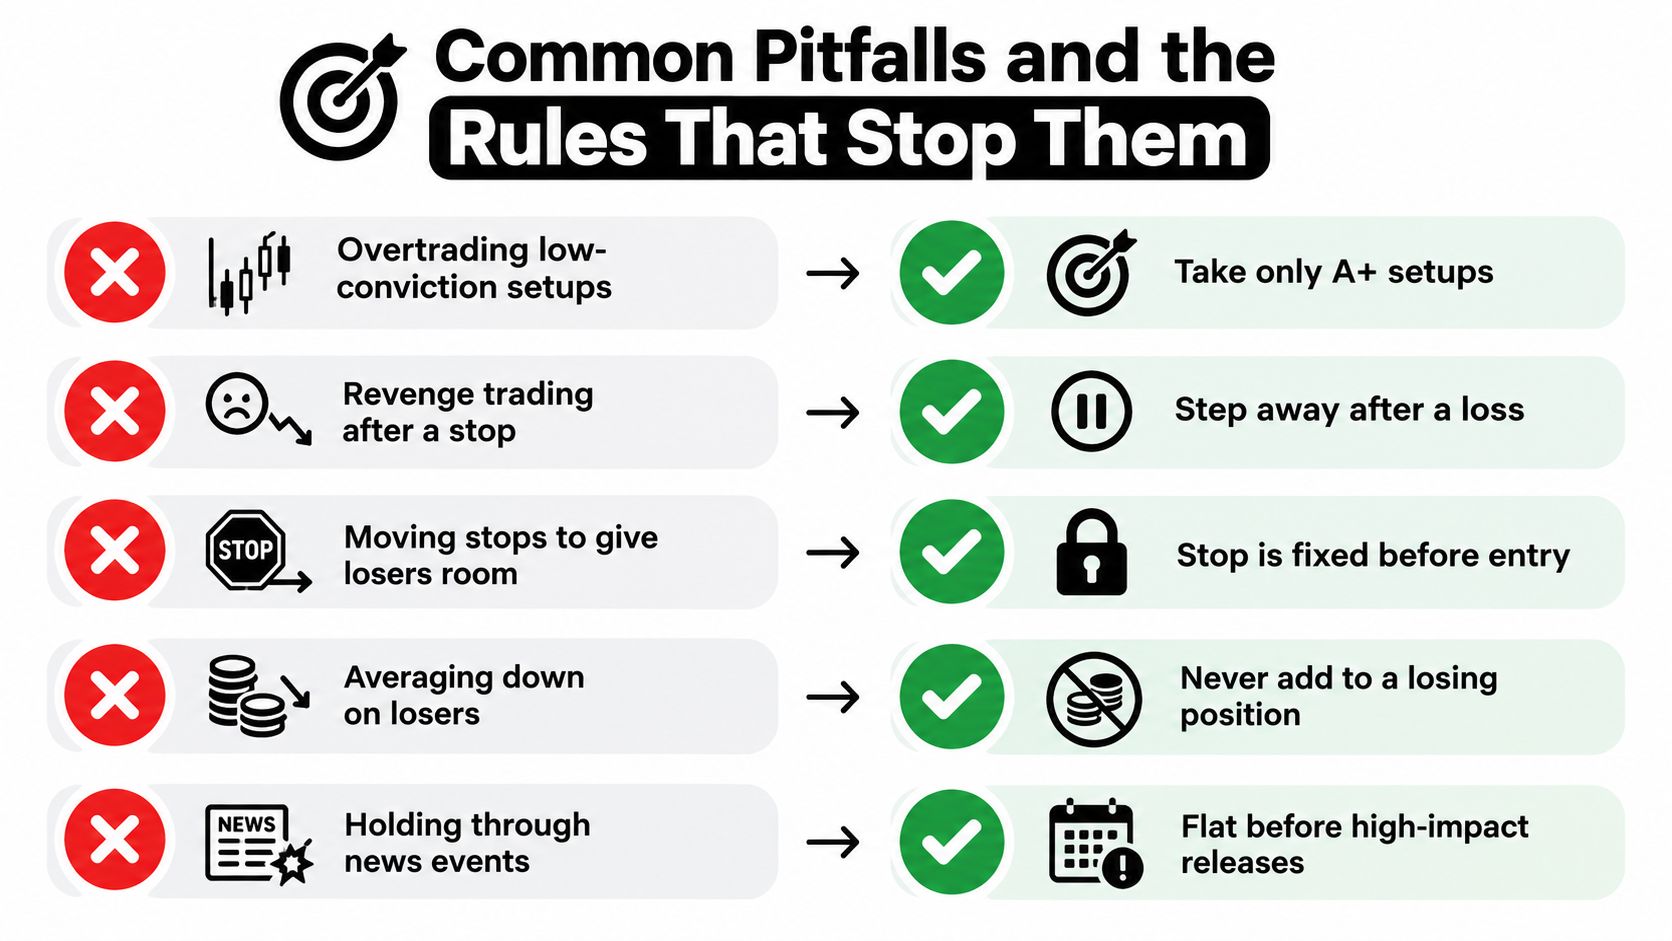
- Overtrading low-conviction setups: If the setup doesn't have a catalyst, zone, confirmation, acceptable spread, and valid time window, take no trade.
- Revenge trading: After a stop, step away. Don't submit another order within 60 seconds.
- Moving a stop: Place the stop before entry and never widen it. A better exit is allowed, a larger planned loss isn't.
- Averaging down: Never add to a losing position. Add only after the trade proves itself and the total risk remains within the original plan.
- Holding through news: Exit before a known high-impact release unless the strategy has specifically tested that event risk.
- Ignoring the daily cap: Lock the platform or close it manually once the session limit is reached.
- Sizing up too early: Don't increase share count after three winners. Increase only after a completed review shows that the larger size still fits the same risk model.
The regulatory history of day trading reinforces why capital and margin rules matter. The United States created the Pattern Day Trader framework in 2001, following the late-1990s online brokerage and dot-com boom. Under the original rule, four or more day trades in five business days, with day trades exceeding 6% of total activity in that period, triggered the designation in a margin account, alongside the widely cited $25,000 equity threshold. Coverage of the 2026 FINRA framework change reports that the long-standing designation was eliminated in 2026, but easier access doesn't remove trading costs or behavioral risk.
Print this beside the monitor:
- No trade without a catalyst and a marked zone.
- No candle traded in isolation.
- No position without a fixed stop.
- No averaging down.
- No revenge entry.
- No trade after the daily loss cap.
- No size increase based on excitement.
- No exception because the last trade lost.
Colibri Trader offers price-action education, day trading coursework, supply and demand training, and practical material on trade execution and money management. Use its structured lessons alongside your own 100-trade test, then visit Colibri Trader if you want guided instruction for turning these rules into a repeatable routine.