




Descending Triangle Chart Pattern: A Complete Trading Guide
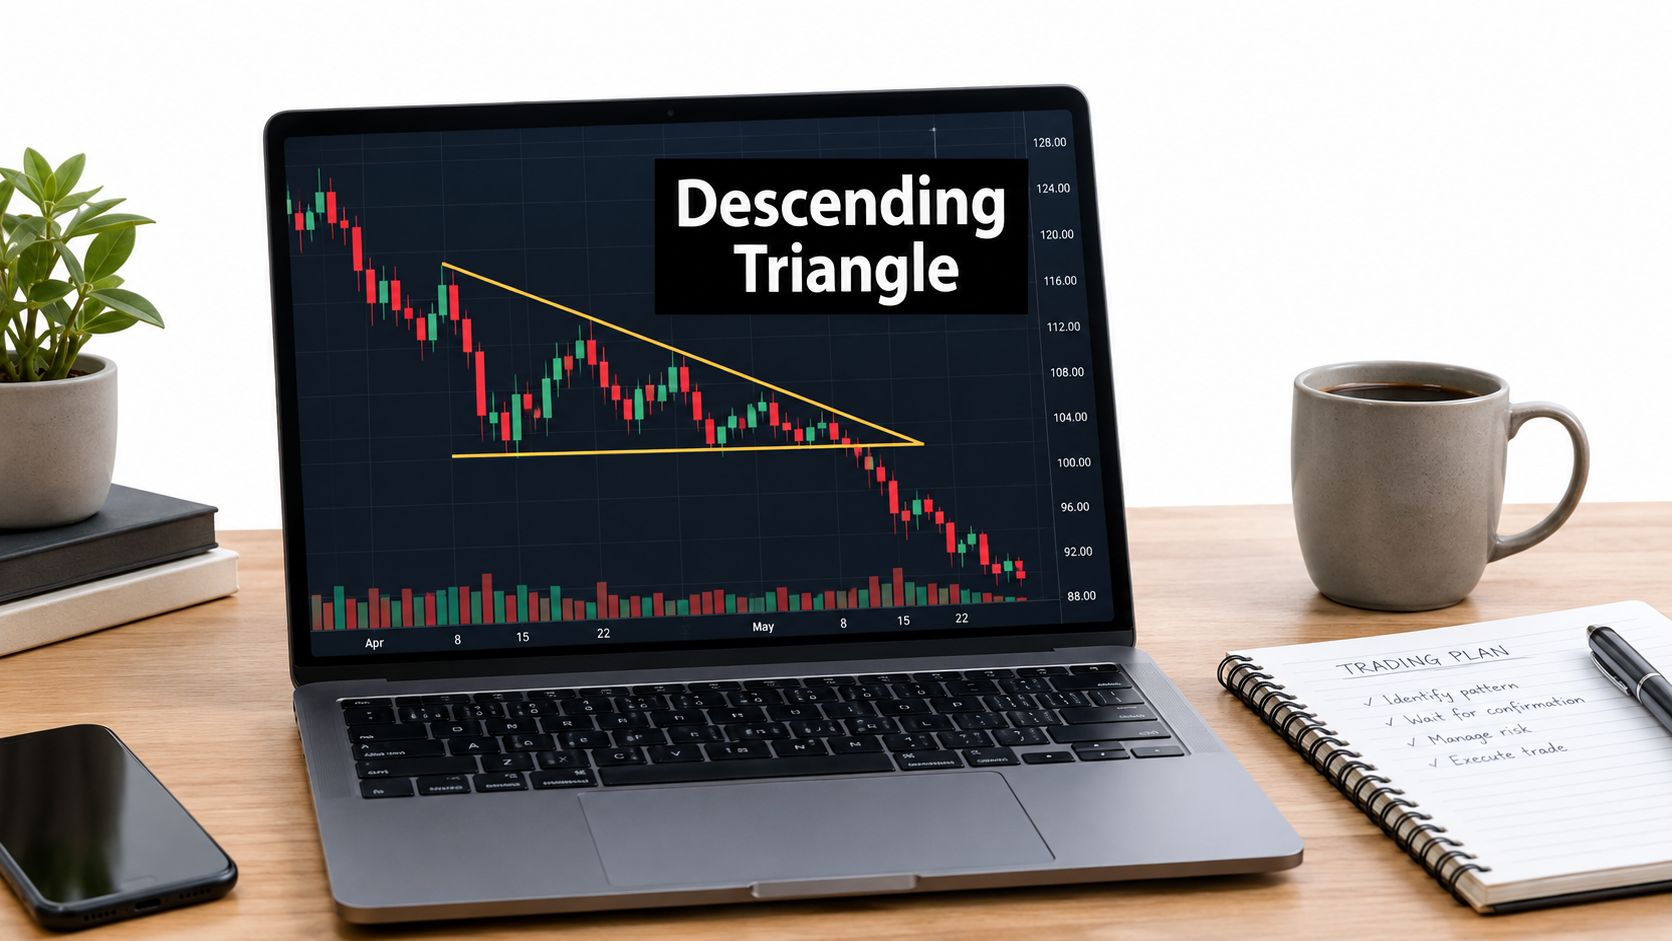
You're scanning charts for a clean short setup when one structure makes you pause. Price keeps finding buyers around the same floor, yet every bounce ends sooner than the last. It looks like a wedge, but the flat base tells a more specific story: sellers are becoming comfortable offering the asset at progressively lower prices.
That's the descending triangle chart pattern. It can give you a clear framework for reading pressure, planning an entry, placing a structural stop, and setting a measured target. It still isn't a prediction machine. Historical research shows that the pattern can break in either direction, so context, volume, and confirmation matter as much as the lines themselves.
What the Descending Triangle Chart Pattern Reveals About a Market
A descending triangle is a visual record of a standoff. Buyers defend a recognizable support level, while sellers cap each rally below the previous one. The result is a narrowing range with a horizontal lower boundary and a falling upper boundary.

The pattern often appears during a downtrend, where it represents a pause before another bearish move. It can also form after a rally or inside a broader range and then break upward. That's why labeling it “bearish” before price confirms the direction can create avoidable losses.
Read the conflict, not just the shape
Suppose buyers step in at support three times. On the first bounce, price reaches a relatively high peak. On the next bounce, sellers appear earlier. On the following attempt, sellers sell even sooner. The lower highs show increasing willingness to transact at lower prices, while the repeated support tests show that demand still exists at the floor.
That conflict creates the pattern's appeal and its danger. A break below support can trap buyers and activate short positions, but a failed breakdown can trap shorts instead. The broader idea of consolidation in trading is useful here because the triangle is a compression phase, not an outcome by itself.
Core principle: The descending triangle tells you where pressure is building. It doesn't tell you that a breakdown is guaranteed.
By the end of this guide, you'll know how to define the structure, distinguish it from similar formations, assess the market psychology behind it, and adapt entries and stops across stocks, forex, and crypto. You'll also see how historical results temper the textbook bearish interpretation, why low-volume breaks deserve suspicion, and how to turn the pattern into a repeatable decision process.
The Anatomy of a Descending Triangle
The structure has two essential boundaries.
The first is a flat or nearly flat horizontal support line. It connects lows that form around a similar price area. The second is a descending resistance trendline, drawn through a series of lower highs. Together, these lines create a triangle whose base is horizontal and whose upper edge slopes down from left to right.
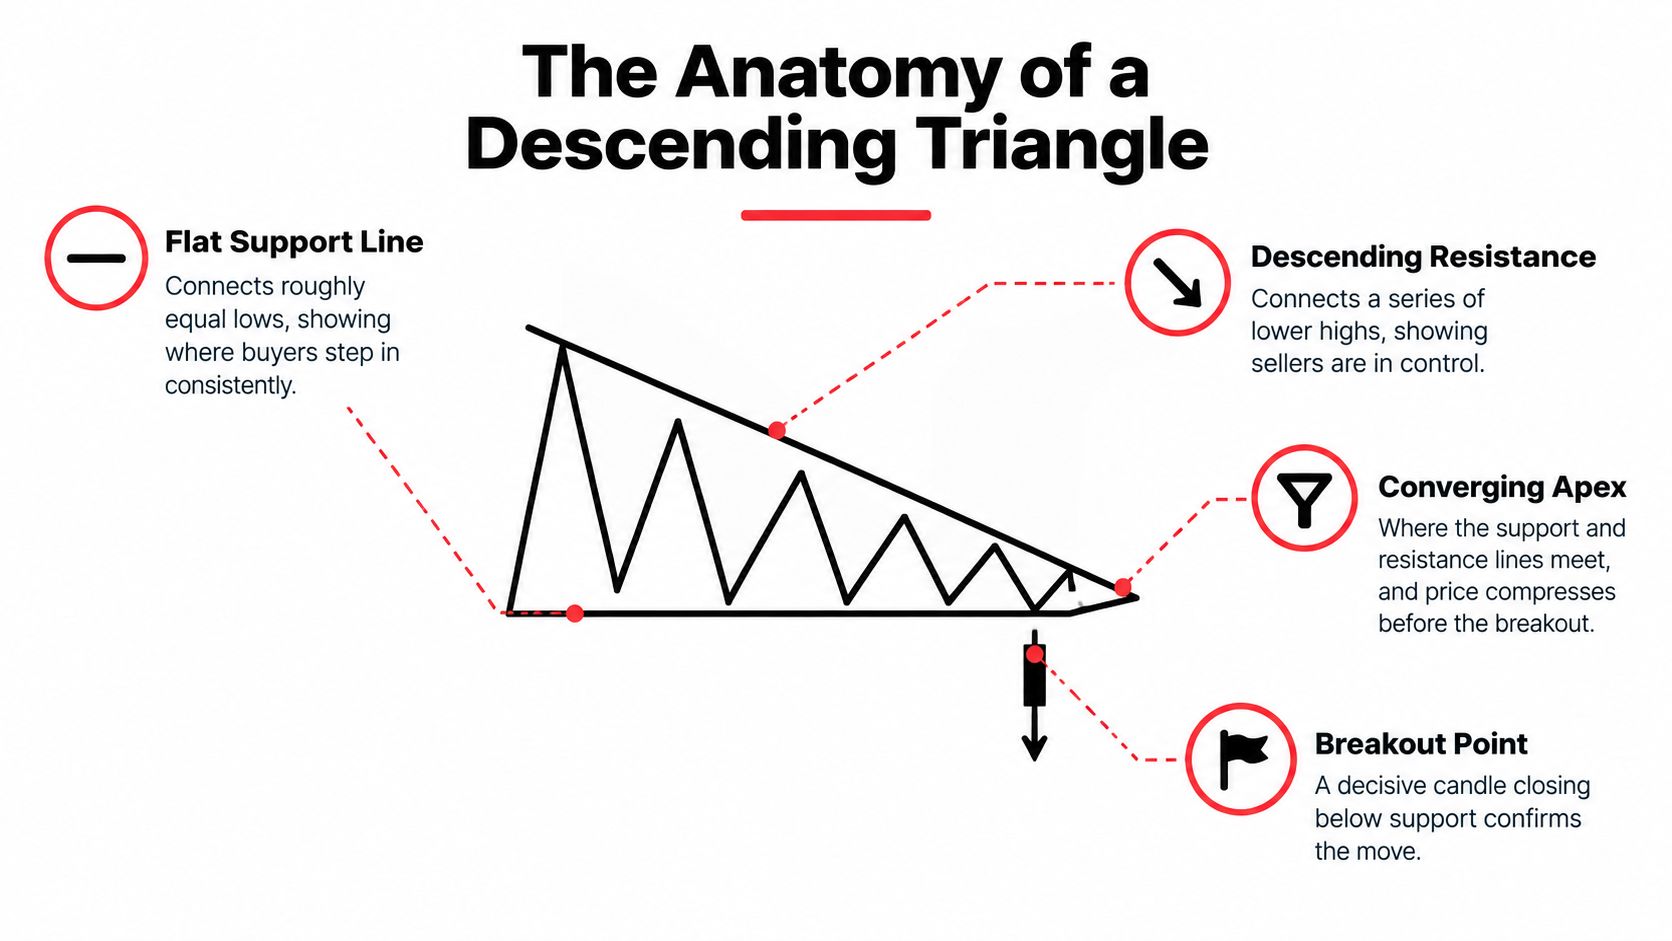
Price doesn't need to touch each line perfectly. Markets are noisy, and wicks can extend beyond a drawn level. What matters is whether the reactions are clear enough to show repeated participation at support and progressively weaker rallies above it.
The psychology behind each boundary
The support line represents buyers who are willing to defend a specific area. They may be accumulating, covering shorts, or just responding to a level that mattered previously. Each successful test produces a bounce, but the bounce becomes less ambitious if sellers keep entering earlier.
The descending resistance line captures that change. A lower high isn't just a geometric point. It says that buyers couldn't push price back to the prior swing high before sellers took control again. As the highs decline, supply appears sooner and the available upside contracts.
The two lines eventually point toward an apex, the projected location where support and resistance would meet. Price often resolves before reaching that point, because a decisive imbalance develops while the range still has room. A break that occurs almost at the apex offers less room for a meaningful move and may reflect indecision rather than a well-developed setup.
Volume gives the geometry context
Volume commonly contracts while the triangle forms, reflecting reduced participation as price compresses. A genuine breakout ideally brings an expansion in volume, because the move needs fresh commitment from buyers or sellers.
After a downside break, former support can become resistance. That role reversal matters because a retest gives you a way to judge whether sellers are still defending the broken level. The pattern's anatomy therefore informs the entire trade plan, from the trigger to the invalidation point and the measured target.
Rules for Identifying a Valid Pattern
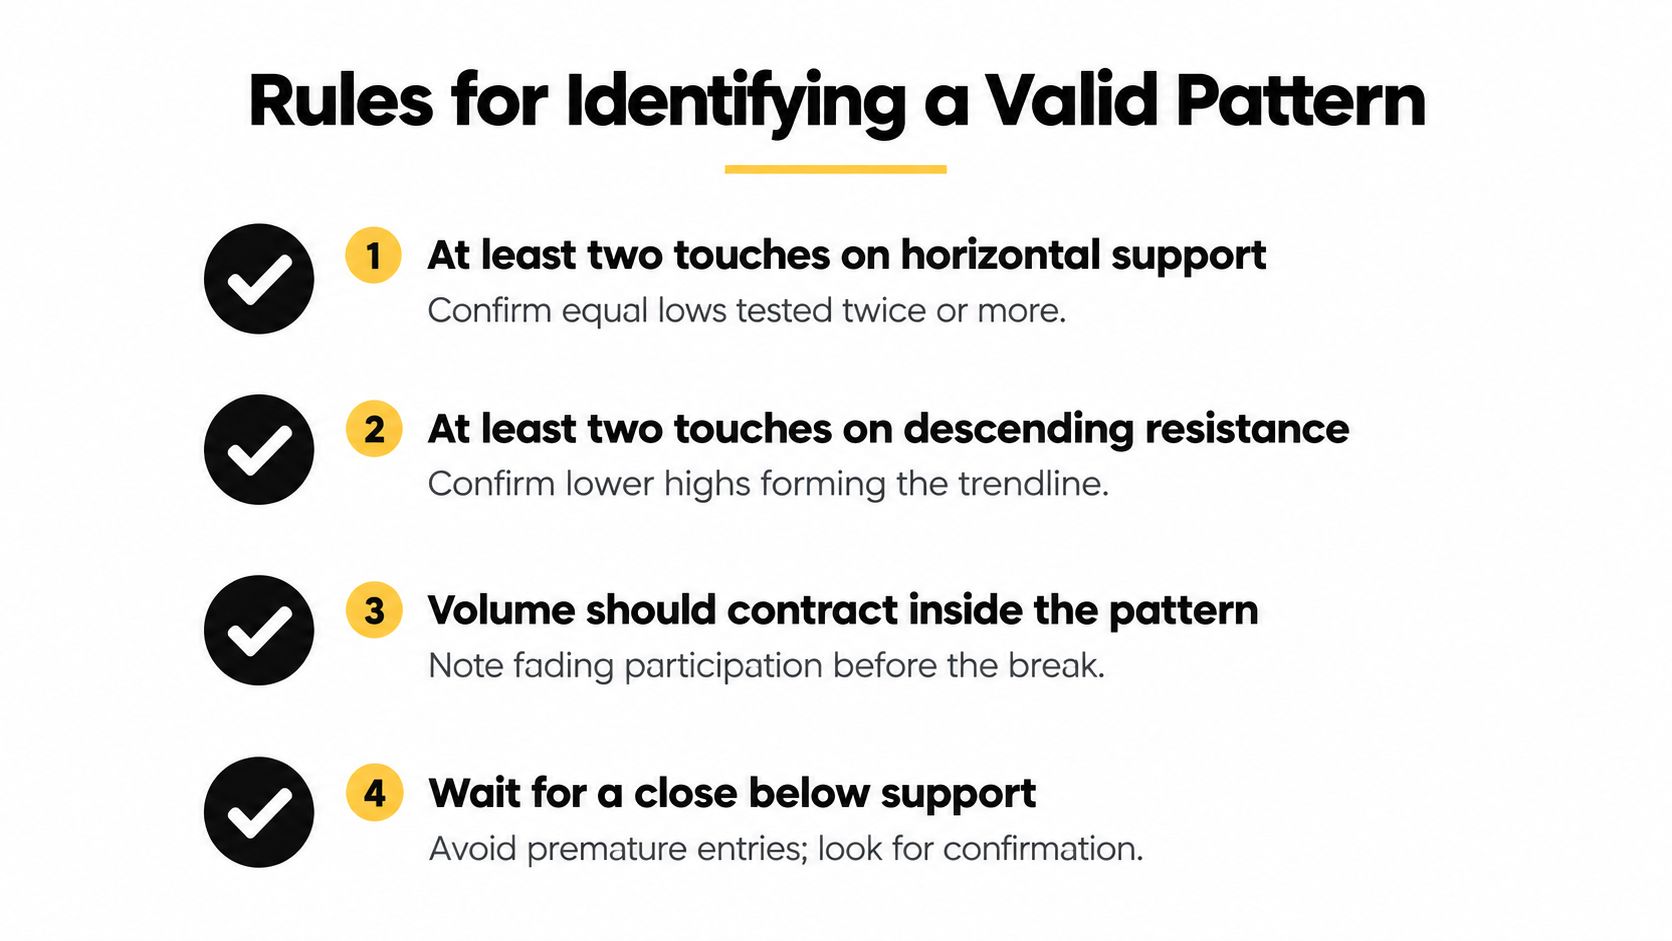
A valid descending triangle has two recognizable boundaries, not two lines fitted around random price action. Begin with support: price should react around the same horizontal area at least twice. Then identify at least two clear rally peaks, with each high below the previous one. Connecting those peaks should create a clean descending resistance line.
The structure gains credibility when price respects both boundaries repeatedly, although extra touches cannot repair poor geometry. If the support line also slopes sharply downward, the formation may be a falling wedge or channel instead. The distinction matters because each pattern reflects a different balance between buyers and sellers.
Use a practical validation filter
On daily charts, classic formations often develop over roughly one to three months, as summarized in the historical descending-triangle reference. Intraday structures form faster and contain more noise. Crypto can compress quickly and produce larger wicks, so apply the same structural tests with less confidence in any single probe.
Before calling the pattern tradeable, check the following:
- Support is visible: Price has reacted around the same horizontal area at least twice.
- Highs are descending: Each meaningful rally peak is lower than the one before it.
- Range is compressing: The swings are narrowing toward the projected apex.
- Participation is changing: Volume generally fades during formation and expands on a confirmed break.
- The pattern has room: The apex is not imminent, and the triangle has enough height for a meaningful move after costs and risk.
- Context makes sense: A prior downtrend supports a continuation trade. After a strong rally, demand stronger evidence of a reversal.
Volume is evidence, not a pass-or-fail switch. A quiet formation can break either way, but a low-volume breakdown offers weaker proof that sellers can sustain pressure. For stocks, forex, and crypto, adapt the entry to that evidence: a close beyond support provides more confirmation than an intrabar wick, while a retest can offer a clearer stop location. A single temporary probe below support is not confirmation. The closing price carries more information.
Descending Triangle Examples Across Markets and Timeframes
The same geometry can feel completely different depending on the instrument and chart interval. A stock's daily formation may develop slowly enough for several clear reactions. A forex setup on a four-hour chart can reach its trigger while traders are managing session liquidity. Crypto can produce a dramatic wick that tests both patient traders and tight stops.

A daily stock setup
Consider a stock that has been trending lower before entering a multi-week consolidation. Price tests a horizontal support zone, rallies, then returns to that level. The next rally stops below the first peak, and another attempt fails even lower. Volume quiets as the swings contract.
The short trigger isn't the first touch of support. It's a daily candle that closes below the level, ideally with noticeably stronger participation than the preceding candles. A trader who enters at the close accepts more initial distance than someone waiting for a retest, but gains earlier exposure if the price continues lower without returning.
A four-hour forex structure
On a four-hour currency chart, support may hold through several sessions while the upper boundary slopes lower. A false intrabar break can appear during a less liquid period, then disappear before the candle closes. Waiting for the close helps separate a temporary liquidity move from a sustained change in control.
A conservative trader can wait for price to break below support and then return to test it from underneath. If sellers reject that retest, the former floor is acting as resistance. The entry is later, but the setup can offer a more clearly defined invalidation point.
The chart interval doesn't change the logic. It changes how much noise you should expect and how quickly the trade may develop.
A weekly crypto formation
A weekly crypto triangle can compress for a long period before a breakdown candle produces a large lower wick. That wick matters, but it isn't enough by itself. The weekly close and subsequent follow-through deserve more attention than the lowest point reached during the week.
Crypto commentary also emphasizes that false breakouts are especially common on shorter timeframes, and this market-specific overview of descending triangles highlights the importance of volume and confirmation. A trader using a weekly pattern may therefore wait for a close or retest rather than reacting to an intraperiod spike.
This video provides another visual reference for comparing how the formation appears across charts:
How to Trade the Descending Triangle With Entries, Stops, and Targets
A sound trade plan separates trigger, invalidation, and objective. The descending triangle makes each easier to define, but it doesn't remove the need to choose between speed and confirmation.
Choose the entry that fits your evidence
The aggressive approach enters after a candle closes below horizontal support, preferably with above-average volume. This method captures the initial move, but the entry can be vulnerable if the break quickly returns inside the triangle.
The conservative approach waits for a pullback to broken support. If price approaches the level from below and sellers reject it, the old floor has become resistance. You give up some potential distance, but you may avoid entering during a weak first break.
Never enter only because price trades one tick below support. A close tells you that the market accepted lower prices for the selected timeframe. Volume then helps you judge whether that acceptance has meaningful participation behind it.
Anchor the stop to the structure
For a breakout entry, a stop can sit above the latest meaningful lower high or above the resistance structure. For a retest entry, place it above the retest high. These locations make the trade invalid if price reclaims the structure that justified the short.
An arbitrary percentage stop ignores the pattern's actual volatility. A stop that's too close can be hit by a normal wick, while one that's too far may make the trade unsuitable for your risk limit.
Risk rule: Decide the amount you're willing to lose before calculating position size. The wider the structural stop, the smaller the position should be.
Project the target, then test the trade
Measure the triangle's height from its widest point, between the first significant high and horizontal support. Project that distance downward from the breakdown point to create the measured-move objective. This is a planning tool, not a promise.
Some traders take partial profit when the trade has earned one unit of risk, then manage the remainder toward the measured target. Whatever method you use, calculate the position from the distance between entry and stop, not from how convincing the chart looks.
Skip the setup when support is unclear, the highs aren't meaningfully lower, volume is absent on the break, or the available target doesn't justify the structural risk. A missed trade costs less than a forced trade.
What the Historical Statistics Tell You About Reliability
A descending triangle can look bearish while the market is still preparing for an upside break. Historical results challenge the assumption that the pattern has one fixed outcome. Thomas Bulkowski's aggregated dataset covered more than 1,300 measured cases. Upward breaks occurred about 53% of the time, compared with about 47% for downward breaks. When price entered from below and rose into the pattern, the upside breakout rate increased to about 63%, according to EBC's descending-triangle research reference.
The lesson is about context, not a bullish reversal rule. Flat support and falling highs describe the visible shape, while the preceding trend, entry location, volume, and breakout acceptance reveal the pressure behind it. A triangle forming after sustained weakness may attract sellers, whereas one forming after a decline can also mark sellers losing control.
A compact view of the evidence
Bulkowski's aggregated results also report an average 19% decline after a bearish break, an average 33% surprise upside break, retest or pullback behavior in roughly 59% of patterns, and a failure rate near 13%. Another summary reports 54% bearish exits, a 61% continuation-pattern incidence, a 54% target-hit rate after a downward break, 64% pullback-on-support behavior, and 6% false upward breaks, as described in the Bulkowski research summary.
These figures use different samples and definitions, so they should not be treated as a promise for the next chart. They are better used as a baseline for judging expectancy. A break with expanding volume and a close beyond support gives the bearish interpretation more credibility. A thin-volume move that quickly returns inside the pattern deserves less trust.
Market and timeframe can change how you apply that evidence. In stocks, earnings or news can overwhelm a pattern's usual behavior. In forex, session liquidity may determine whether a break receives follow-through. In crypto, a fast wick can travel through support before confirmation appears. On a shorter chart, wait for stronger acceptance and keep the stop beyond the structure. On a higher timeframe, allow more room for ordinary fluctuations and reduce position size if the structural distance grows.
Historical tendency helps frame the trade. Volume, confirmation, and risk placement decide whether that tendency fits the current market.
Common Mistakes and False Breakdown Traps
The most expensive mistake is treating support as broken before the market has accepted prices below it. A low-volume wick can dip under the line, trigger short entries, and then close back inside the triangle. That move is information, not confirmation.
Low-volume breakdowns deserve caution because they show limited participation. A stronger break closes below support and attracts follow-through, while a weak break often leaves a long lower wick or quickly reclaims the level. The crypto bear trap confirmation rules offer useful context for evaluating traps in a market where sharp reversals can occur.
Audit the execution errors
- Entering before the close: An intrabar violation can disappear before the candle finishes.
- Ignoring the larger trend: A bearish-looking triangle inside a strong uptrend needs stronger confirmation than one forming during a downtrend.
- Crowding the stop: A stop placed just inside support may be taken by an ordinary wick.
- Averaging into a loser: Adding to a failed breakdown increases exposure while the original thesis is weakening.
- Trusting the target blindly: A measured move is a reference point, not an obligation for price to travel there.
- Skipping higher-timeframe levels: Nearby support can interrupt a short before the projected objective.
- Forcing the pattern: If you have to redraw the lines repeatedly, the structure may not be clear enough to trade.
The same discipline applies to any breakout setup. The guide to trading breakouts can help you compare confirmation, retest, and risk-management decisions beyond this one pattern.
Ask yourself about your last triangle trade: Did price close beyond support? Did volume confirm the move? Was the stop beyond a meaningful swing? If the answer was no, the loss may have come from execution rather than from the pattern itself.
Putting It All Together in Your Trading
A descending triangle becomes useful when you reduce it to a repeatable workflow. First, find a clearly defended horizontal support level. Next, confirm at least two lower highs that create a falling resistance line. Then inspect volume and broader context before deciding whether the chart is ready for action.
A practical Monday-morning process looks like this:
- Mark the location: Identify the higher-timeframe trend and nearby support or resistance.
- Draw the boundaries: Connect the repeated lows and descending highs without forcing the lines.
- Check compression: Confirm that swings are narrowing and the apex still leaves room.
- Wait for confirmation: Look for a candle close below support with stronger participation, or wait for a bearish retest.
- Define invalidation: Place the stop beyond the latest meaningful swing or use a volatility-adjusted buffer that keeps the structure invalidation in view.
- Calculate the objective: Project the pattern height from the breakout point and assess whether the potential reward justifies the risk.
- Review the trade: Record the context, entry type, volume, stop distance, result, and whether you followed the plan.
The pattern's meaning changes with context. A triangle after sustained selling can offer continuation logic, while one after a powerful rally may signal exhaustion or another consolidation. Stocks, forex, and crypto also differ in liquidity and intraday behavior, so the same entry rule may need a different waiting period or retest preference.
The historical record reinforces one final idea. A descending triangle is a probabilistic framework, not a guarantee. Let price confirm the direction, keep the risk fixed, and allow the chart to prove that participation supports the trade.
If you want to practice this price-action process with structured lessons on patterns, discipline, and risk management, explore Colibri Trader. Review the available trading education programs and use the descending triangle checklist to evaluate setups before risking capital.