


Create Your Own Automated Stock Trading System In Excel
Developing an automated trading system can be a very rewarding experience, indeed.
Such a system can be extremely useful as you may want to take advantage of the underlying market sooner than humanly possible.
However, it’s not just about being able to get in on the action right away; several aspects need to be taken into consideration before implementing a successful automated trading system (ATS).
Let’s dig in

Bonus Material: Download this Article in .DOC file HERE
Contents in this article
- Can You Automate Stock Trading, and Is Automated Day Trading Profitable?
- Is Automated Trading Illegal? Is it Right For Me otherwise?
- What Are Some Of The Best Automated Stock Trading Platforms?
- How Does Automated Trading Work?
- How To Use Excel To Download Stock Trading Prices Automatically & Manually?
- How to Automate The Download Of Stock Prices in Excel?
- How To Sort The Stock Data Acquired in Excel?
- Moving Average Trends- 10-day, 14-day MA
- Conclusion
Can You Automate Stock Trading, and Is Automated Day Trading Profitable?
In short, automated trading is a method of stock trading where an algorithm takes care of the decision-making process for you.
It’s a very popular trading method, especially among professional investors; however, it can be quite difficult to set up.
What’s the reason?
That’s because the algorithms (that run automated trading software) are designed to make trade decisions based on certain criteria, which means they need to be able to interpret data and execute trades accordingly.
But is automated day trading profitable?
Yes, automated day trading could indeed be profitable!
The problem with automated day trading is that most people don’t know how to do it right.
They’ll set up their systems and then leave them running for hours without checking in on what’s happening.
If they do check-in, they’ll often jump in and out of positions too quickly.
That’s one of the biggest mistakes traders make when it comes to automated stock trading apps: They don’t understand how it works, so they have no idea how to use it properly.
But if you’re willing to learn more about how automated day trading software works and why it’s so powerful, you’ll get better results from your trades than manual strategies.
Is Automated Trading Illegal? Is it right for me otherwise?
It is not illegal to trade with an automated trading platform!
However, you must understand the risks associated with such a system and ensure your trades align with your risk tolerance.
Automated trading systems are often considered high-frequency trading (HFT).
HFT is a type of algorithmic trading where computers send, receive, and execute orders at rates much faster than human traders can.
People may want to use an automated trading system for several reasons.
Some people want the convenience of not having to watch the market every second of every day.
Others are interested in increasing their profits through speed and volume.
While this may be possible for some traders, it’s important to understand that these systems are not bulletproof and can result in losses if used improperly.
So, is automated trading right for me, or is automated trading for beginners in the investment market?
Well, it depends.
As you know, automated trading is a form of algorithmic trading where algorithms are used to make financial decisions on behalf of traders (with minimal human intervention), but is it profitable for beginner investors?
There are several advantages to using automation in your trading, including:
Faster execution – Algorithms can execute trades in milliseconds. If you can program your algorithm correctly, it will be able to execute trades faster than human traders.
Less emotion-driven – Market movements like human traders cannot emotionally influence automated trading systems. This can help you avoid making rash decisions and losing money.
More consistent performance over time – An automated system will consistently execute trades according to your programmed rules, which can help improve your consistency over time, even if the markets become more volatile or unpredictable as they frequently do.
That means automated trading can be a beneficial option if you’re looking for an easy way to profit from the markets without spending much time analyzing charts and deciding when to buy or sell stocks and other assets.
But always weigh in all of your options before you invest.
What Are Some Of The Best Automated Stock Trading Platforms?
Many automated trading platforms are on the market today, but which ones are worth your time and money?
To help you find out, here are 5 of the best automated trading platforms available today:
1. Trade Ideas: Best for U.S Stocks
Trade Ideas is an advanced trading platform that offers various features such as quick insights, technical analysis, and alerts.
The platform also allows traders to create indicators and build strategies based on those indicators.
The software has been around for a while, and it’s a trusted choice among the community of traders. It has proven itself to be one of the best platforms out there.
2. TrendSpider: Best for Technical Analysis
TrendSpider is a cloud-based platform that allows users to create automated strategies using various indicators.
The software provides users various technical indicators and features such as Bollinger bands, MACD, RSI, and many more. Users can also create their custom indicators by combining multiple technical indicators into one strategy (called “hybrid” in the industry).
TrendSpider also includes an alert feature that allows users to set up notifications when certain conditions occur within their trading strategy.
3. Coinrule: Best for Trading Crypto
Coinrule is a good trading platform for day traders with some cryptocurrency experience.
It has a wide variety of coins and exchanges to trade on, and the user interface is simple enough that it won’t intimidate beginners.
The platform is available as a web-based software and mobile application. It promises professional-level results with no experience required.
The biggest drawback to using Coinrule is that it doesn’t offer educational content or guidance for new users.
You’re expected to figure things out independently, which can be intimidating if you’ve never used an automated trading platform.
4. Interactive Brokers: Best Trading Platform With Broker API
Interactive Brokers is not cheap, but it offers a huge range of services, from trading stocks and options to bonds and currencies, plus advanced tools and order types.
IB (Interactive Brokers) is also one of the few brokers that offer direct market access, which means they don’t use an order routing service; they allow you to connect directly to the exchanges.
Thus making it possible to trade with ultra-low latency, which can be especially important when trading high-frequency strategies like day trading or scalping.
The downside with IB is that its user interface isn’t great, and its website can be pretty confusing if you’re new to the platform.
5. NinjaTrader: Best Automated Trading Platform UK
NinjaTrader is a professional trading platform that both active and professional traders and beginners use.
The main advantage of this platform is that it offers a wide range of tools for automated trading and provides extensive market data analysis.
NinjaTrader can be used for manual and fully automatic trading, but it is primarily designed for automated trading.
Many brokers offer this platform exclusively to their new customers who use automatic trading programs.
You can install NinjaTrader on Windows or Mac computers and on Linux servers. Installing NinjaTrader on virtual machines (VMs) or servers with Linux operating systems is also possible.
The platform also offers free trials to test it before buying it at full price.
How Does Automated Trading Work? [Summary]
Automated day trading software allows traders to make money by following specific strategies and rules.
The software automatically places buy or sell orders when certain conditions are met.
For example, you could set up an automated day trading strategy that buys stocks when they reach a certain price level and sell them when they reach another level.
The advantages of automated day trading are clear: it frees up time for other activities like managing your business or family while still allowing you to profit from the market without having to be present all the time.
However, there are also some disadvantages.
You need to spend time setting up your automated day trading strategy before you can start profiting from it – this process can take months or even years, depending on its complexity.
In case things go wrong during the setup phase (e.g., if you lose money), no one else besides yourself can fix things quickly enough so that these mistakes don’t cost you money in the long run.
How To Use Excel To Download Stock Trading Prices Automatically & Manually?
With the help of Microsoft Excel, you can download stock trading prices automatically and manually with a simple tutorial discussed below.
The information is updated every minute, so it’s always up-to-date. You can use this information to create charts or other visualizations to analyze the data.
If you are familiar with Excel basics, executing the procedure below will not be a hassle.
First, we’ll look into how to download stock trading prices manually.
Here’s how:
- Go to Microsoft Excel and create a new workbook.
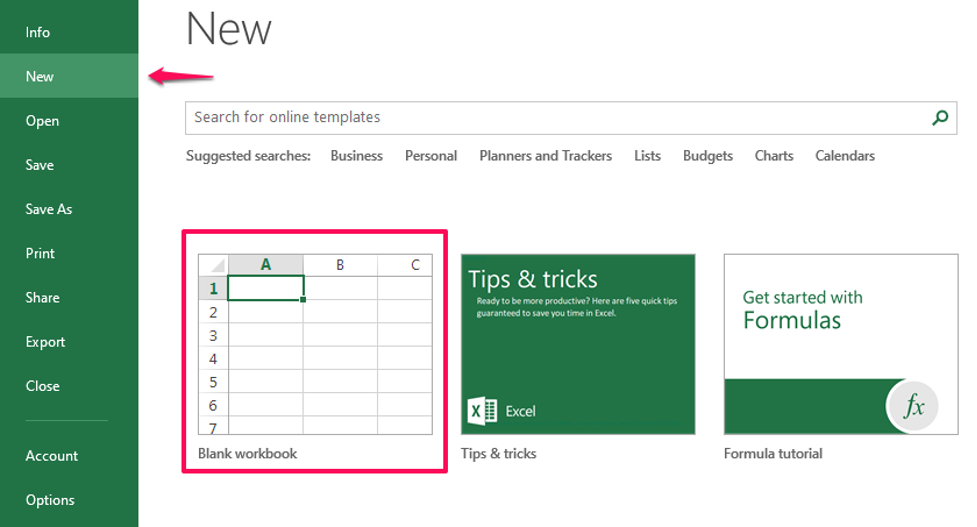
- Name your workbook “testdatadownload.xls”.
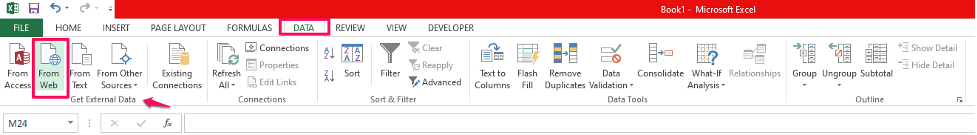
- Navigate to Data from the top menu bar and click on From Web in the Get External Data section.
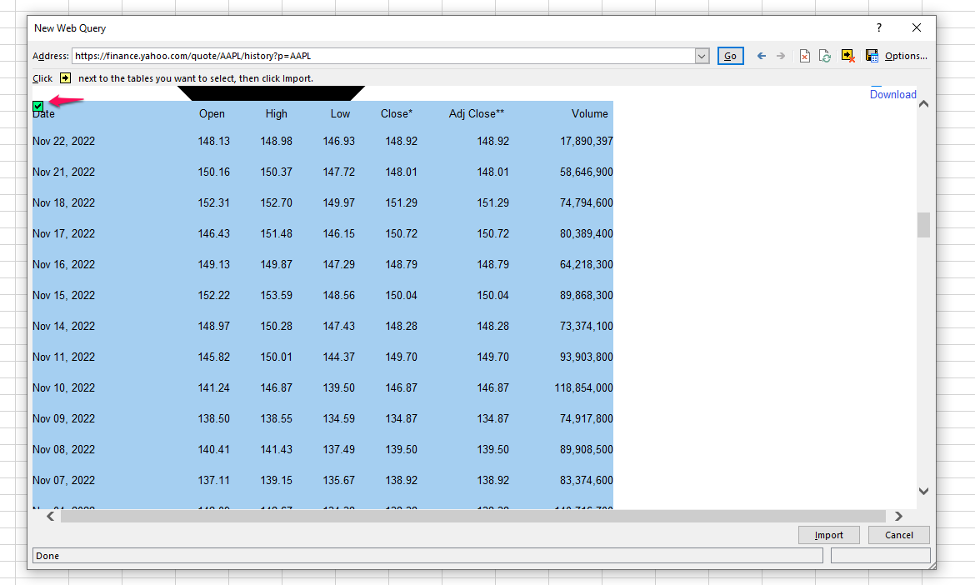
- You’ll see a mini browser pop-ups. Please add the site https://finance.yahoo.com/ into the address section.
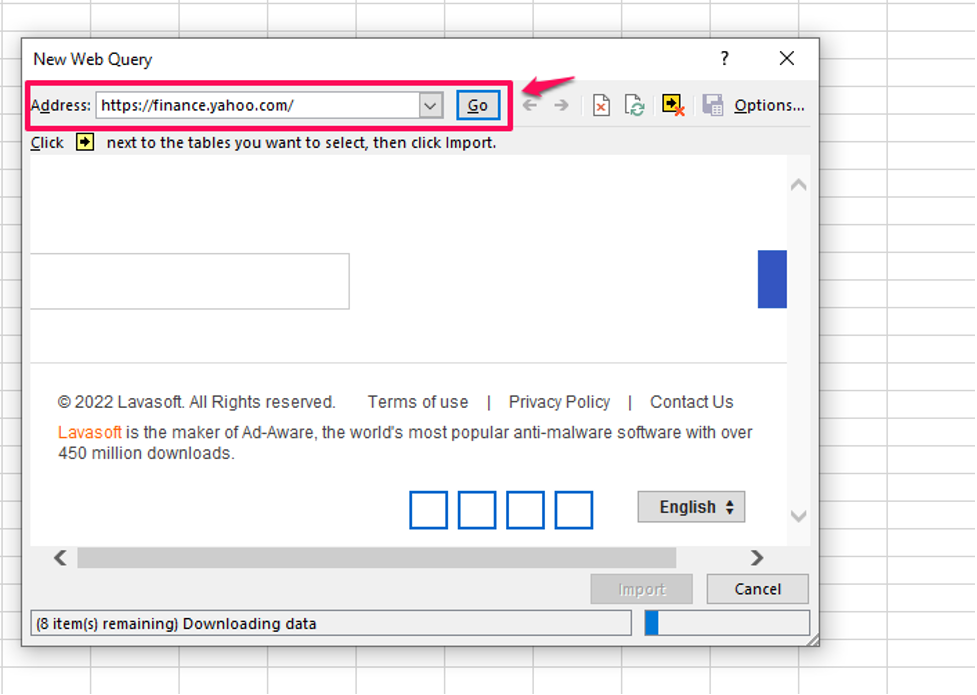
- Now, go to the search bar and enter the ticker “AAPL” for the stock prices of Apple Inc.
- A summary of the Stock prices for Apple with appear.
- Look for the section, Historical Prices and click on it.
- You’ll see that you can select download prices based on the following filters:
- Daily
- Weekly
- Monthly
- If you want the frequency set at Daily, click on Apply.
- You’ll get all the Stock Prices for Apple on your screen.
- Navigate to the Yellow Arrow next to the table and click on it. The arrow will change into a check mark on clicking while selecting the entire table.
- Click on the Import button.
- An “Import Data” dialogue box will appear on your screen where you can alter the properties of your data. If you want to keep it on default, click on OK.
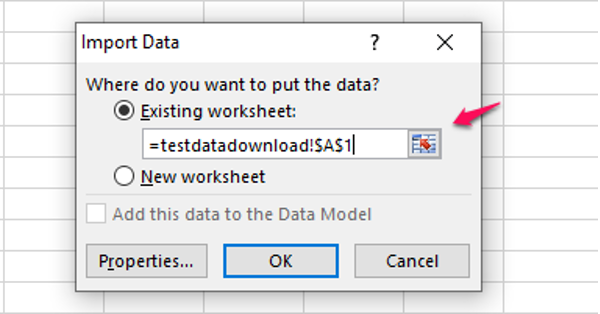
- Your selected data will then be exported to your Excel sheet. As this can take time, wait a few minutes for Excel to process the data.
- The actual data imported will be from the latest date.
How to Automate The Download Of Stock Prices in Excel?
Downloading stock prices in Excel manually can be a tedious task as a lot of your time will be consumed going through each step one by one for each specific stock.
So, how can you automate downloading of Stock Prices in Excel?
To execute this process, you must familiarize yourself with Visual Basic for Application or VBA.
VBA is a programming language that allows you to automate repetitive tasks in Excel.
Also, VBA code can be used to create macros, add-ins, and user forms. These are useful features that allow you to customize your Excel workbooks.
Here’s how to automatically download stock prices in Excel using VBA:
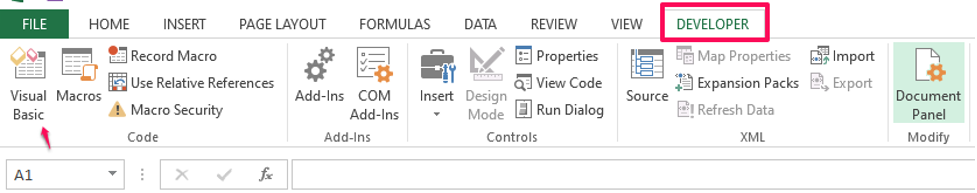
- Create a new workbook and name it AutomatedStockData.xls.
- Navigate to the Developer option from the menu bar.
- Click on Visual Basic in the code section. A new window will appear.
- Now navigate to the left-hand menu, right-click the VBAProject (Excel file), and select the option of Insert > Module.
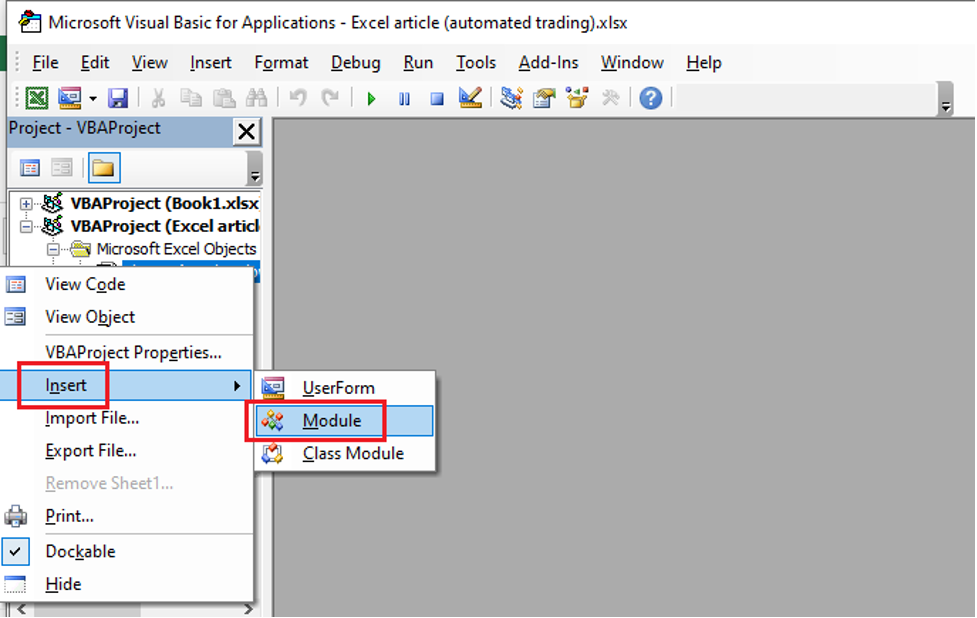
- A default Module1 will be inserted.
- Click Module1 and paste the VBA code below into the Visual Basic Editor.
- The code will allow downloading data from Yahoo Finance based on StockSymbol, Start Date, and End Date criteria.
| Sub GetStock(ByVal stockSymbol As String, ByVal StartDate As Date, ByVal EndDate As Date) Dim DownloadURL As String Dim StartMonth, StartDay, StartYear, EndMonth, EndDay, EndYear As String StartMonth = Format(Month(StartDate) – 1, “00”) StartDay = Format(Day(StartDate), “00”) StartYear = Format(Year(StartDate), “00”) EndMonth = Format(Month(EndDate) – 1, “00”) EndDay = Format(Day(EndDate), “00”) EndYear = Format(Year(EndDate), “00”) DownloadURL = “URL;http://table.finance.yahoo.com/table.csv?s=” + stockSymbol + “&a=” + StartMonth + “&b=” + StartDay + “&c=” + StartYear + “&d=” + EndMonth + “&e=” + EndDay + “&f=” + EndYear + “&g=d&ignore=.csv” With ActiveSheet.QueryTables.Add(Connection:=DownloadURL, Destination:=Range(“$A$1”)) .FieldNames = True .RowNumbers = False .FillAdjacentFormulas = False .PreserveFormatting = True .RefreshOnFileOpen = False .BackgroundQuery = True .RefreshStyle = xlInsertDeleteCells .SavePassword = False .SaveData = True .AdjustColumnWidth = True .RefreshPeriod = 0 .WebSelectionType = xlSpecifiedTables .WebFormatting = xlWebFormattingNone .WebTables = “20” .WebPreFormattedTextToColumns = True .WebConsecutiveDelimitersAsOne = True .WebSingleBlockTextImport = False .WebDisableDateRecognition = False Pg 2 – 7 Creating an Automated Stock Trading System Version 1# .WebDisableRedirections = False .Refresh BackgroundQuery:=False End With ActiveWindow.SmallScroll Down:=-12 Columns(“A:A”).TextToColumns Destination:=Range(“A1”), DataType:=xlDelimited, _ TextQualifier:=xlDoubleQuote, ConsecutiveDelimiter:=False, Tab:=True, _ Semicolon:=False, Comma:=True, Space:=False, Other:=False, FieldInfo _ :=Array(Array(1, 4), Array(2, 1), Array(3, 1), Array(4, 1), Array(5, 1), Array(6, 1), _ Array(7, 1)) Columns(“A:F”).EntireColumn.AutoFit End Sub Sub Download() Call GetStock(“YHOO”, “02/01/2007”, “09/05/2008”) End Sub |
Click on Save and then File > Close to return to your spreadsheet.
To download the data, go to Developers > Macros, select the Download macro and choose Run options.
Press the Enter key, and your stock prices will start downloading from Yahoo! Finance.
If you look at the code closely, it is a subroutine that automatically downloads the stock data and takes the parameters of “StockSymbol”, “StartDate”, and “EndDate”.
The most vital line of code is the following one:
| With ActiveSheet.QueryTables.Add(Connection:=DownloadURL, Destination:=Range(“$A$1”)) |
The code line reads that it will download the data from DownloadURL and place the gotten results into cell A1.
The DownloadURL is constructed based on the following parameters:
- “s=YHOO” means downloading Yahoo’s stock prices.
- “a=01&b=01&c=2007” specifies the start date in Month, Day, and Year.
- “d=08&e=05&f=2008” specifies the end date in Month, Day, and Year.
Save this workbook, as we will be using it for our next section.
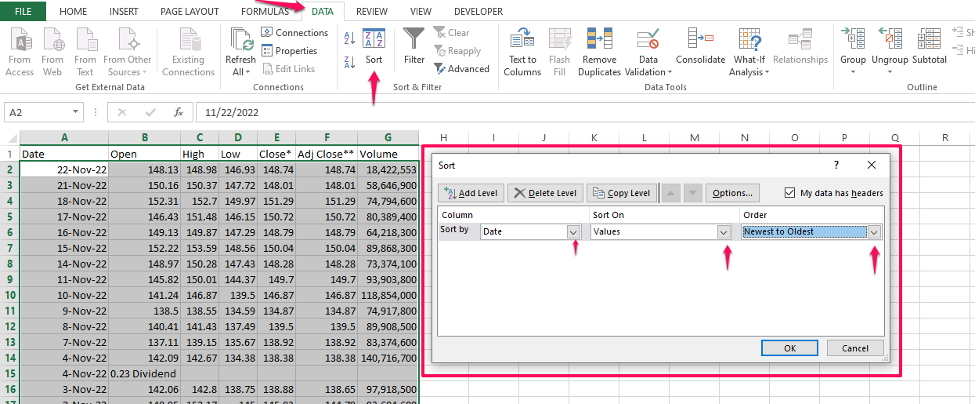
How To Sort The Stock Data Acquired in Excel?
Sorting data in Excel makes this software stand out from the competition.
It doesn’t matter if 1000s of rows or columns of disorganized data need to be organized.
You can sort the data from the latest stock prices on the top or move them to the bottom of the spreadsheet.
You can do whatever type of sorting of data you want with Excel.
That’s why organizations, institutions, and even schools focus on delivering Excel basic training to people because of its practical approach to making the picture clearer.
Here’s how to sort data in Excel:
- Select all the cells containing data that need to be sorted.
- Navigate to Data.
- Click on Sort.
- Make the changes in the filter options below:
- Sort by
- Column: Date
- Sort On: Values
- Order: Oldest to Newest
- Sort by
- Your data will be sorted.
Moving Average Trends -10-day, 14-day MA
Moving Average is an important indicator to determine the trend of a stock. It helps to identify the strength of a trend and whether the trend is about to reverse or continue.
These moving averages are used to smooth out price fluctuations, which makes it easier to see trends and patterns. They are also used as support and resistance levels by traders.
A moving average can be calculated for any period and plotted on top of a price chart.
A simple moving average (SMA) is calculated by taking the closing prices over a specific number of days and then dividing them by the total number of days (for example, 20).
The result is a “moving average,” which shows how much prices have moved over the past 20 days.
A larger number of days will provide more smoothing than a smaller number of days, but too many days may lead to less responsiveness because it will take longer for changes in price action to be reflected in the moving average line.
10 Days Moving Average
To calculate the 10-day moving average of your stock prices:
- Open your Excel file created in the previous section.
- Go on to save it as a new workbook and name it AutomatedMovingAverage.xls.
- Ensure to Run the Download macro if the data needs to download.
- Also, sort the data following the Date from Oldest to Newest.
- Now, Click on the cell where you want the moving average to be calculated.
- Type “=ROUND(AVERAGE(B2:B11),2)”. The B2 and B11 are inserted here as example and portrays 10 selected rows in Column B (containing values of closing prices), and the “2” at the end of the formula will round the average to two decimal places.
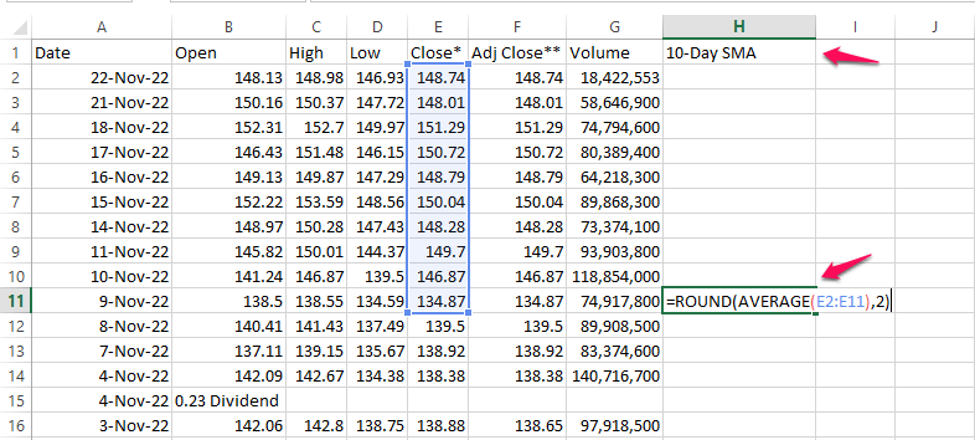
- Press Enter, and your Moving Average for 10 days will be calculated.
- Drag this cell downwards to the end, which will copy the formula of the Moving Average for the entire sheet.
- You name the column where you have calculated the moving average as “10-day SMA”.
14 Days Moving Average
To calculate the 14-day moving average of your stock prices:
- Open your Excel file created in the VBA section.
- Go on to save it as a new workbook and name it AutomatedMovingAverageFourteen.xls.
- Ensure to Run the Download macro if the data needs to download.
- Also, sort the data following the Date from Oldest to Newest.
- Now, Click on the cell where you want the moving average to be calculated.
- Type “=ROUND(AVERAGE(B2:B15),2)”. The B2 and B15 are inserted here as example and portrays 14 selected rows in Column B (containing values of closing prices), and the “2” at the end of the formula will round the average to two decimal places.
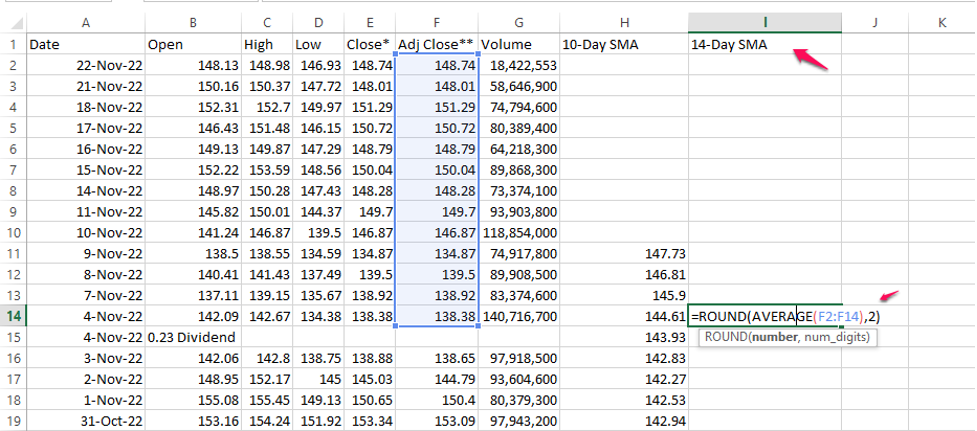
- Press Enter, and your Moving Average for 14 days will be calculated.
- Drag this cell downwards to the end, which will copy the formula of the Moving Average for the entire sheet.
- You name the column where you have calculated the moving average as “14-day SMA”.
How To Chart and Use Moving Averages?
To chart the calculated moving averages, select the 10 Days SMA column & 14 Days SMA column entirely.
Navigate to Insert > Line.
Choose the first line graph.
A chart like the one below will be generated.
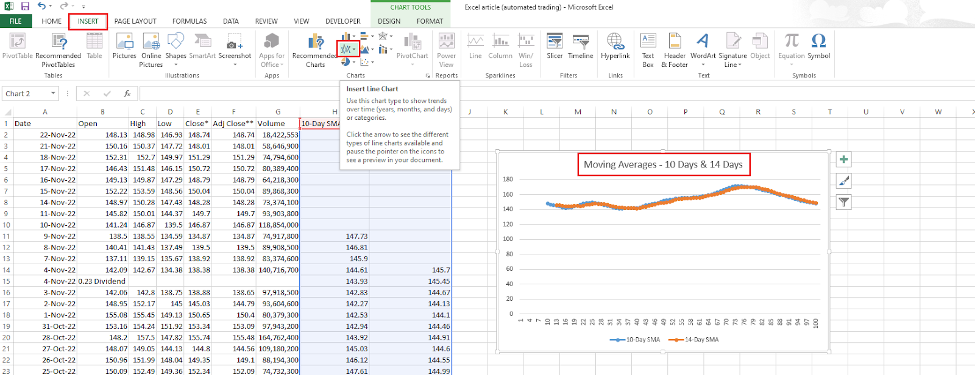
You can also repeat the above steps for the other columns.
Moving averages are used to smooth out fluctuations in the price of a security over time.
They are sometimes referred to as “trend-following” indicators because they help identify and follow trends in a stock price.
The most commonly used moving average is the 10-day moving average.
It is often used to help investors determine whether the current trend for a stock is bullish or bearish.
Conclusion
The stock market can be an intimidating place for novice investors. You may not know the first thing about stocks, how to read the market, or decide how to buy stocks.
As a beginner, automated trading systems are a great way to start making money in the stock market and gain valuable experience as an investor.