

Hammer Candle Pattern: A Practical Trading Guide
A hammer can look textbook-perfect and still fail, while a less obvious one can mark a useful turning point. The difference isn't the candle's silhouette alone. Research reports that hammer confirmation rates fell from 67.3% in stable conditions to 44.4% during crisis periods, a reminder that volatility and market regime can change what the same pattern means. The regime-dependent findings make a better starting point than memorizing a shape: read the context, wait for evidence of follow-through, and decide what you'll risk before entering.
What the Hammer Candle Pattern Actually Tells You
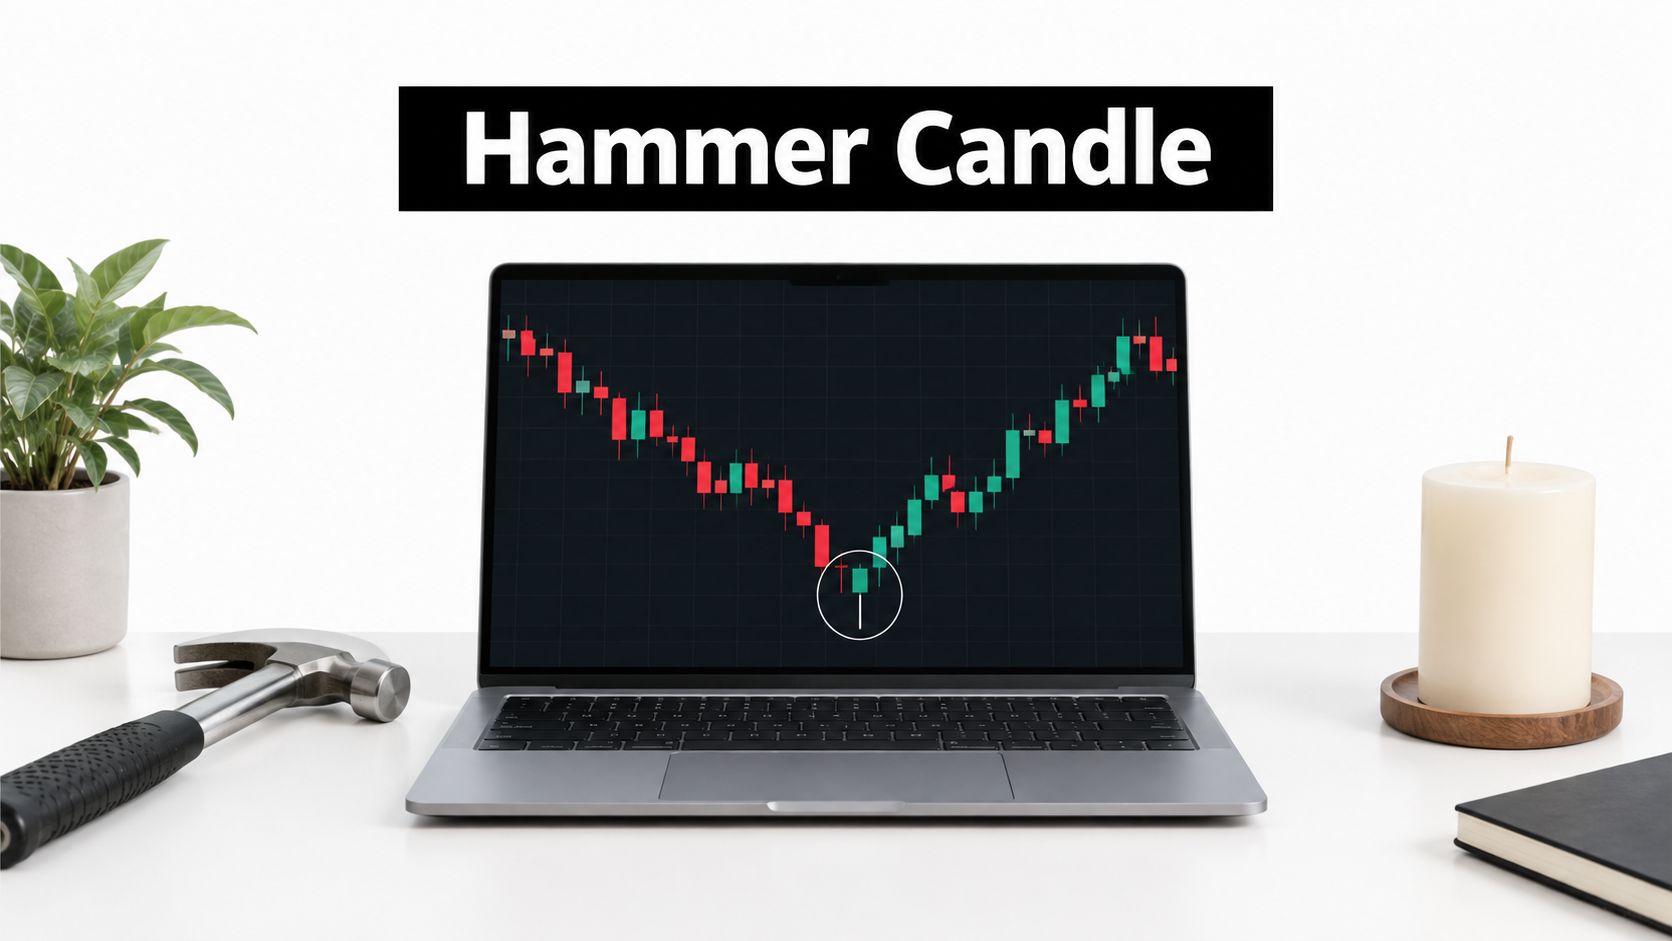
The hammer candle pattern is a one-session bullish-reversal candidate, not a buy signal by itself. It typically appears after a decline and has a small real body near the top of the session's range, a long lower shadow usually at least twice the body's length, and little or no upper shadow. The shape shows that price fell during the session but recovered much of that drop before the close.
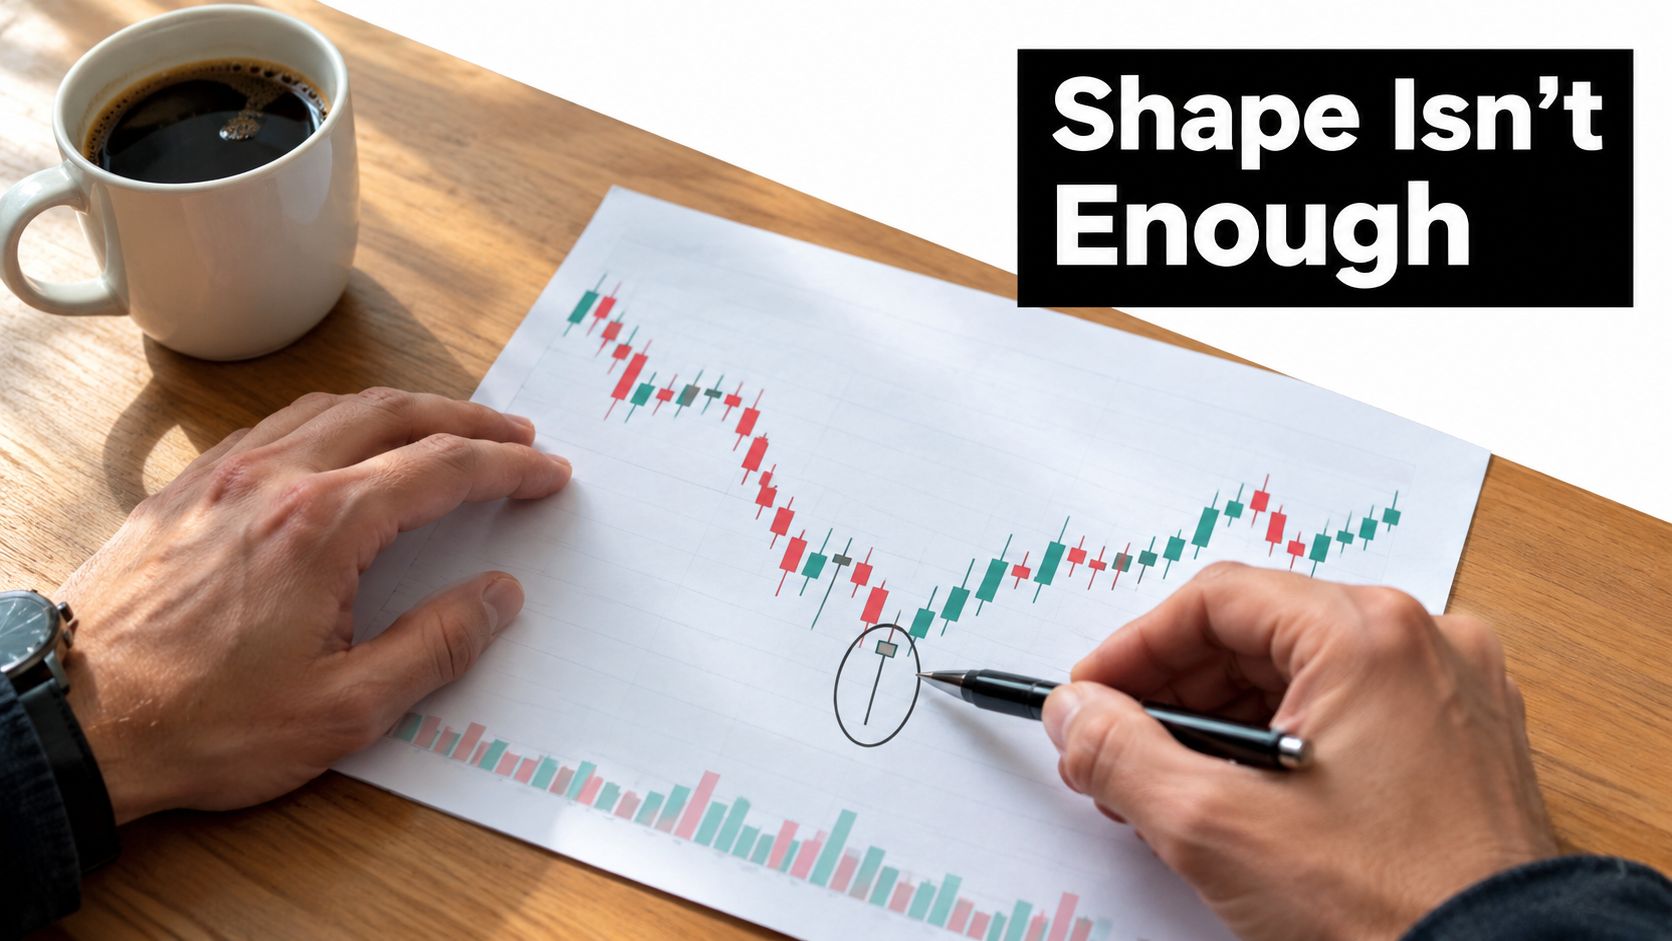
That recovery is the clue. It suggests buyers may have stepped in near a potential support area, but it doesn't prove that the decline has ended. The next candle, the hammer's location on the chart, and the broader market conditions all help determine whether the rejection has follow-through or remains a single session's failed attempt to push lower. Investopedia's definition of a hammer similarly treats the formation as a potential reversal that needs context and confirmation.
Read the candle, then read the chart
Start by checking the trend leading into the candle. A long lower wick after a sustained decline tells a different story from the same wick in a sideways range or after a rally. In a decline, sellers have been pressing prices down; a close near the session's high hints that buyers resisted that pressure. In a range, the candle may record routine movement between the range's boundaries.
Then mark the hammer's high and low. Those prices give you reference points for a possible confirmation and for defining when the setup has failed. Without them, it's easy to turn a visual impression into an impulsive entry.
Practical rule: Treat the hammer as an observation, not an instruction. The trade only becomes actionable when your entry, invalidation point, and acceptable loss are clear.
A hammer's history reflects a long market-observation tradition rooted in Japanese candlestick charting, with early technical analysis associated with Japanese rice trading. Munehisa Homma, a rice merchant who lived from 1724 to 1803, is widely credited with contributing to that tradition, though parts of the origin story are legendary. Steve Nison helped popularize candlestick analysis in Western markets through his 1991 book Japanese Candlestick Charting Techniques. The pattern has a rich history, but its age doesn't make it a guarantee.
The Psychology Behind the Long Lower Wick
Follow the candle through the session rather than naming it at a glance. Sellers begin in control and push price materially lower. Some traders read that drop as evidence that the decline will continue, but buyers begin absorbing the selling pressure. Price climbs back toward the opening area, leaving the close near the top of the session's range.
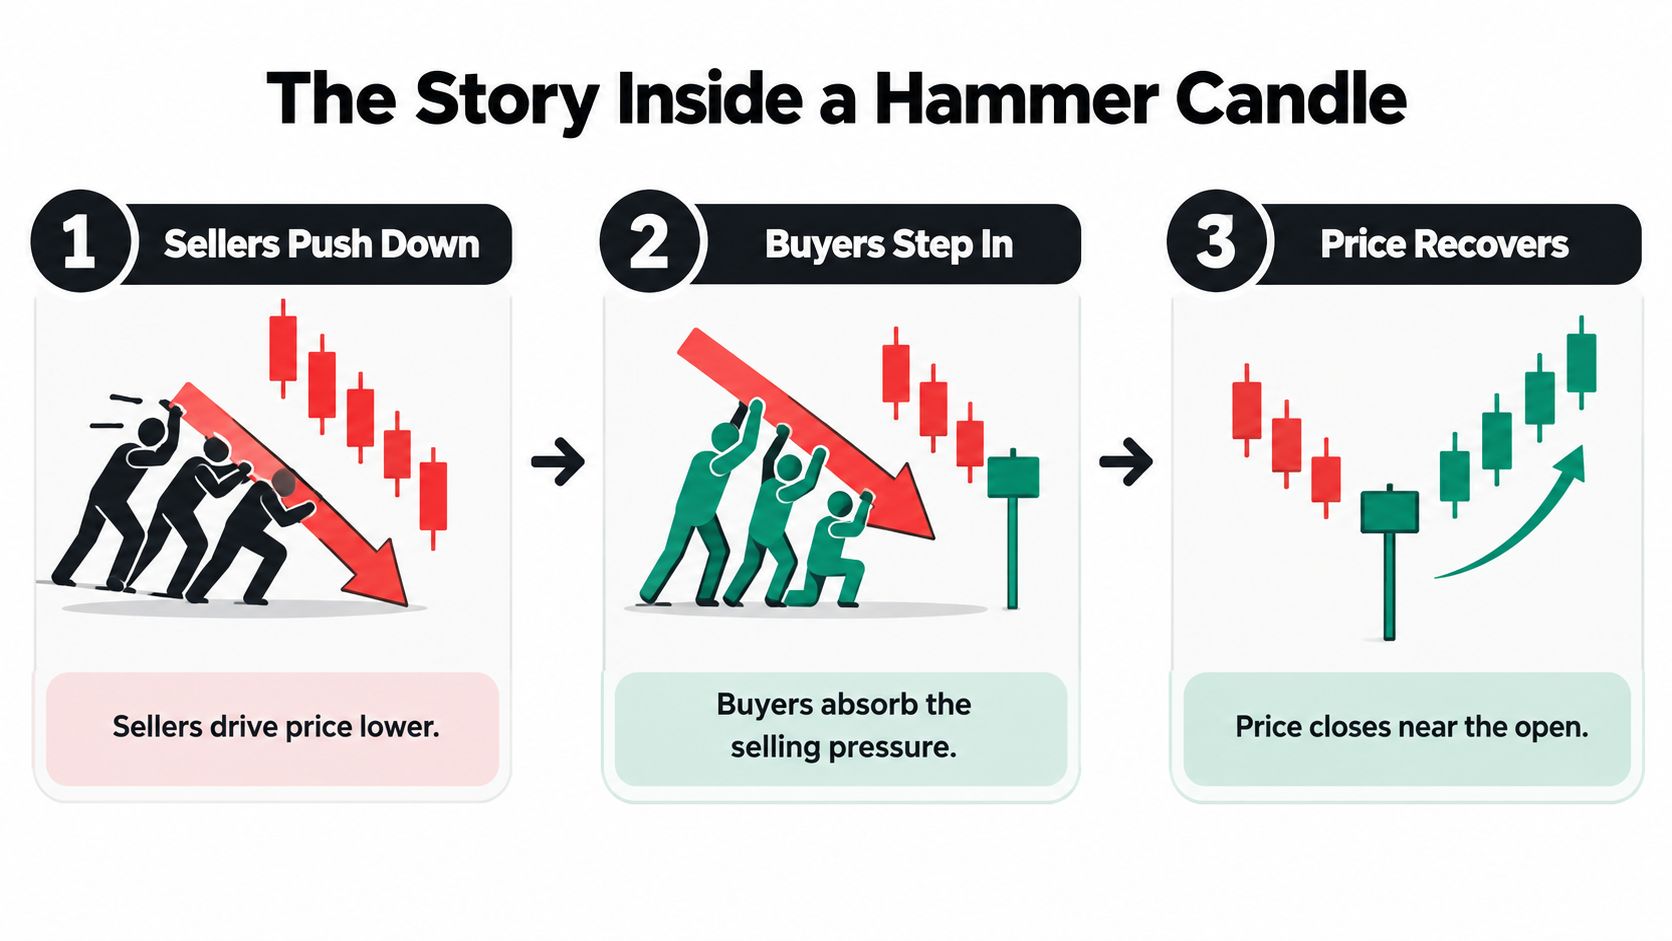
The lower wick records where sellers managed to take price, not where they managed to keep it. The close matters because it shows that buyers recovered much of the intraday decline before the session ended. That's evidence of rejection, not proof of a trend change: sellers may return in the next session and push price below the wick.
Why context changes the story
Suppose a market has been falling toward an area where price previously rallied away. A hammer there could show that buyers are responding at a meaningful location, though the following price action still needs to confirm it. Now place the same candle in the middle of a quiet sideways range. The wick may reflect ordinary two-sided trading, with no strong reason for the market to reverse.
A small pullback within a broader uptrend creates another reading. Buyers may have defended a brief dip, but the candle doesn't necessarily mark a major turning point because the larger trend wasn't down. The pattern's shape stays the same; the market story around it changes.
A wick tells you where price went. The close tells you how much of that move held by the end of the session.
This session-by-session narrative is more useful than a color rule. A green body may look reassuring, but the body's color doesn't replace the questions that matter: What was the trend? Where did the wick form? Did buyers follow through afterward? A trader who answers those questions can interpret the candle without assuming every long lower shadow means a reversal.
The embedded lesson below shows the pattern in chart form. Use it to follow the movement from the session's low back toward the close, then compare that sequence with the market context around a candle you're studying.
Regular Hammer vs Inverted Hammer and Common Lookalikes
Wick-heavy candles can look alike while telling different stories. The regular hammer has its long shadow below the body. An inverted hammer has its long shadow above. A hanging man shares the regular hammer's shape, but its usual context is an advance rather than a decline.
| Pattern | Body position | Lower shadow | Upper shadow | Typical context |
|---|---|---|---|---|
| Regular hammer | Near the top of the range | Long | Little or none | After a decline, as a bullish-reversal candidate |
| Inverted hammer | Near the bottom of the range | Little or none | Long | After a decline, as a bullish-reversal candidate |
| Hanging man | Near the top of the range | Long | Little or none | After an advance, as a possible bearish warning |
Similar anatomy, different context
The inverted hammer records a different intraday test: buyers pushed price higher, but it retreated from the session's high before closing. After a decline, that upward attempt can make the candle a bullish-reversal candidate, but traders still look for follow-through. The regular hammer shows rejection of lower prices; the inverted hammer shows an attempt to reach higher prices that didn't hold through the close.
The hanging man can be confused with the regular hammer because the two share a small body near the top and a prominent lower shadow. The distinction is where each appears: the hammer is associated with a decline, while the hanging man appears after an advance and may warn that selling pressure is emerging. A candle's label depends on the path that came before it, not just its shape.
A doji is another lookalike, but its body is very small or nearly absent, and its shadows can vary. A spinning top has a small body with shadows that extend on both sides, suggesting indecision rather than the hammer's characteristic long lower shadow and body near the high. Neither should be relabeled a hammer just because it appears after a decline.
Before planning a trade, check the body position and both shadows, then check the preceding move. This simple sequence prevents a common mistake: treating any small-bodied candle near a low as evidence that buyers have taken control.
What the Research Says About Hammer Accuracy
A hammer's shape alone can't tell you whether a trade has an edge. In one study of candlestick patterns in a real-estate-market dataset, researchers recorded 416 hammer occurrences over 16 years. Price rose afterward in 249 cases, a reported accuracy of 59.86%, with a one-tailed binomial-test p-value of 0.000034. Those results exceeded a 50% benchmark in that sample, but they don't establish how the pattern performs in another market or under different trading rules. The study's reported results offer one piece of evidence, not a universal forecast.
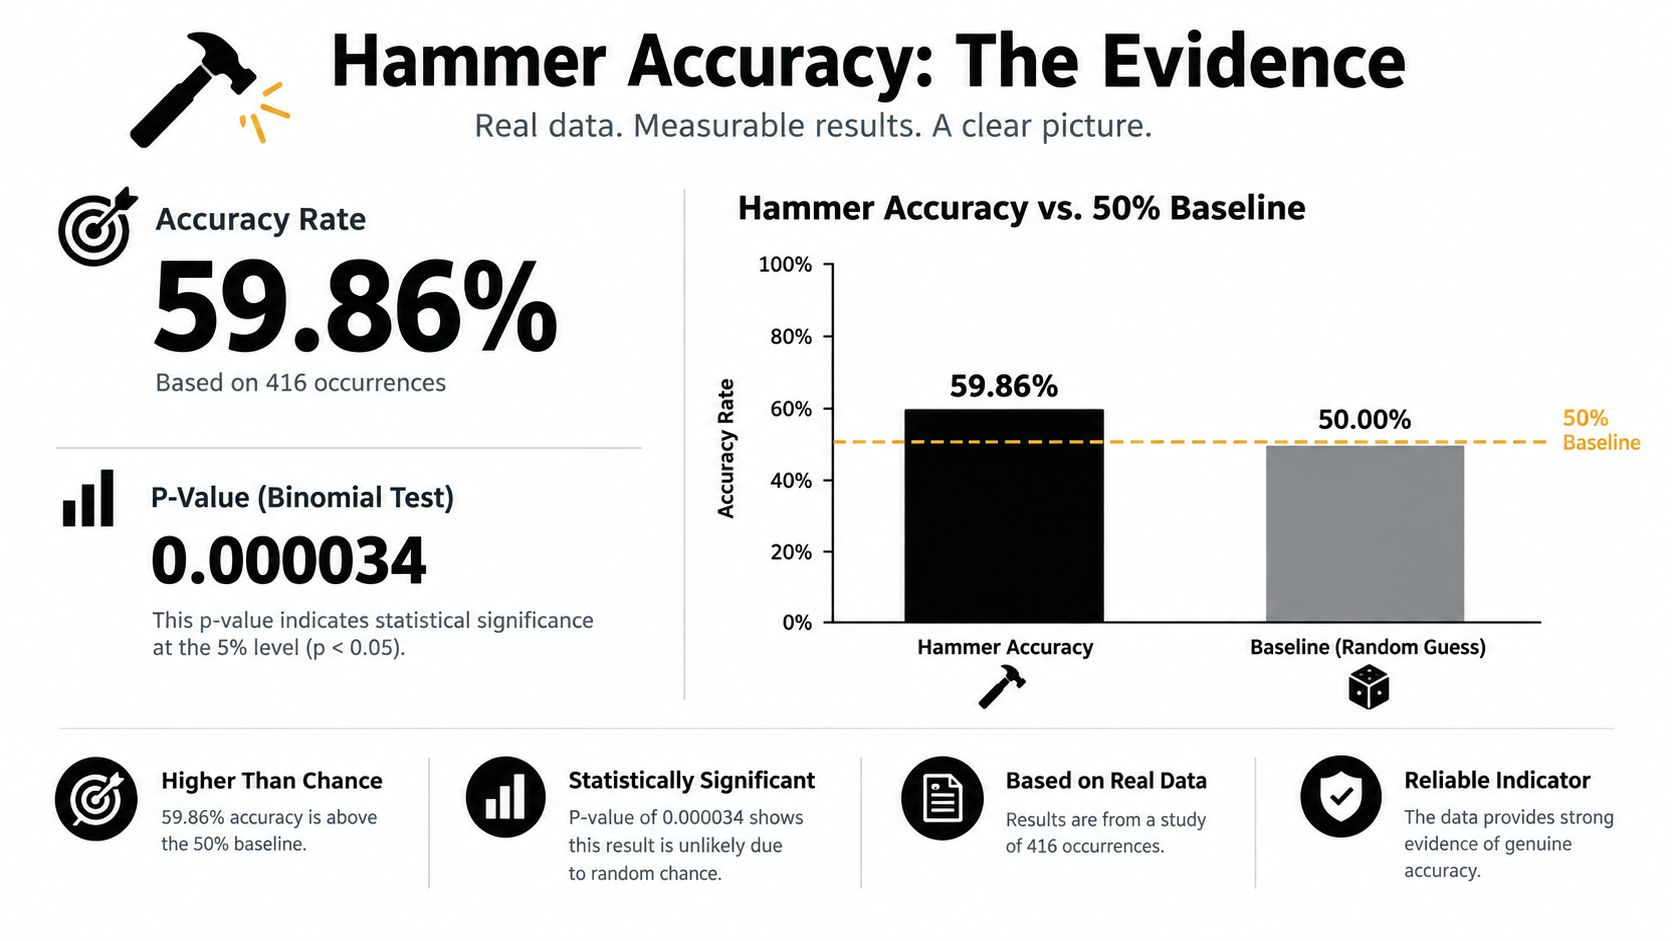
The market regime changes what that result means. A study of candlestick reversals published in 2017 found that the mean returns of most bullish and bearish patterns were not statistically different from zero. Research on Nifty 50 component stocks, by contrast, reported statistically significant predictive power for five of seven hammer-based strategies tested. The findings differ because markets, strategy rules, and test methods differ.
As noted earlier, regime-focused research found hammer confirmation rates fell from 67.3% in stable conditions to 44.4% during crisis periods. A rejection candle can carry less weight when volatility is extreme and prices gap or move sharply. One accuracy figure cannot describe all those conditions.
A win rate isn't the same as expectancy
Accuracy measures how often a directional call is right. Expectancy measures the average outcome after accounting for winners, losers, and trading costs. A strategy can win more often than it loses and still have negative expectancy if its losing trades are larger.
For example, a hypothetical strategy that wins 6 trades out of 10, gains $100 per winner, and loses $200 per loser has an average result of -$20 per trade before costs: (0.6 × $100) − (0.4 × $200). The useful test is whether a defined hammer setup has positive expectancy in the market and conditions you trade. For more context, see Colibri Trader's guide to evaluating whether price-action trading works.
Confirmation Rules That Actually Filter Trades
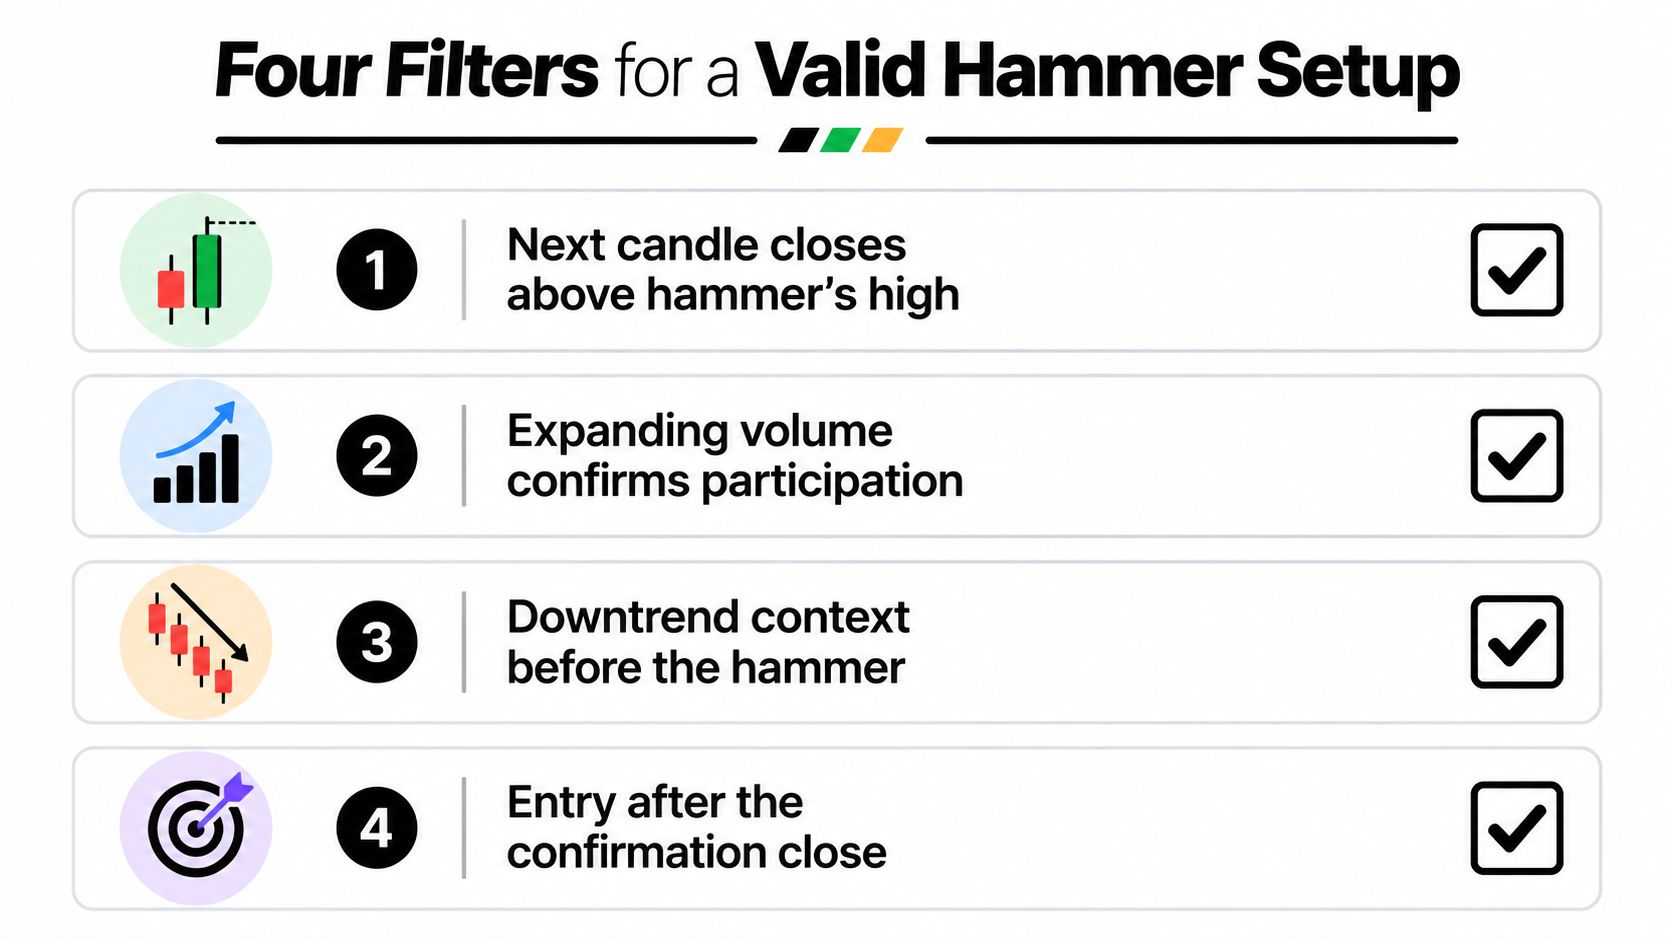
Confirmation turns a possible rejection into a testable trade idea. It doesn't eliminate losses; it asks the market for additional evidence before you accept risk. A straightforward rule is to wait for a subsequent bullish candle to close above the hammer's high. A brief move above that level that fails before the close isn't the same evidence of follow-through.
Four filters to apply
Check the close above the high. This sets a clear trigger and helps avoid buying solely because the hammer's wick looks promising. If price can't close above the hammer's high, you haven't seen the follow-through your rule requires.
Compare participation. Expanding volume on the confirmation candle can support the case that more buyers are participating. Treat volume as a quality filter, not a universal guarantee: low volume may reflect thin or random trading, and high volume doesn't ensure a successful reversal.
Check the decline and location. A hammer after a meaningful decline, near a relevant support or demand area, has more context than the same formation in the middle of a range. This filter helps distinguish a possible change in control from a routine fluctuation.
Define invalidation. A break below the hammer's low removes the evidence that buyers defended the session's lower range. Use that level to frame the setup's failure point before entering, rather than moving your stop after price begins to fall.
Entering on the hammer's close gets you into the trade earlier, but you accept the risk before buyers demonstrate follow-through. Waiting for the confirmation close may mean a later entry and a longer distance to the invalidation point. That can reduce the room between entry and target, so compare the actual risk and potential reward instead of assuming either entry method is automatically superior.
A confirmation rule is only useful if you apply it consistently. If you sometimes buy the hammer close and sometimes wait for the follow-through, your results won't clearly show which method suits your market and risk plan.
Reading Location With Supply and Demand Context
A hammer in the middle of a chart is a candle without much of a trade thesis. The same shape near the origin of a prior rally may be more informative: the earlier move away from that area suggests buyers previously responded there, and a return to the zone lets you watch whether they do so again. Location gives the wick something meaningful to reject.
Fresh demand zones are areas where price previously moved away with force and hasn't yet returned to test the area. Look for a relatively narrow base followed by a clear upward impulse. The base gives you a zone to monitor; the departure shows that price reacted there before. Neither feature proves that buyers remain ready to defend it, so treat the zone as context, not a promise.
Don't confuse a zone with any old support
A chart can contain many prices where the market paused. A useful demand area is more than a line drawn through an old low. Ask whether price rallied decisively from it, whether the base is identifiable, and whether the current decline is approaching the area rather than forming a hammer randomly in the middle of a move.
A hammer at a fresh demand zone can serve as a timing clue: price reached an area with prior buying interest, rejected lower prices, and may now show follow-through. A hammer far from such a zone has less structural support for the same idea. The candle can still be worth observing, but the location hasn't added a clear reason to expect buyers to persist.
For a fuller explanation of how traders identify these areas, see Colibri Trader's guide to the supply and demand principle. Use the framework to mark the zone before judging the candle. That order helps prevent you from drawing support around every hammer after it appears.
The practical hierarchy is straightforward: first assess the market regime, then the location, and only then the candle's shape and confirmation. A well-placed hammer can offer a defined setup to test. A poorly placed one can look convincing while asking you to trade without a sound structural reason.
Common Pitfalls and the Trades That Blow Up
The most tempting hammer is often the one that appears after a sharp drop. A trader sees the long lower wick and assumes the decline must be tired. But in a strong downtrend, one session's recovery may not be enough to overcome continued selling; a break below the hammer's low can turn an eager entry into a quick loss. The safer response is to wait for the confirmation and assess whether the larger move still points down.
Mid-range hammers create a different trap. Price may print several wick-heavy candles while moving sideways, but none closes above a meaningful trigger or clears nearby resistance. A trader who buys each one is treating repeated indecision as repeated evidence of a reversal. Wait for a close above the hammer's high and check whether there's room to a relevant target.
Match the mistake to the chart
- Buying the shape without confirmation: Price makes a long wick, attracts early buyers, then rolls back down. Waiting for a bullish close above the high gives the setup a defined trigger.
- Entering in the middle of a range: The hammer forms between the range's boundaries, where price has no clear reason to sustain an advance. Check whether it's near a meaningful edge rather than assuming the wick marks support.
- Chasing the close: Buying as the hammer forms can leave you exposed before the next session proves that demand continues. A later confirmation entry may be less favorable in price, but it requires an additional sign of strength.
- Setting an arbitrary tight stop: A stop placed just under the body may sit inside the hammer's ordinary price range. Use the wick low to define the setup's structural invalidation, then size the position to that distance rather than shrinking the stop to fit a preferred trade size.
Illiquid trading adds another caution. If a market has thin participation, a sharp wick may reflect limited trading rather than broad rejection of lower prices. Don't read every excursion as a meaningful contest between buyers and sellers; confirm that the instrument and session are suitable for the setup you're testing.
A stop below the hammer's low doesn't make the trade safe. It gives the trade a logical failure point, but gaps, slippage, and poor position sizing can still make a loss larger or a setup unattractive. Plan for failure before entry, not after the chart moves against you.
Your Hammer Trading Playbook With Risk Math
Write the setup down before you enter. Identify a decline or pullback, mark a relevant demand area, and wait for a hammer that fits the anatomy. Then require a later bullish candle to close above the hammer's high. If price breaks the hammer's low before the trigger appears, the setup is invalid under this plan.
Calculate size from the stop distance
Measure the distance from your planned entry to the price below the hammer's low that marks your invalidation. That's the trade's risk per unit before fees or slippage. Choose the amount of account capital you're willing to risk, then divide that amount by the loss per unit at the stop to calculate position size. If the distance to the stop is wide, the position size must shrink; don't tighten the stop just to trade more units.
For example, if the confirmation close leaves a large gap between entry and the hammer's low, the same account-risk limit supports a smaller position than it would with a closer stop. You don't need to invent a fixed lot size or a universal risk percentage. Use your own predefined risk limit and the instrument's point value, and account for trading costs. Colibri Trader's guide to position sizing in trading covers the broader sizing principle.
Plan exits around structure. A prior swing high can provide a nearby target; the origin of the latest impulse may offer another area to watch. Consider taking part of the position at the first target and managing the remainder according to your plan, rather than holding without a defined exit.
Before each trade, ask:
- Trend: Has price declined into the setup, or is the hammer fighting a strong move?
- Location: Is it near a meaningful demand area or just in mid-range noise?
- Confirmation: Has a candle closed above the hammer's high?
- Risk: Is the stop logical, and does the position size fit your account-risk limit?
Journal the entry, stop, targets, market regime, and outcome. Track win rate, average reward-to-risk, and maximum adverse excursion across a consistent sample of at least thirty trades. Those measures won't guarantee future performance, but they can reveal whether your rules are producing worthwhile results in the conditions you trade.
Colibri Trader offers price-action education, including guidance on candlestick patterns, supply and demand, and position sizing. If you want structured lessons to help you practice the hammer setup and refine your broader chart-reading process, explore Colibri Trader.