
Free Price Action Trading Course: A Complete 2026 Guide
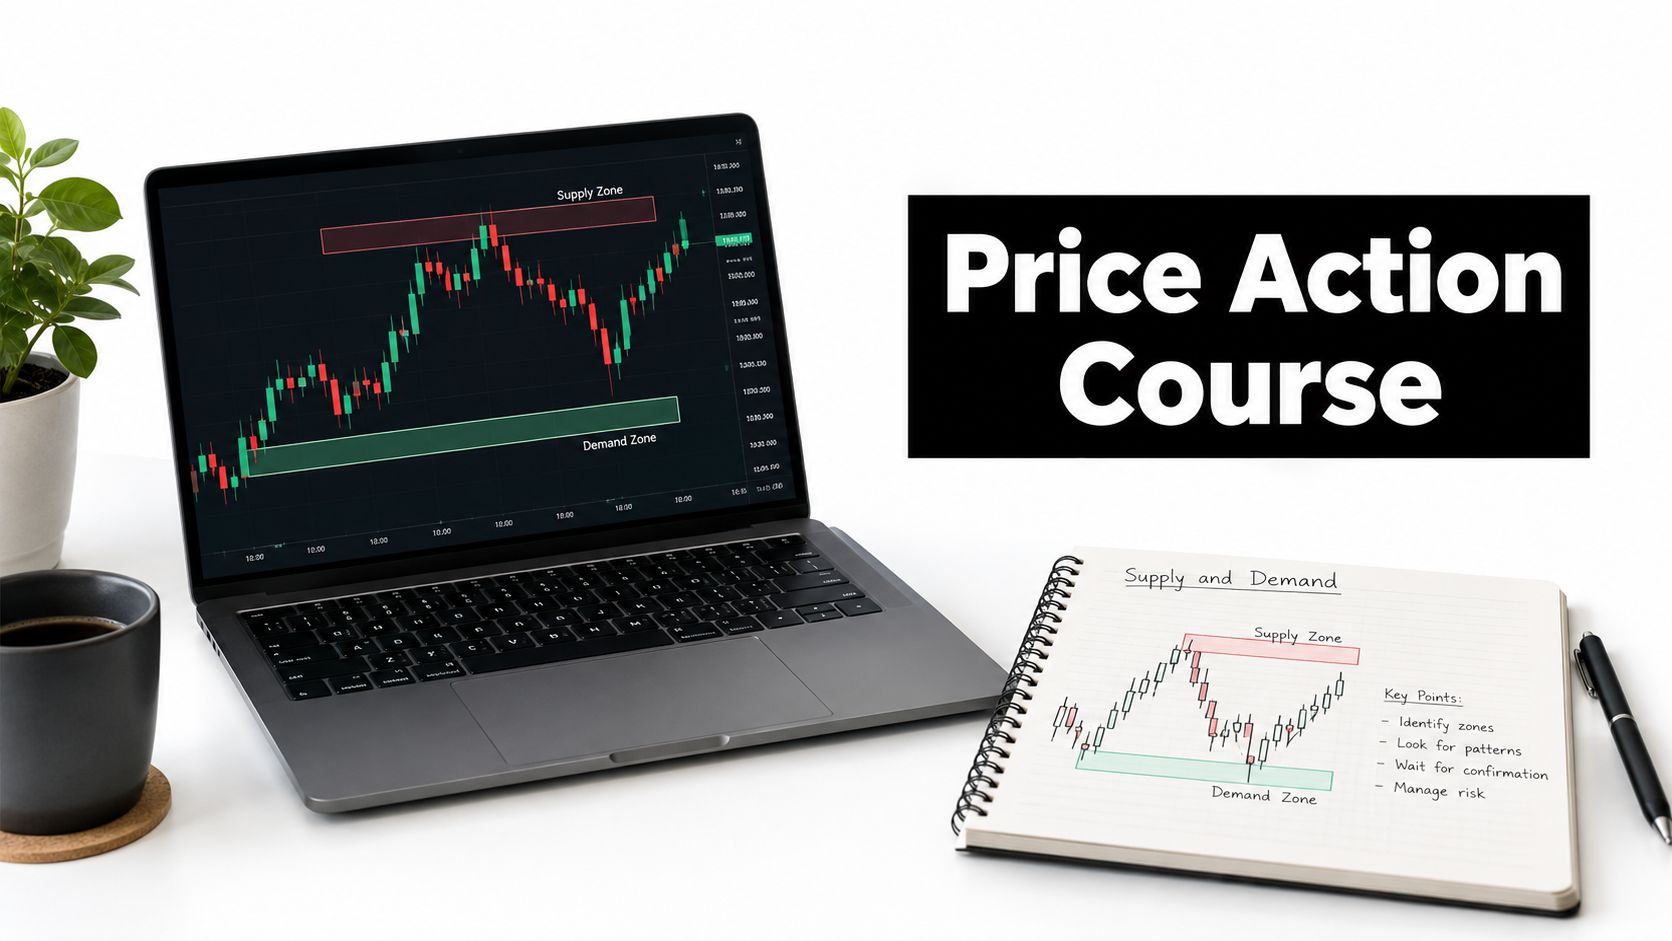
You've watched trading videos, added indicators, removed them, and saved more chart patterns than you can remember. Yet when price reaches a level you've marked, you still hesitate. Is this a sensible trade, or are you finding reasons to enter because you've been staring at the screen?
A useful free price action trading course should help you answer that question before teaching you another entry pattern. Start with what makes a trade unsuitable, learn to read the chart, and practice making decisions without putting money at risk.
Who This Free Price Action Trading Course Is For
This learning path is for beginners who need a starting point and traders who already recognize patterns but can't apply them consistently. You don't need a crowded chart or an impressive trading vocabulary. You need a repeatable way to separate an interesting price movement from a trade you can reasonably manage.
A playlist can explain individual techniques. A structured mini-course adds something more useful: prerequisites, exercises, and checkpoints. You learn what a candle shows before interpreting a rejection, and you identify a meaningful level before deciding whether that rejection matters.
Learn decisions rather than signals
The distinction matters because trading activity isn't the same as trading skill. A peer-reviewed study of individual investors in Colombia02686-4), examining trading from 2006 to 2016, found annual abnormal gross returns of approximately −4.0% to −4.3%, depending on the model, with worse performance after transaction costs; the most active investors generally performed worse than less active investors.
That finding doesn't test this curriculum or prove that price action produces profits. It supports a narrower lesson: don't treat more trading as the solution to uncertain decisions.
Use your study time to build these abilities:
- Read the chart: Describe direction, turning points, and nearby obstacles without searching for an entry immediately.
- Filter setups: Explain why a pattern belongs on your watchlist, or why you should ignore it.
- Control exposure: Match position size to a planned loss rather than to confidence or available borrowed funds.
- Review decisions: Record what you knew before entering, then compare your actions with your plan.
Set a realistic finish line
By the end, you should be able to annotate a clean chart, write an entry condition, define invalidation, calculate a suitable position size, and journal a simulated trade. Those are practical learning outcomes, not promises of income.
Learning checkpoint: If you can describe why you passed on a trade, you're developing a skill that a collection of winning screenshots can't demonstrate.
You can work through this material self-paced using chart replay, a demo account, and written notes. Keep real money separate from early experimentation. If you're looking for dependable income immediately, trading education shouldn't become a substitute for protecting your savings.
A beginner's success is a defensible decision made consistently. Profitability requires further evidence, including realistic costs and performance outside the examples used to learn the method.
What Price Action Actually Means Before You Start
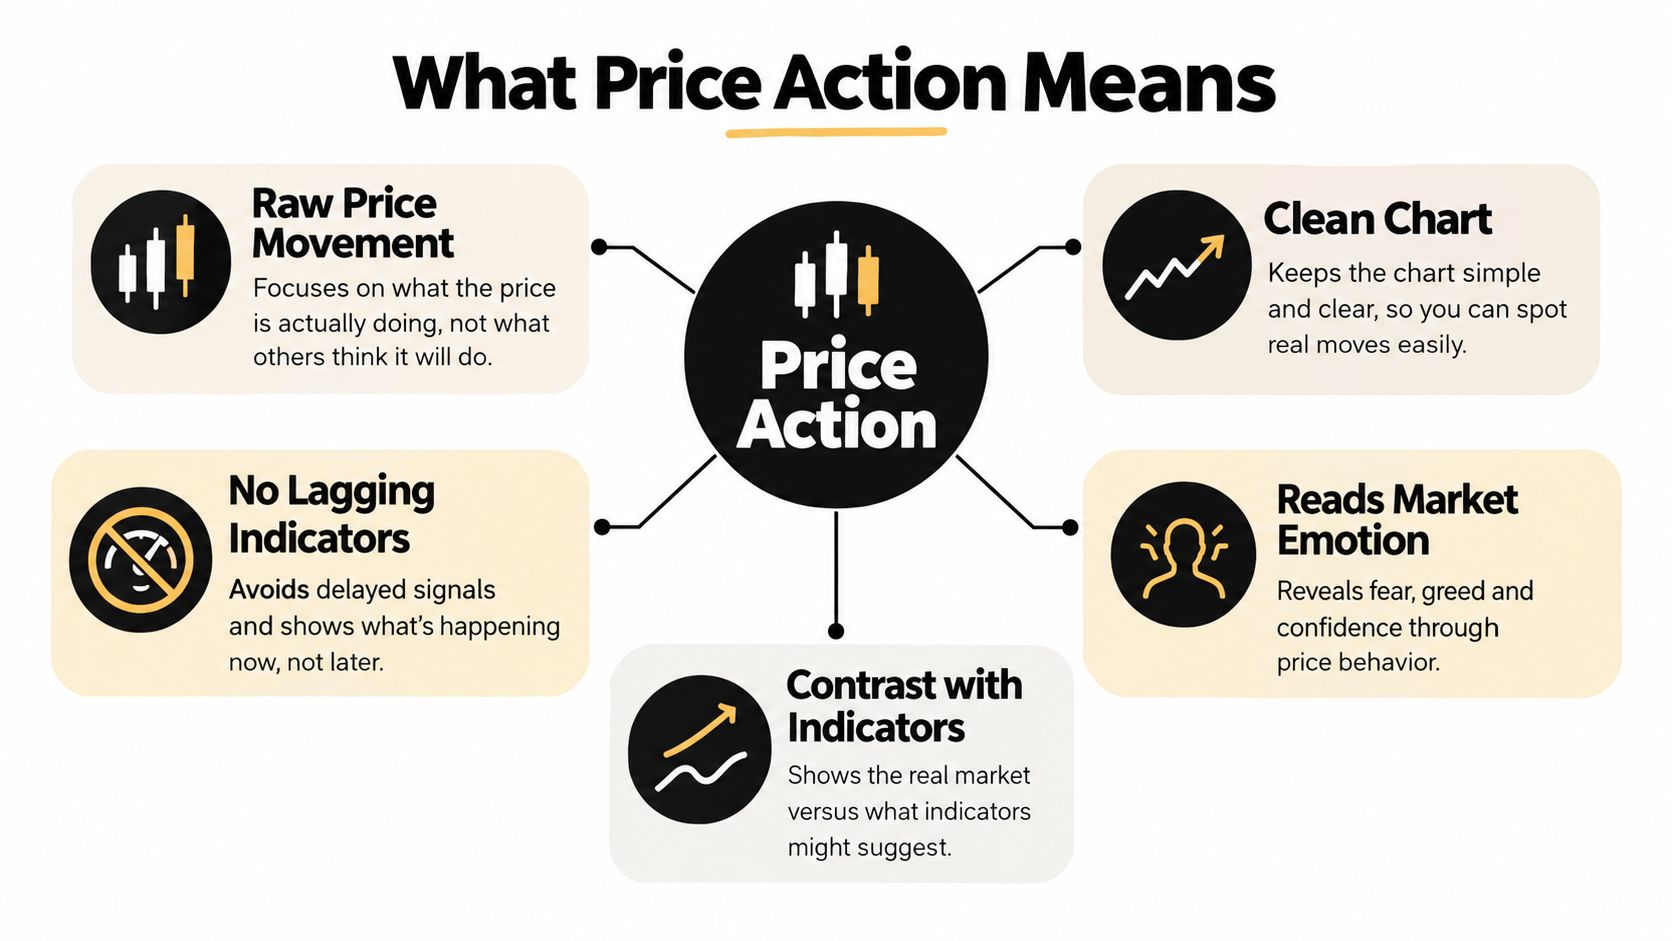
Price action means studying observable price movement to understand the current trading context. On a candlestick chart, that includes where price opened and closed, how far it moved, and how the latest movement relates to earlier swings.
Indicators transform market data into another display. That can be useful, but adding displays doesn't automatically answer whether a trade makes sense. An indicator-free approach keeps attention on price itself; it doesn't remove uncertainty or reveal every participant's intentions.
The concept map provides a visual starting point, with an important caveat: market emotion is an interpretation, not something a chart directly measures.
Read the chart without inventing a story
Consider a candle with a long lower wick that closes near its high. Your annotation might read: price traded lower, then recovered before the close. That's observable. Writing that institutional buyers entered would go beyond what the candle alone establishes.
Support and resistance are areas where earlier price movement changed direction or stalled. In a hypothetical chart, price repeatedly turns lower near the same area. Mark that area as possible resistance, not as a guaranteed ceiling.
A supply or demand zone is a broader region associated with a departure in price. Suppose price pauses, then moves sharply upward. You might mark the pause as a candidate demand zone and watch how price behaves on a return. The label doesn't prove that unfilled orders remain there.
Momentum shifts describe changes in the character of movement. A climb with strong closes followed by overlapping candles and limited progress is different from an uninterrupted advance. Your annotation should describe that change before predicting its outcome.
Keep the interpretation modest
| Chart observation | Reasonable interpretation | Unsupported leap |
|---|---|---|
| A wick below support | Lower prices were rejected during that candle | The next candle must rise |
| A close above resistance | Price finished beyond the marked area | The breakout can't fail |
| Slower upward progress | Buyers made less visible progress | A reversal is certain |
For broader context, The Money Maniac's explanation of how technical analysis works is a companion resource.
The exercises here don't require indicators, fundamental valuation, or news predictions. However, using a clean chart doesn't mean ignoring scheduled announcements or instrument-specific risks. The method organizes observations; it isn't permission to trade every recognizable shape.
The Lesson Plan, Sample Setups, and Homework
Work through the lessons in sequence, keeping a folder of annotated charts and written decisions. Use the free Trading Potential Quiz as an initial assessment prompt, not as evidence that you're ready to risk capital.
The screenshot shows the quiz entry point.

Build the chart-reading foundation
The chart-basics module starts with candles, swing points, and timeframes. Open a chart, hide future candles, and label the visible direction as rising, falling, or ranging. A hypothetical setup might show a small upward move inside a broader decline; annotate it as a pullback rather than assuming a new uptrend.
Your homework is to compare the same movement on a broader and a closer view. Explain what changes and what remains relevant.
The support-and-resistance module uses EURUSD and a chart labelled US500 for practice. Mark areas where price previously reacted, then distinguish clear boundaries from clutter. Check what your platform's US500 instrument represents before considering any live position.
For a hypothetical breakout-and-retest setup, label the former resistance, the return toward it, and the condition that would invalidate a bullish interpretation. Homework: save both a convincing level and an ambiguous one, explaining the difference.
Develop a setup and a management plan
The supply-and-demand module asks you to mark candidate zones before revealing later candles. Annotate the base, departure, return, and potential invalidation. Don't redraw the zone afterward just to make the example look successful.
If you encounter a BOSS-labelled setup in teaching material, require its rules to be defined before judging it. No verified BOSS trade is established here, so treat the practice example as hypothetical rather than a documented result.
Use the video as a chart-study companion. Pause it to write your interpretation before comparing it with the explanation.
The trade-management module turns an attractive chart into a complete decision. Annotate the intended entry, protective stop, potential exit area, and reasons to cancel. Homework is a simulated trade recorded using the principles in what a trading journal should contain.
The trading-plan module brings those notes together. Write which conditions you'll study, what disqualifies a setup, how you'll manage exposure, and when you'll review decisions. Test the plan against an awkward chart, not only a textbook example.
Use the available opening sample chapters of the price-action book as a reading companion to the foundations. Read a passage, translate it into a chart annotation, and record anything you can't yet explain. That turns reading into practice rather than another item on a saved-content list.
The Most Overlooked Lesson in Any Free Course
A beautiful pattern can still be an unsuitable trade. If the required stop makes the smallest available position too risky, or trading costs leave little room before the next obstacle, better pattern recognition won't solve the problem.
Account restrictions matter too. A comment on FINRA's proposed day-trading framework changes%20Comment%20on%20Regulatory%20Notice%2024-13_2.28.2025.pdf) discusses the existing $25,000 pattern-day-trader equity requirement, buying power generally limited to roughly four times maintenance-margin excess, and proposed 2025 changes toward intraday margin requirements. That document describes a proposal, not proof of the rule currently applying to your account.
Check current requirements with your broker. Don't assume that rules for margin-account equity trading apply identically to futures, options, or CFDs.
Calculate exposure before deciding to enter
The task is to decide whether the trade fits your constraints, not merely whether the candle looks persuasive.
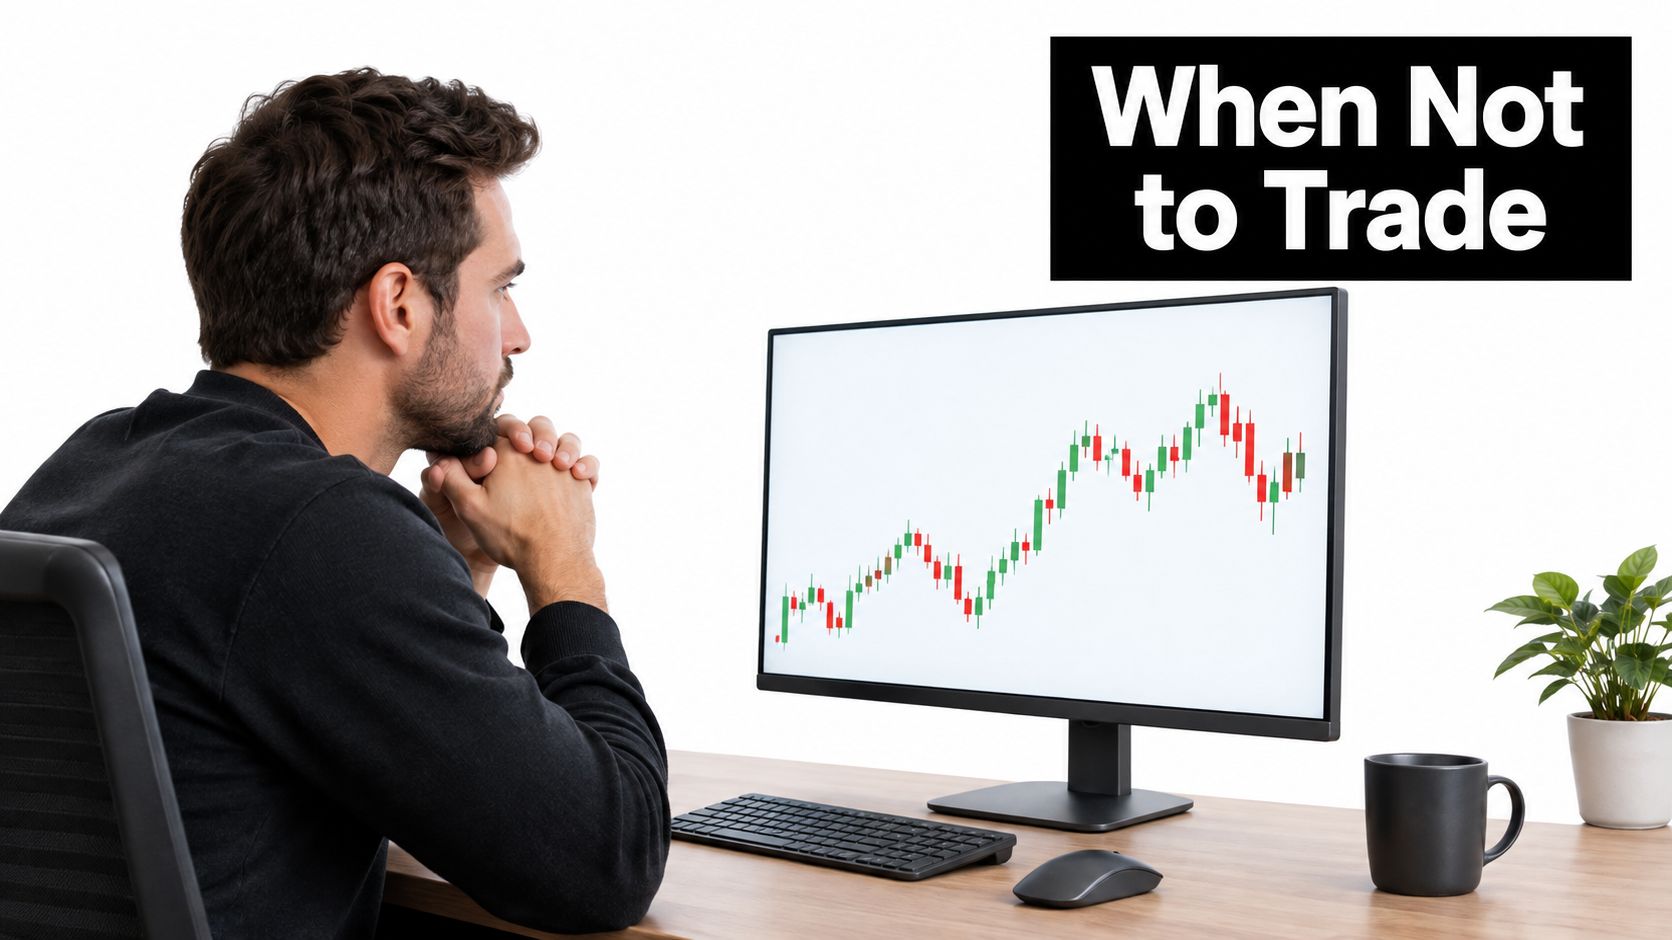
A practical sizing relationship is:
Position size = planned cash risk ÷ estimated loss per unit at the stop
Estimate the per-unit loss using entry-to-stop distance and the instrument's value per price movement. Allow for applicable costs and plausible adverse execution. A stop order doesn't guarantee that the final loss will equal your estimate.
Suppose a hypothetical short setup requires a stop beyond a wide supply zone. Moving the stop closer to afford a larger position changes the trade's logic. Reduce size instead, or pass if the minimum tradable size still exceeds your limit.
Give yourself explicit reasons to stay flat
Use a pre-trade filter:
- Direction: Is the setup aligned with your chosen context, or is it a countertrend exception your plan permits?
- Level quality: Was the area marked before the signal appeared, or added afterward?
- Available room: Does a nearby opposing level constrain the potential reward?
- Execution: Could spread, slippage, or thin liquidity undermine the planned entry and exit?
- Capacity: Can you absorb the loss without affecting essential expenses?
A trade you can't size responsibly is a trade you can't take responsibly.
Options introduce additional issues that a simple chart-distance calculation may not capture. If your concern involves suspected misconduct rather than an ordinary trading loss, Kons Law's discussion of options trading loss recovery options offers a separate legal-information resource. Don't confuse potential legal remedies with protection against normal market losses.
How to Verify Signals, Charts, and Teachers Online
A chart screenshot can look persuasive while leaving out almost everything needed to evaluate a trading method. You may see an entry arrow and a profitable exit without knowing when either was marked, what other trades occurred, or whether the trade was executable.
Information security belongs in trading education. The IFEC retail-investor study found that more than 80% of respondents had heard of AI investment tools, while 4% reported using them; among respondents affected by investment-scam messages, 66% cited WhatsApp, with WeChat and SMS at 37% each. These findings concern the study's respondents, not every trader or every messaging group.
Inspect the evidence behind the explanation
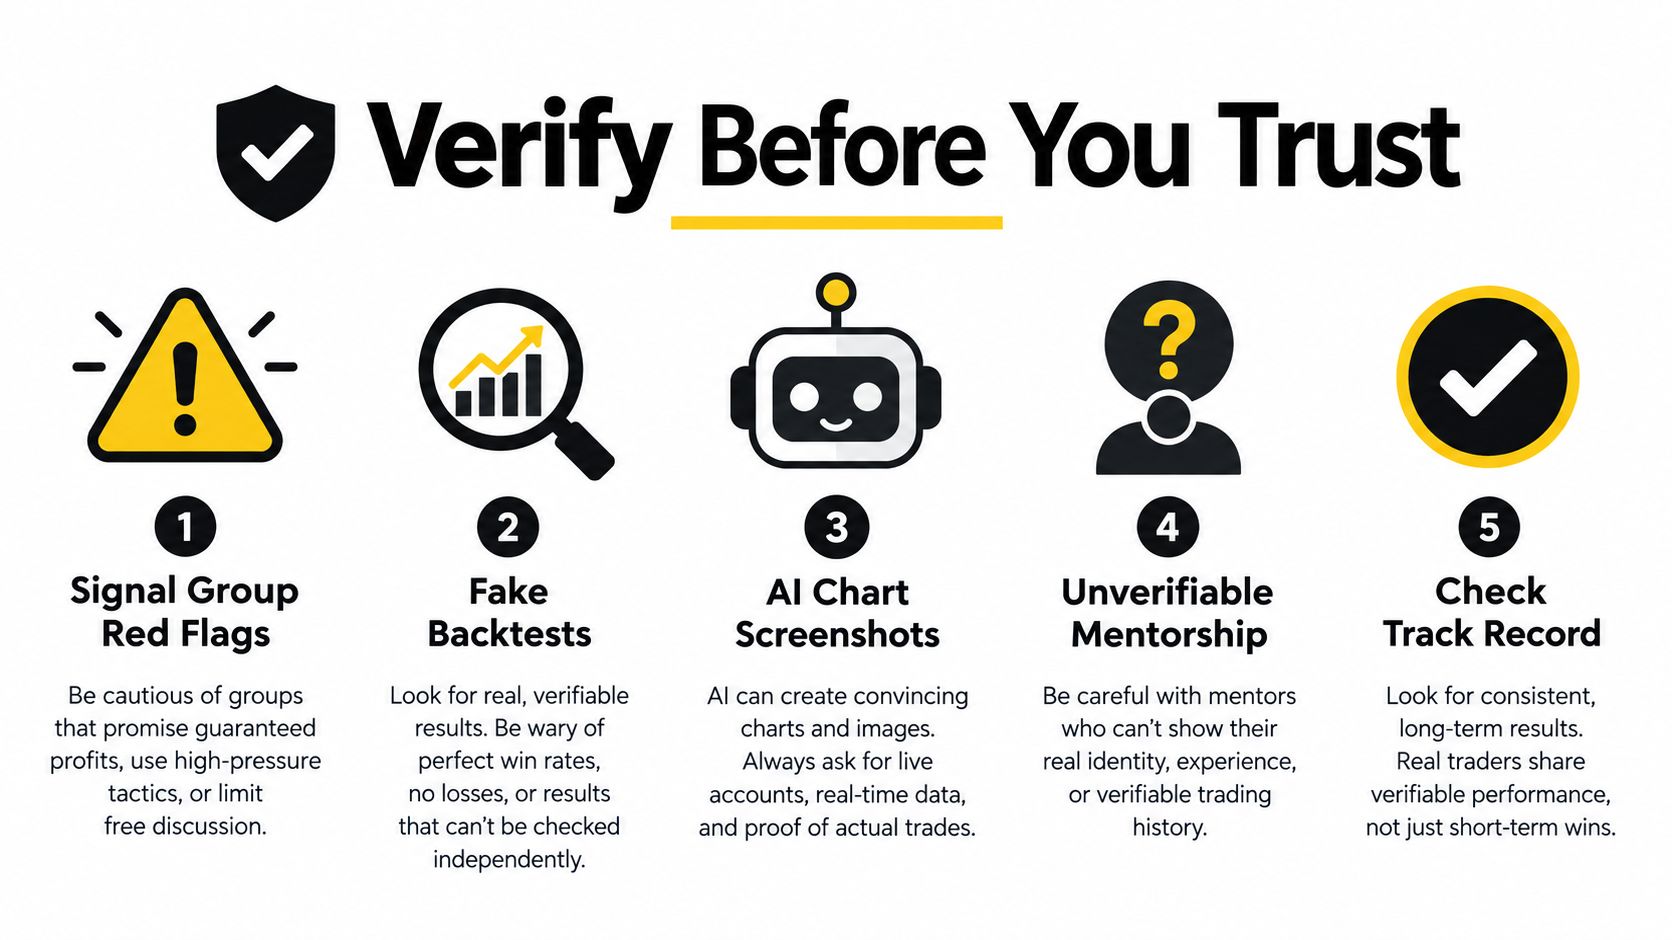
Use this checklist when reviewing a signal, backtest, or mentorship claim.
Start with timing. Was the analysis saved before price moved, or posted afterward? A timestamped pre-trade chart and an unedited follow-up offer more useful evidence than an isolated result.
Then inspect selection. Ask whether failed signals and cancelled trades remain visible. If only winners survive in the archive, you can't judge the method from the displayed examples.
For backtests, look for written rules, the tested market conditions, and explicit treatment of spread, commissions, and slippage. Check whether the author changed rules after seeing results. A polished equity curve doesn't answer those questions.
Separate teaching quality from performance claims
- Signal-group pressure: Treat urgency, secrecy, and demands to transfer money as reasons to stop and verify.
- Screenshot authenticity: Don't assume a realistic-looking chart is genuine, complete, or evidence of an executed trade.
- Mentorship claims: Ask what feedback you'll receive and whether the instructor teaches invalidation and losing scenarios.
- Track-record scope: Distinguish hypothetical demonstrations from independently verified account results.
The guide to how to find a day trading mentor is a useful starting point for forming questions. Assess the answers rather than relying on presentation or confidence.
Evidence standard: A clear explanation can be educational without proving that its author has a profitable live trading record.
Keep your own files dated and separate pre-trade observations from post-trade conclusions. That protects you from hindsight in your own learning as well as in someone else's marketing. Never share brokerage credentials, authentication codes, or remote access just to join a course or receive signals.
Reading the Real Market Context Around Your Charts
A currency chart is a narrow view of a much larger market. The Bank for International Settlements' global FX analysis reported average daily OTC turnover of approximately $9.6 trillion in April 2025, compared with $7.5 trillion in April 2022, an increase of about 28%; emerging-market currencies accounted for 29% of turnover in April 2025.
That scale provides context, not confirmation for an individual trade. Participants transact for different reasons, including hedging and speculation. You can observe the resulting price movement without knowing the motive behind each transaction.
Follow a hypothetical trade from context to exit
Consider EURUSD approaching a previously marked supply area while the broader chart shows declining swing highs. Your initial task is not to sell immediately. It's to check whether the return still fits the bearish context.
Use market structure analysis to organize those swing relationships. If price has already broken the structure your idea depends on, the old zone may no longer justify the same trade.
Suppose a bearish candle then closes with a body that engulfs the previous bullish candle's body at the area. That supplies a possible entry condition, not certainty. Check whether nearby demand leaves adequate room and whether execution conditions meet your written filter.
Apply the sizing method to your predetermined cash-risk budget. Place the planned stop where the setup would be invalidated, then calculate whether a permissible position exists. If it doesn't, record a rejected setup instead of forcing an entry.
Connect each decision to its lesson
| Decision in the example | Skill being applied |
|---|---|
| Describe the broader decline | Chart basics and timeframe context |
| Assess the marked supply area | Levels and zone selection |
| Wait for the defined candle close | Rule-based setup recognition |
| Check affordability and execution | Trade management |
| Follow the written cancellation conditions | Trading-plan construction |
Before entering a simulated trade, save the chart and state the reason for the decision. Afterward, record the actual sequence: whether the entry triggered, whether your planned exit remained available, and whether you followed the rules.
A losing result doesn't automatically mean the setup was misread. A winning result doesn't excuse moving a stop or entering before confirmation. Review outcome and decision quality separately so that a fortunate result doesn't reinforce a poor habit.
The complete loop ends with a review note, not with the exit button. Identify whether the next practice session should address context, execution, or adherence. Change the specific weakness you observed rather than replacing the entire method after an uncomfortable trade.
Your Next Step, the Quiz, and Where to Go Deeper
Take the free Trading Potential Quiz as a benchmark for your current understanding. Answer from your actual habits rather than from what you think a disciplined trader should say. Use any gaps it exposes to choose your next exercise.
Download the opening sample chapters of the price-action book and use them alongside the chart-basics practice. The Amazon bestseller description isn't evidence of trading performance. The useful question is whether you can apply the explanations to a chart you haven't already seen.
Choose support to match the problem
Free materials remain a sensible choice when you're still building basic habits. Chart replay, demo practice, and a journal let you test whether you can work methodically before paying for additional instruction.
Consider paid study only when you can describe the support you need:
- Basic: Explore this route if you want a more structured learning sequence and accountability. Confirm how those features are delivered before enrolling.
- Premium: Consider personalized mentorship when you need feedback on your own decisions. Check the current availability and scope of individual support.
- Supply & Demand: Choose a focused track if zone selection is the specific skill you want to refine.
- Day Trading: Explore this track if intraday decision-making fits your schedule and the instrument you understand.
Don't buy a more advanced course because a recent loss made you anxious. Ask whether the program addresses a documented weakness, what work it requires, and whether you can afford it without increasing financial pressure.
Leave with a practice task
During your next study session, open a familiar chart and mark the clearest relevant levels. Choose a hypothetical setup, write its invalidation and sizing logic, and save the chart before revealing what happens next.
Journal the simulated decision, including a pass if the conditions aren't suitable. Then review whether your annotation was clear enough for someone else to understand without your explanation.
Your immediate target is modest: a complete, reviewable trading decision. That's a more useful starting point than finding another pattern to memorize.
Colibri Trader offers a free Trading Potential Quiz, sample price-action book chapters, and structured programs with mentorship options. Visit Colibri Trader to take the quiz and access the sample reading, then put the lesson into practice on a chart before deciding whether you need deeper training.