

Supply and Demand Principle Explained for Traders

You're watching a chart when price stalls near a level you've marked, then suddenly surges away. You hesitate, wait for a pullback, and the market keeps moving without you. Later, you wonder whether an indicator would have helped, even though the clue may have been simpler: buyers or sellers overwhelmed the other side at that price.
The supply and demand principle can help you read that imbalance. It won't tell you exactly what price will do next, but it gives you a way to ask better questions: Who's pressing the market? Is the move supported by activity, or is a shortage squeezing price higher? And is the level still worth watching, or has the market already used it?
Why Price Jumps From Some Levels and Ignores Others
You mark a support level. Price approaches it, pauses, and then drops straight through. A little later, it reaches another area, snaps upward, and leaves behind a sharp move that never gives you the neat retest you wanted. The first level attracted little buying. At the second, buyers met the available supply with enough force to move price away.
That difference is easy to miss if you treat every horizontal line as equally important. Price action gives you a more useful question: What happened when price traded there? A slow drift away suggests less urgency than a strong departure. A quick rejection can signal that one side absorbed the other's orders, though a chart alone can't prove why every participant acted.
A moving average or oscillator may help organize information, but it won't explain the market's underlying cause by itself. Price and quantity clues matter. If price rises alongside stronger activity or consumption, that can support a demand-driven interpretation. If price rises while production, available inventory, or quantities traded fall, a supply disruption may be behind the move.
Start with the imbalance, not the line. A level matters because of the activity around it, not because you drew it neatly.
This guide moves from the basic economic idea to chart zones, then to diagnosing breakouts and planning entries and exits. The method fits a no-indicator price-action approach: observe where price moved forcefully, wait for price to return, and decide whether the evidence still supports a trade. For a useful companion on the forces behind market participation, read Unitism's guide to why speculation moves markets.
Before drawing zones, learn to read the broader swings that shape them. A practical market structure analysis can help you distinguish a meaningful departure from noise inside a choppy range.
How the Supply and Demand Principle Really Works
Start with a simple distinction: demand isn't just wanting something. It means wanting and being able to pay for it. Supply isn't everything that could possibly be sold, but the goods brought to market.
Consider a market stall selling apples. If shoppers are ready to buy more apples than the stall has available, buyers compete for what remains. The seller can ask for a higher price. If the stall is full and shoppers aren't buying enough, the seller may lower the price to attract them. The price changes because the balance between what buyers can purchase and what sellers offer has changed.
Adam Smith gave one of the earliest systematic explanations of this mechanism in The Wealth of Nations, published in 1776. He distinguished a commodity's natural price, which covers rent, wages, and profit, from its market price, which responds to the relationship between supply and effective demand. When the quantity offered falls short of what buyers are willing and able to purchase, competition among buyers can push the market price above its natural level. When sellers bring more than buyers will purchase, competition among sellers can pull it down (Adam Smith's explanation of natural and market price).
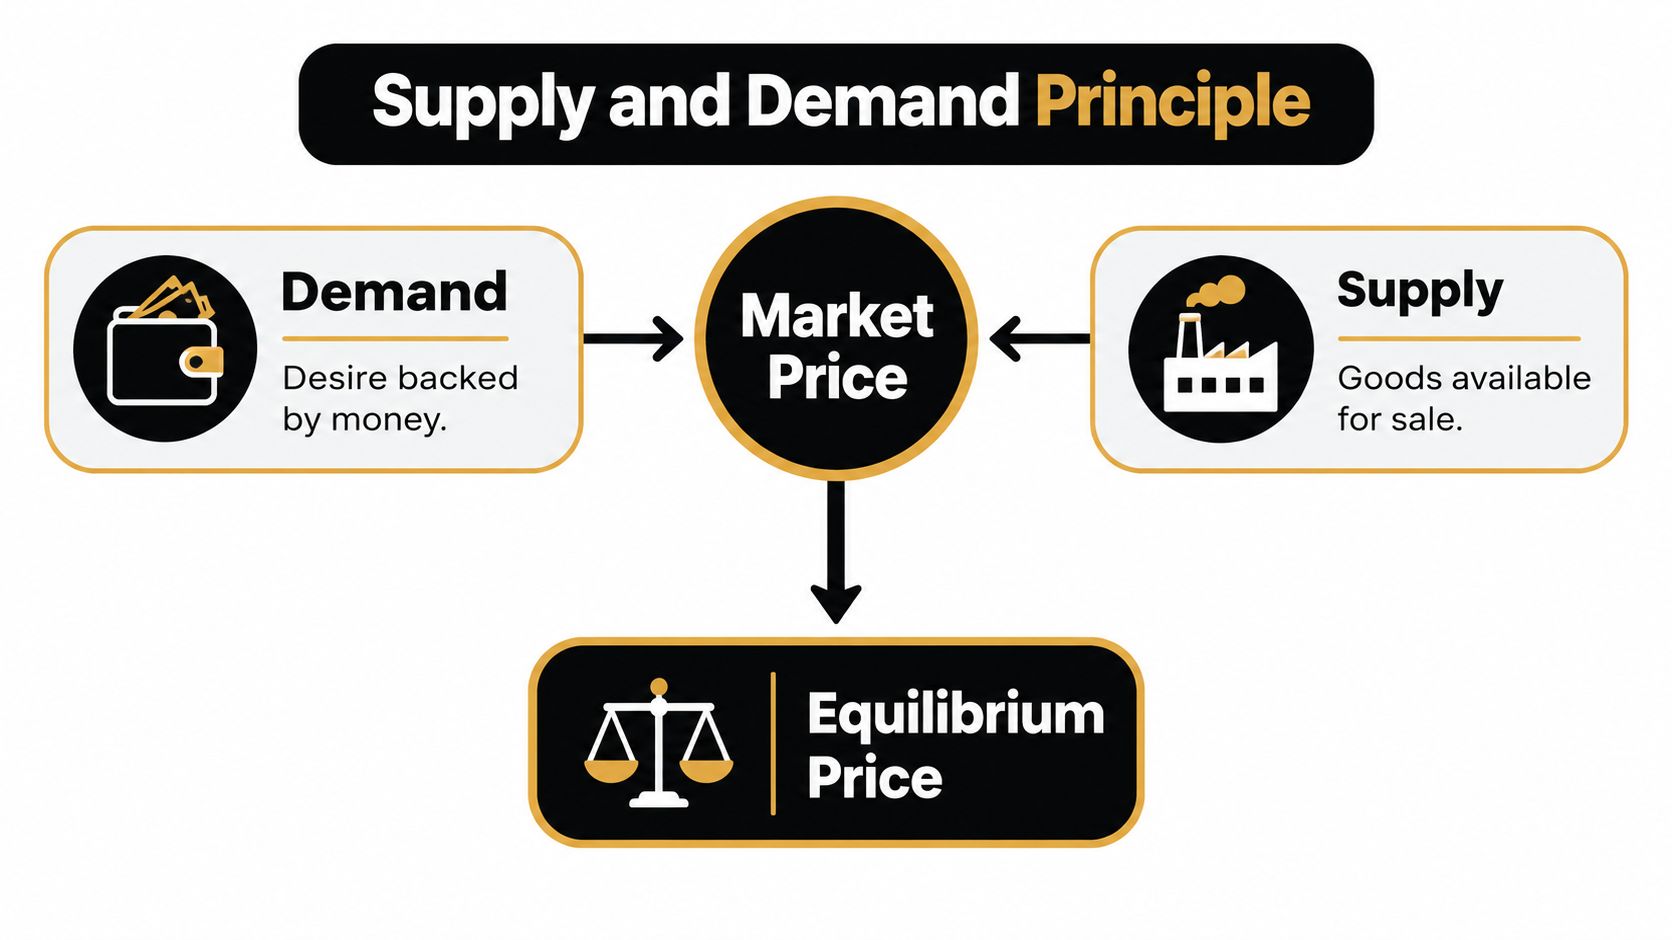
The market price isn't a promise that every trade will happen at one fair or permanent value. It reflects the point where willing buyers and sellers meet at a given moment. In trading, that balance can shift quickly: fresh buyers may enter, sellers may withdraw offers, or a sudden shortage may leave buyers competing for fewer available units.
When available supply falls short, price faces upward pressure. When goods go unsold, sellers face pressure to accept less.
That's the principle in plain language. It applies beyond physical goods, including labor, energy, foreign exchange, and financial markets. A chart is one way to observe the resulting price movement, but it doesn't show every order or every reason behind it. Use the principle as a framework for interpreting what price and quantity clues suggest, not as a claim that you can see the whole market.
How Supply and Demand Zones Form on a Price Chart
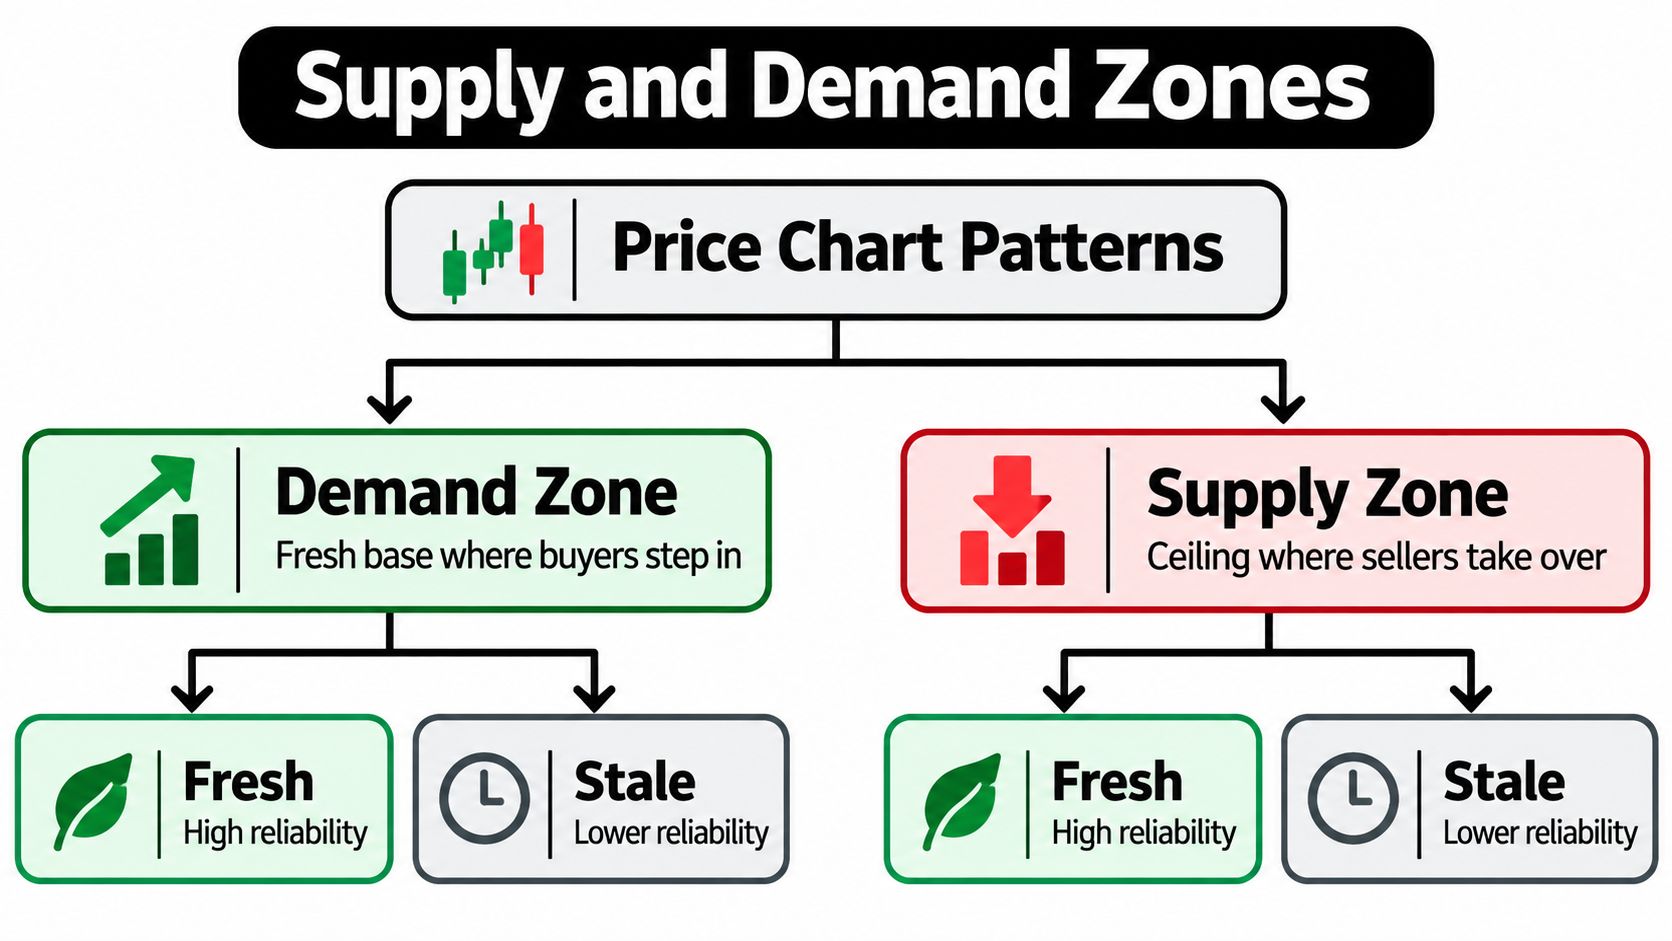
A zone is an area where price previously showed a clear imbalance, not a magical line that must hold. When price pauses briefly and then leaves with force, traders may mark the base of that move as a possible demand or supply zone. The base can show where orders met before price moved sharply, but you still need to judge the context and the response when price returns.
A demand zone often appears where price forms a short base and then rallies decisively. Traders may describe the pattern as rally-base-rally when price pauses during an up move before continuing higher. A supply zone can form when price bases and then drops sharply, sometimes described as drop-base-drop. These pattern names help organize what you see. They don't guarantee a future reaction.
What makes a zone worth watching
Look for a departure that stands out against nearby price action. A swift rally away from a base may indicate buyers were more aggressive than sellers in that area. A sharp selloff may point to the opposite. A pinbar or engulfing candle at the zone can provide evidence of rejection, but it's one clue, not a mechanical entry signal.
Freshness matters too. If price hasn't returned since the sharp move away, the zone is untested on the chart. After a retest, some of the orders that may have supported the original departure could already have been absorbed. That doesn't mean every used zone fails. It does mean you shouldn't assume it carries the same weight as a fresh one.
Don't mark every pause. A long, uneven drift away from a base may show little urgency, and a base buried inside a tight, choppy range may be hard to distinguish from routine noise. Give more attention to clear departures and simpler structures.
For a closer look at how horizontal levels fit into chart reading, see this guide to support-level trading. Remember that a supply or demand zone is broader than a thin line: it gives you an area to watch, while price action on arrival helps you decide whether the idea still makes sense.
Demand Breakouts Versus Supply Squeezes and How to Tell Them Apart
A rising price doesn't tell you by itself whether buyers are pulling the market higher or sellers have made goods harder to obtain. Both forces can produce a rally. The difference matters: a positive demand shock generally pushes price and quantity in the same direction, while a negative supply shock can push price up as quantity falls.
That gives you a practical diagnostic. Don't ask only, “Is price breaking out?” Ask what's happening to trading activity, production, inventories, delivery times, employment, and consumption. A chart may show a surge, while market information outside the chart helps you judge whether more buyers are participating or available supply is tightening.
| Signal | Demand breakout | Supply squeeze |
|---|---|---|
| Price | Rises as buyers pursue the asset or goods. | Rises as available supply contracts. |
| Quantity clues | Activity or consumption may rise alongside price. | Production, available inventory, or quantity may fall even as price rises. |
| Follow-through | Watch whether buying interest persists and price holds its progress. | Watch whether the shortage continues, or supply begins to recover. |
| What could challenge the idea | Weak activity or fading participation can undermine the demand explanation. | Replenished stock, improved delivery, or substitute supply can ease the squeeze. |
The Cleveland Federal Reserve's analysis describes this contrast in broader economic terms: demand shocks can raise employment, interest rates, and inflation, while supply shocks can raise inflation as employment falls. Its estimates also found a larger price-level effect from supply shocks than demand shocks, about 0.25% versus 0.05% after slightly less than three years (Cleveland Fed analysis of supply-chain disruptions and inflation).
That doesn't make the distinction easy in real time. Volume can be ambiguous, and useful production or inventory data may arrive slowly. In forex or equities, traders may need to consider related markets and broader economic clues rather than look for one perfect signal. Treat the checklist as a way to test your explanation, not a shortcut to certainty.
If price rises but the quantity evidence points to a supply problem, don't automatically call it a healthy demand breakout.
Simple Price Action Setups Entries and Exits
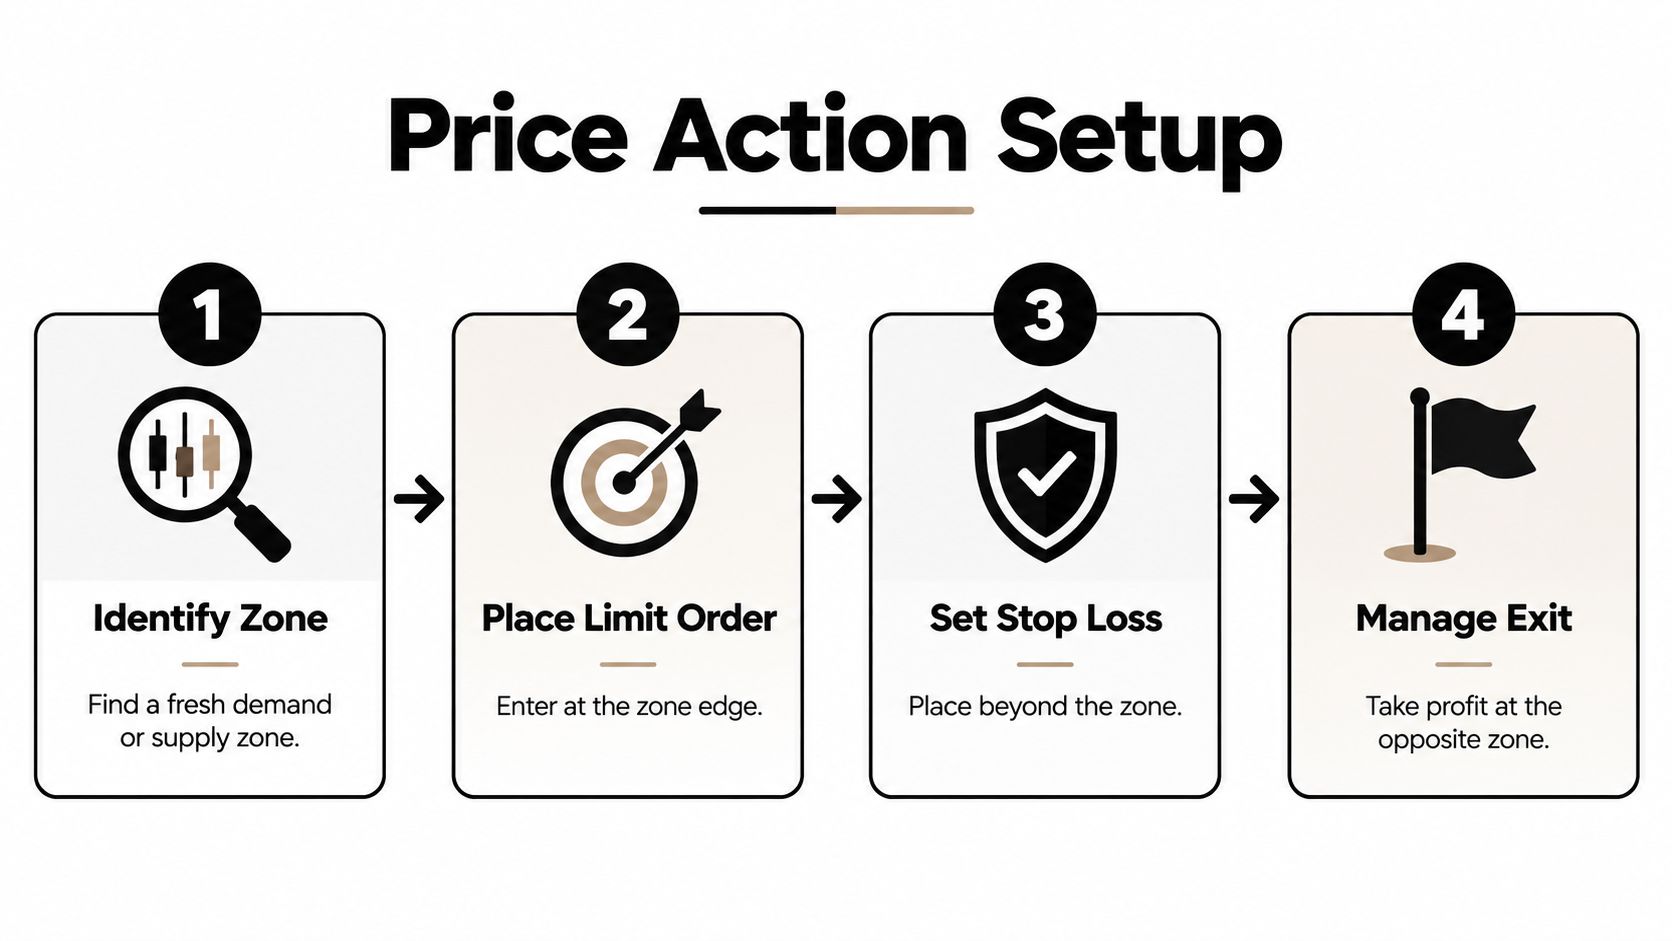
A zone gives you a place to pay attention. Your plan decides what to do there. Before price returns, identify the zone, decide what would invalidate your idea, and work out whether the potential target makes the risk acceptable. If you can't define those conditions in advance, don't improvise once the candles start moving quickly.
Plan the entry around the zone
Some traders place a limit order near the edge of a fresh zone, aiming to enter without waiting for extra confirmation. That approach requires accepting that price may pass through the area without reacting. Others wait for a pinbar, engulfing candle, or quick rejection to show that buyers or sellers have responded. Confirmation may reduce uncertainty, but it can also mean entering later.
Put the stop beyond the point that would invalidate the setup, often beyond the far edge of the zone. Don't squeeze it into the zone just to make the trade look smaller. If the market moves through the area and holds beyond it, your original idea may no longer be valid.
Set an exit before you enter
An opposing supply or demand zone can provide a possible target. You might take part of a position there, then decide whether to hold the remainder or protect it if price continues. A stop moved to break-even or managed with a trailing approach can change how a trade develops, but it doesn't remove the need to plan the exit. This guide to setting a trailing stop loss offers more context on that technique.
The key is consistency, not finding a setup that never loses. Risk only what you can afford to lose, and skip a trade when the distance to your stop makes the target unattractive. A zone that price has tested repeatedly, or one it reaches with a slow, overlapping drift, may offer a weaker case than a fresh area followed by a decisive response.
For a visual walkthrough of price-action ideas, you can watch the video below. Then replay charts or use a demo account to practise following the plan without changing it mid-trade.
Common Pitfalls That Destroy Supply and Demand Trades
The first mistake is treating a zone as a guarantee. A fresh area can fail, and a level that already drew several returns may have less untested interest behind it. If you mark zones inside every small fluctuation, the chart fills with reasons to trade and no clear way to rank them. Focus on the areas tied to a decisive departure, then accept that a setup can still be wrong.

Another costly error is buying every sharp rally as if it proves lasting demand. A supply shock can lift prices while reducing the quantity available. If you chase a squeeze without checking inventories, production limits, or substitution, you may enter just as the pressure begins to ease.
The 1973–74 oil crisis shows how a supply reduction can drive a sharp price response when producers can't quickly expand output. Oil traded at approximately $2.90 per barrel before the Arab oil embargo and reached $11.65 per barrel in January 1974 after production cuts by the Organization of Arab Petroleum Exporting Countries. The Federal Reserve's historical account points to limited spare production capacity in the United States as one reason producers couldn't rapidly replace the missing supply (Chicago Fed account of the oil crisis).
Separate a fast spike from a persistent shift
A sudden move can be temporary, or it can reflect a deeper change in supply conditions. Low inventories, constrained production capacity, and a lack of substitutes can make disruptions harder to absorb. Rather than assume that every dramatic candle signals a new trend, check whether the conditions behind it persist.
Look for confirmation outside the chart where it's relevant: inventory changes, freight or delivery conditions, energy costs, and production availability. For practical ways to think about exposure during unsettled markets, these market volatility survival tips for 2026 can complement your own risk plan.
Don't confuse “the price moved fast” with “the reason for the move will last.” Trade the zone only when your risk is defined and your explanation fits the evidence.
Trade the Principle With Confidence From Anywhere
Static supply and demand zones help you organize a chart, but the stronger habit is to treat them as part of a live diagnosis. Mark the area where price left with force. Then, when price returns, check whether it's fresh, how price behaves on arrival, and whether clues from quantity or availability support your reading.
Persistence depends on conditions beyond the chart. Research discussed by Brookings describes how low inventory buffers, limited production capacity, and a lack of substitutes can amplify disruptions. It also reports evidence from an IMF study covering 28 countries that negative oil-supply shocks can produce supply-driven inflation that remains significant for two years, while demand-driven inflation responses are muted (Brookings discussion of supply shocks and inflation). Those findings concern economic effects, not a promise about how any individual trade will perform.
For your routine, keep the process calm and repeatable:
- Mark clear zones: Prioritize sharp departures over ordinary chop.
- Diagnose the move: Consider whether price and quantity clues fit demand pressure or a supply squeeze.
- Wait for your trigger: Use your planned entry conditions instead of chasing.
- Manage the risk: Set the invalidation point and exit plan before you commit.
- Review the result: Note whether your read matched what the market did, without rewriting the plan after the fact.
You don't need to trade every imbalance. You need a reason to act, a clear point where you're wrong, and enough patience to let the evidence develop. Traders who want structured practice can explore Colibri Trader's price-action learning options, including its Supply & Demand course and lessons on risk management.
Colibri Trader offers practical, price-action-based education, including a specialized Supply & Demand course, mentorship, and lessons focused on discipline and risk management. If you want to practise reading zones and diagnosing market imbalances without relying on indicators, visit Colibri Trader to explore its learning options.