


When Is the Best Time to Sell Stock: A Practical Framework

There's no reliable best calendar date to sell stock. The best time is when a pre-set trigger fires, such as a target reached, a broken investment thesis, a stop hit, or a rebalancing threshold crossed.
The popular advice to buy low and sell high leaves the difficult decisions unanswered. It doesn't tell you how much to sell, what tax bill you'll create, or what you'll do if the stock keeps climbing after your exit.
A workable selling process accepts that you won't capture every last gain. You're trying to fund a goal, protect capital, or keep risk within a limit, not win a contest for the highest exit price.
Sell on a Trigger, Not on a Calendar Date
Sell because something measurable has changed, not because a date feels auspicious. A useful trigger connects the sale to the reason you own the investment and tells you whether to trim or leave entirely.
Consider the uncertainty you're working against. In rolling S&P 500 price-return calculations spanning more than 150 years, DQYDJ's historical return calculator shows one-year returns ranging from approximately -65.61% to +124.15%, versus ten-year annualized returns ranging from -9.14% to +16.62%.
Those are index price returns, not predictions for an individual stock. They show why a short holding period leaves you exposed to a wide range of outcomes, while a longer horizon still doesn't guarantee a gain.
Valid Reasons to Sell and the Test for Each
The numerical thresholds below are illustrative choices, not universal limits. Set yours before buying, using your objectives, cash requirements, and tolerance for concentration.
| Trigger | Clear test | Typical action | Horizon |
|---|---|---|---|
| Goal reached | Price hits a pre-set target or gain | Scale out part of the position | Medium to long term |
| Thesis broken | Earnings, guidance, or competitive edge no longer matches why you bought | Exit the full position | Any horizon |
| Stop-loss hit | Daily close below the pre-set stop level | Exit as planned, no averaging down | Short to medium term |
| Position too large | Stock exceeds its written maximum weight, for example 10% of the portfolio | Trim back to the target weight | Long term |
| Cash needed | A known expense within an illustrative 12 to 24 months | Sell only the amount the expense requires | Short horizon for that cash |
| Rebalancing threshold | Allocation crosses a chosen band, for example 5 percentage points from target | Sell overweight holdings and buy underweight holdings | Long term |
A target needs a reason. Reaching your purchase price after a loss isn't automatically meaningful, and a gain doesn't make a stock unsuitable just because it looks large on your brokerage screen.
A broken thesis requires equally clear evidence. Distinguish a temporary earnings disappointment from a permanent change in the company's economics, financing, or competitive position.
Use Seasonality Only as Context
Calendar patterns can help distinguish between otherwise reasonable exits, but they shouldn't create the sell decision. A historical S&P 500 review discussed in BBC Worklife's examination of seasonal stock returns put September's probability of loss at 56%.
That doesn't make every September a selling opportunity. Company developments and broader market changes can overwhelm seasonal tendencies.
Match every open position to a written trigger. If you can't name one, you haven't finished the investment plan.
Practical rule: A sale needs a named trigger and a checkable test, not a feeling that prices have gone far enough.
Read Price-Action Sell Signals on the Chart
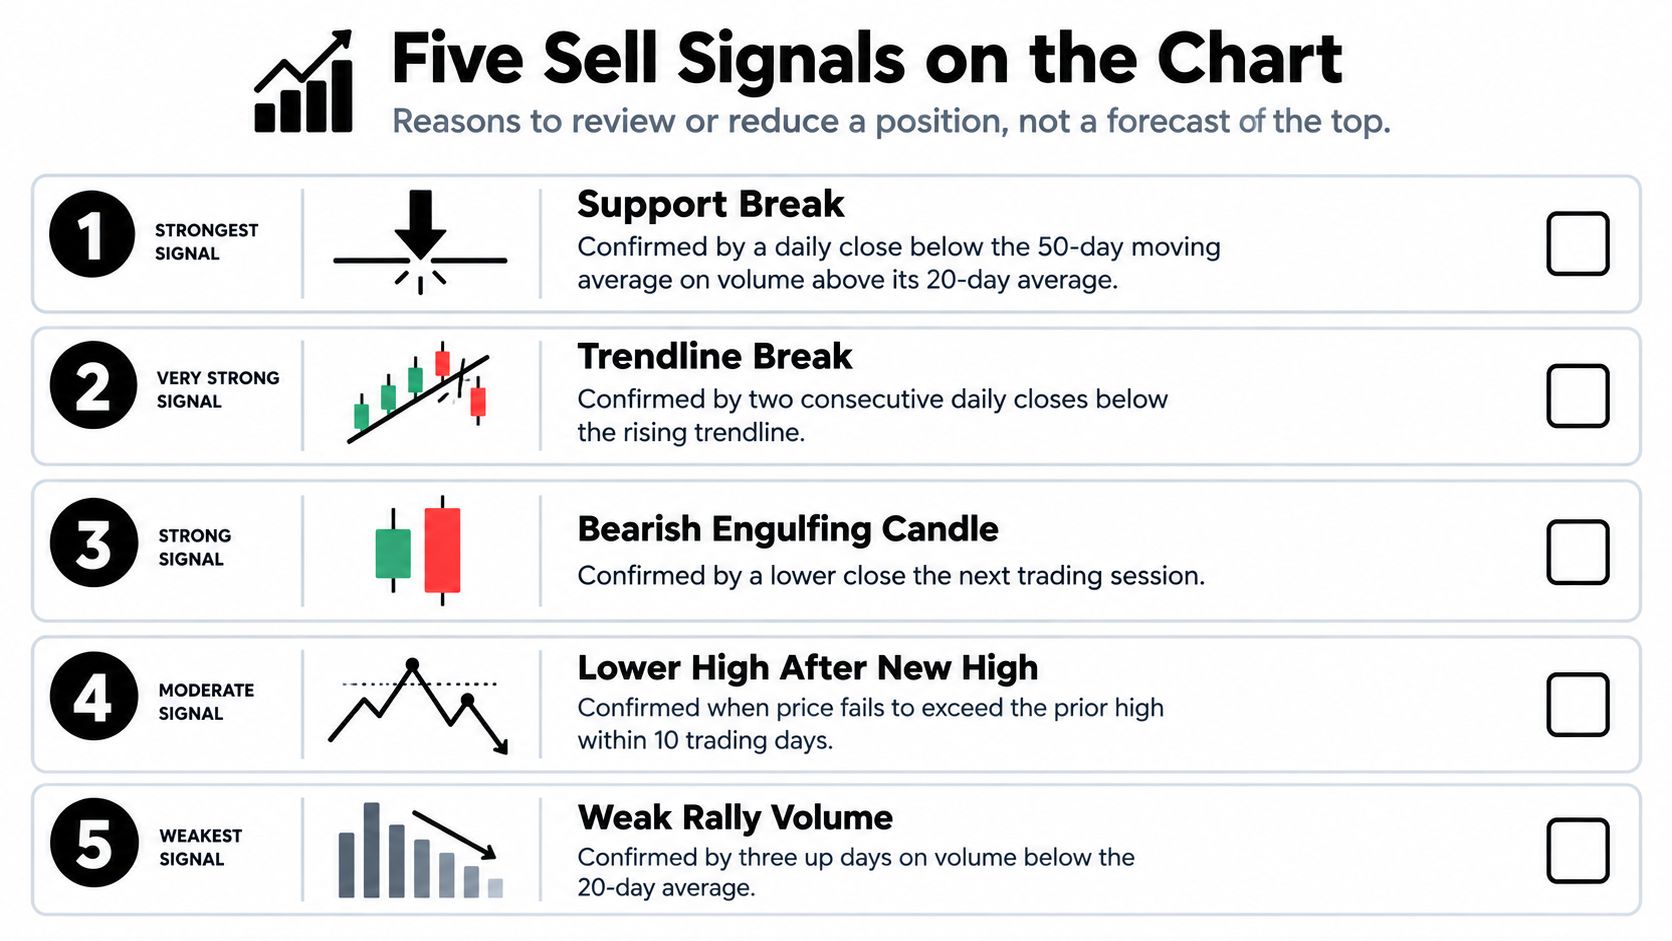
A chart signal is a reason to review or reduce a position, not a forecast of the top. For a position managed on daily charts, assess completed daily bars rather than reacting to every intraday movement.
This visual checklist highlights common warning patterns.
Prioritize Structural Damage Over Candle Shapes
I would rank a confirmed loss of support above an isolated rejection candle. The following are working confirmation rules, not statistically established rankings or promises of predictive accuracy.
Support breaks. On the daily chart, mark the last higher low or a level buyers have repeatedly defended. In a hypothetical example, a stock trading between $50 and $60 closes at $48.60 after failed recovery attempts.
Confirmation rule: Require a subsequent completed session that fails to reclaim support.A lower high follows an uptrend. Read the daily swing structure, not a small dip inside an otherwise intact advance. A rally that stalls below the previous peak shows that buyers haven't restored the old pattern.
Confirmation rule: Wait for price to turn down from the lower peak.Price rejects a supply zone. A bearish engulfing candle or pin bar matters more at established resistance than in the middle of a range. Use the daily chart for a swing position and the weekly chart for a broader holding.
Confirmation rule: Require a later close below the rejection area rather than selling on the wick alone.Heavy buying produces no further progress. Compare daily price bars with volume. An unusually active up session followed by stalled prices deserves attention, but heavy volume alone isn't a sell order.
Confirmation rule: In an illustrative rule, review for reduction if the next three completed sessions show no upward follow-through.A breakout fails. A move above resistance that closes back inside the old range can leave breakout buyers holding a losing position. Read the same timeframe you used to identify the breakout.
Confirmation rule: Require a close back inside the range and an unsuccessful attempt to recover the breakout level.
Don't Confuse an Alert With an Order
An intraday wick isn't a closed-bar signal. Equally, waiting for confirmation means accepting that your eventual exit may be lower.
Agreement between a structural break and a failed recovery is more useful than counting several candles that describe the same move. Even then, the chart tells you that the position is weakening, not how far it must fall.
Size Positions and Place Stop-Losses
Shares = risk amount ÷ distance between entry and stop.
The risk amount is account equity multiplied by your chosen risk fraction. This calculation estimates the loss at the planned stop execution price; it doesn't establish a guaranteed maximum loss.
Start with the point where the trade becomes invalid. Then calculate how many shares fit your budget, rather than buying a comfortable-looking quantity and inventing a stop afterward.
Position Size by Account, Risk and Stop Distance
These are hypothetical sizing examples, not recommended risk levels. Each assumes an $80 entry, a $76 stop, and therefore a $4 planned loss per share, excluding costs and slippage.
| Account | Risk per trade | Shares |
|---|---|---|
| $20,000 | 1% ($200) | 50 |
| $50,000 | 1% ($500) | 125 |
| $100,000 | 0.5% ($500) | 125 |
| $100,000 | 2% ($2,000) | 500 |
The last row is arithmetic, not an endorsement of the exposure. Check the purchase value against your available capital and concentration limit, because a trade can fit a stop-based risk budget while still making the portfolio too dependent on one company.
For the calculation mechanics, use this explanation of position sizing in trading. Finzer also offers a practical exit guide for individual investors for thinking through stop-based exits before placing an order.
Choose the Stop Before the Share Count
Place the stop beyond meaningful structure, such as the last higher low, rather than directly on an obvious level. Compare that distance with recent daily ranges or an average true range reading; a stop inside routine fluctuations may be too tight for the holding period.
- Hard stop orders place execution instructions with the broker. A stop-market order prioritizes getting out after activation, not receiving the stop price.
- Mental stops require you to watch the market and act. They're vulnerable to hesitation, distraction, and the temptation to reinterpret a losing trade.
- Trailing stops move upward as favorable price structure develops. They can retain exposure during an advance, but they also give back some unrealized profit before triggering.
- Stop-limit orders restrict the acceptable execution price after activation. That protection comes with a different risk: the order may remain unfilled during a fast decline.
A close-based rule and an intraday broker stop aren't interchangeable. Decide whether a temporary breach should trigger an immediate order or whether you intend to assess the completed bar.
Also test a plausible adverse gap, particularly around company announcements. If the resulting loss would be unacceptable, reduce the position or avoid carrying it through the event.
Never widen a stop simply to preserve the share count. Choose a valid stop, then cut the shares to fit it.
Scale Out of Winners and Rebalance on Schedule
Scaling out exchanges some future upside for earlier realized gains. It turns a single all-or-nothing exit into smaller decisions, but it doesn't automatically improve returns.
A written ladder makes those decisions visible before the position becomes emotionally important.

A Hypothetical Profit-Taking Ladder
For illustration, consider this plan:
- First reduction: Sell roughly a third at a 15% gain and raise the stop toward the entry price.
- Second reduction: Sell another third at a 30% gain, then trail the remainder beneath confirmed higher lows.
- Final exit: Sell when the trailing rule activates or the investment thesis breaks.
Set those targets against the initial downside. With a hypothetical $80 entry and $5 stop distance, the first target at $92 offers $12 per share, or 2.4 times the initial planned risk.
The cost is straightforward: if the stock keeps rising, you'll earn less than someone who held the entire position. Moving the stop upward can also end a trade during an ordinary pullback, so use trailing stop-loss placement that matches your timeframe rather than your desire to protect every gain.
This accompanying video provides another format for considering trade-management decisions.
Rebalancing Solves a Different Problem
Rebalancing restores portfolio risk rather than managing a chart-based trade. The SEC's investor guide to asset allocation and rebalancing describes calendar-based reviews, such as every 6 or 12 months, and predetermined allocation thresholds as practical approaches.
For a hypothetical portfolio worth $200,000, a stock that has grown from an original 5% allocation to 14% now represents $28,000. Trimming it to a chosen 10% target requires selling approximately $8,000, assuming unchanged prices and ignoring costs.
Redirect the proceeds to underweight holdings. Record that the sale reduced concentration, because selling a strong performer for portfolio balance isn't the same as forecasting a decline.
Tax, Liquidity and Trading Costs Before You Sell
The economically better exit improves your after-tax, after-cost outcome, not necessarily your headline sale price. A favorable tax date can justify patience, but not unlimited exposure to a deteriorating investment.
Check the Net Proceeds
Check the holding period. In the United States, selling after holding an investment for more than one year may qualify the gain for long-term treatment, as explained in TurboTax's guide to investment gains and losses. Before choosing an exit date, use Allied Tax Advisors' explanation to compare short-term and long-term capital gains, then verify the rules applicable to your account and country.
Review gains and losses together. A loss sale may offset realized gains, subject to local rules. Reviewing opportunities during the year gives you more flexibility than treating tax planning as a year-end emergency.
Choose the tax lot deliberately. Where specific-lot identification is available, selling higher-cost shares can reduce the gain realized on that transaction. Confirm the broker's lot-selection procedure before execution rather than assuming its default matches your intentions.
Check replacement purchases. A loss sale followed or preceded by a purchase of the same or a substantially identical security can trigger U.S. wash-sale restrictions. Include automatic purchases and relevant linked accounts in the review, and confirm the applicable timing with a tax professional.
Estimate execution costs. Compare commissions, the bid-ask spread, and likely slippage. A commission-free order can still execute at an unfavorable price.
Match the order to liquidity. Compare the intended sale with typical trading volume and visible market depth. A large order relative to available buyers may require staged execution, although staging leaves you exposed while you wait.
Identify the account type. Sales inside many retirement accounts don't create an immediate capital-gains tax, but withdrawals can have separate consequences. Don't apply taxable-account logic automatically.
Don't Let Tax Savings Become the Investment Thesis
Ask your broker for the estimated realized gain by lot, then compare the alternatives with a qualified tax adviser. Include immediate sale, partial sale, and delayed sale where each remains consistent with your risk limit.
Sometimes a smaller sale timed differently is the better exit. Sometimes paying the tax now is the reasonable price of removing an unacceptable exposure.
Behavioural Traps That Turn Selling into Market Timing
Selling before a crash sounds decisive. Selling after a drop and waiting for an obvious all-clear can be far more expensive than expected.
In Vanguard's hypothetical S&P 500 illustration, $100,000 invested from 1988 through 2024 grew to about $4.9 million when fully invested, versus approximately $2.3 million when the ten best days were missed.

Recognize the Decision You're Actually Making
That illustration isn't proof that you should never sell. It shows that abandoning exposure introduces a second decision: when to buy back.
- Selling winners and defending losers: You take a gain because it feels satisfying but keep a damaged holding to avoid admitting a mistake. Evaluate the remaining opportunity, not whether the position currently shows green or red.
- Reacting to alarming headlines: You replace the written plan with the urgency of the latest story. Ask whether the news changes the company's economics or your portfolio constraints.
- Waiting for certainty: You sell now and promise to return when conditions feel safe. By then, buyers may already have pushed prices substantially higher.
There's also a less dramatic alternative to repeated timing decisions. A 2024 account of Charles Schwab's Center for Financial Research analysis found that consistent investing without market timing captured 92% of the return achieved by perfect timing in its twenty-year comparison.
Specify What Would Bring You Back
For a tactical exit, define the evidence that would justify renewed exposure, such as a recovered support level followed by a successful retest. For a portfolio reduction, specify the allocation or review condition that would permit rebuilding.
Work on trading psychology and decision discipline alongside execution rules. A technically precise order won't fix an undefined decision process.
Write the re-entry condition before selling. A fixed review date can prompt reassessment, but it shouldn't become an automatic instruction to buy.
Write Your Sell Rules Before Your Next Trade
When is the best time to sell stock? The useful answer becomes visible in an order sheet, not a prediction.
One Annotated Trade
This is a hypothetical illustration, excluding taxes, fees, slippage, and dividends. It demonstrates execution arithmetic, not an expected return.
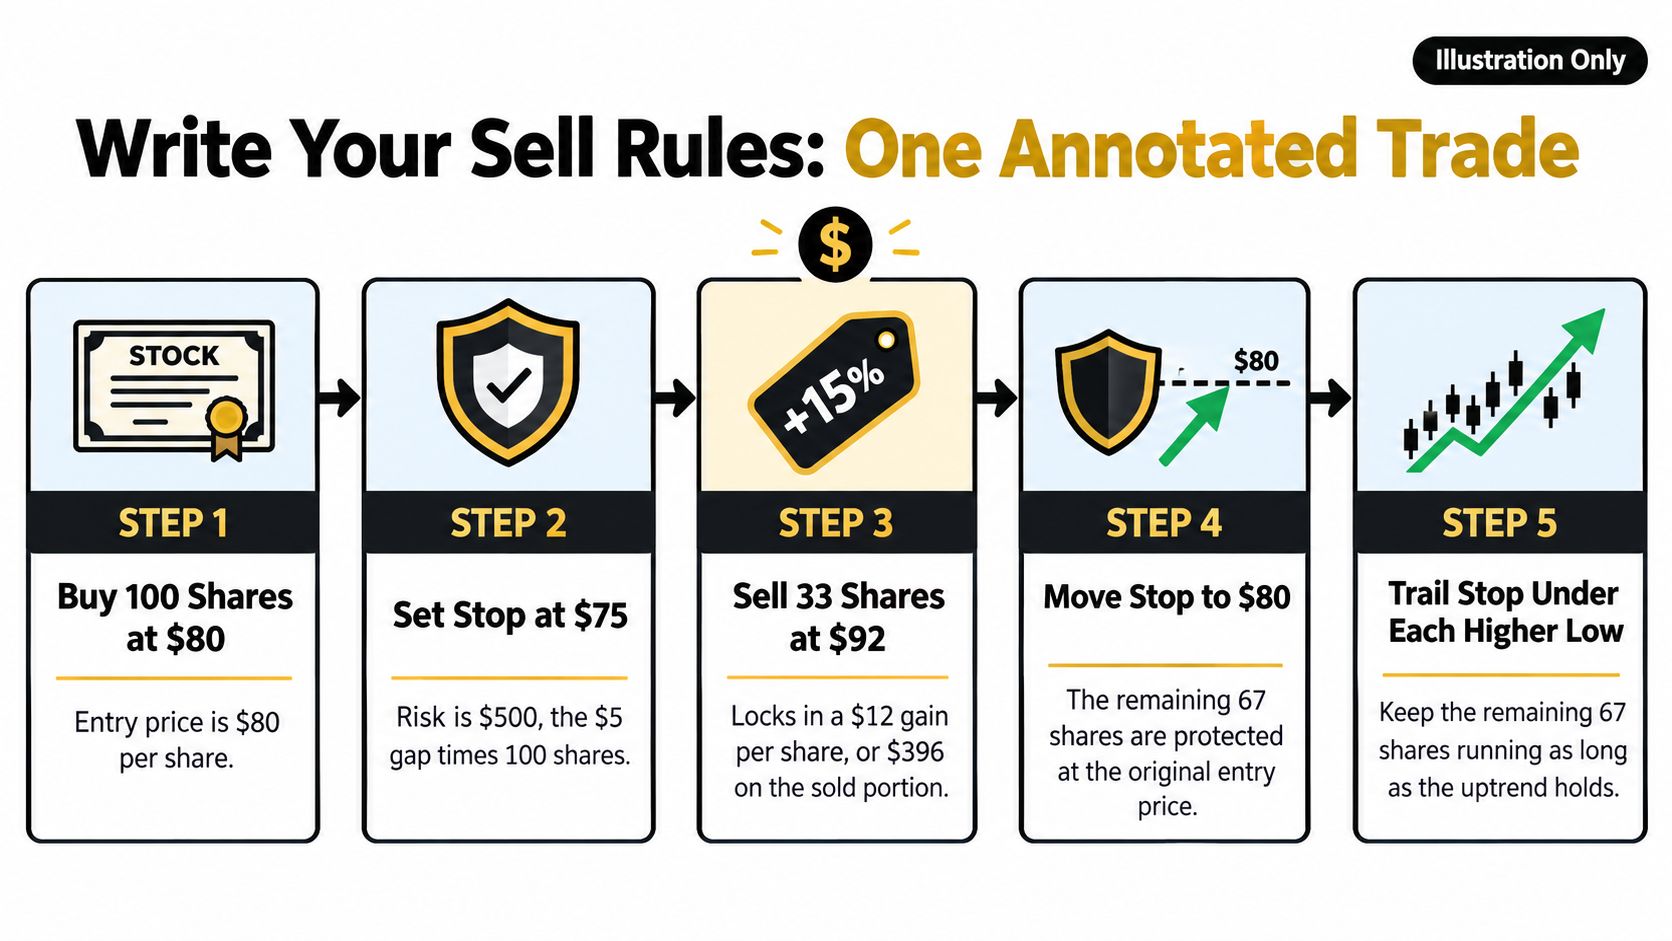
Buy 100 shares at $80, with a stop at $75 beneath the last higher low. The planned price risk is $500, calculated as the $5 gap multiplied by 100 shares.
Sell 33 shares at $92, then move the stop to $80. That targets break-even execution on the remaining 67 shares, but doesn't guarantee a loss-free exit if prices gap.
Sell another 33 shares at $104. Trail the final 34 shares beneath subsequent higher lows, exiting at an assumed $98 when the rule triggers, not because you've identified the top.
| Sale | Price |
|---|---|
| Sale 1 at +15% | $92, realizing $396 on 33 shares |
| Sale 2 at +30% | $104, realizing $792 on 33 shares |
| Trail exit | $98, realizing $612 on 34 shares |
| Total | $9,800 proceeds, $1,800 gain on $8,000 cost, or 22.5% |
Your Pre-Trade Checklist
- Write the thesis and its invalidation condition.
- Set the stop and calculate position size.
- Set scale-out targets if partial exits suit the strategy.
- Choose a review date appropriate to the holding period.
- Record the closing trigger and any re-entry requirement.
- Log the outcome, including execution costs and rule adherence.
Apply these rules to every open position this week, starting with the holding whose potential loss would cause the most financial strain.
Colibri Trader offers price-action education, position-sizing guidance, and lessons on trading discipline. Visit Colibri Trader to explore those resources and use them to build a written exit plan before your next trade.