

What Is Range Trading: Rules, Examples and Pitfalls
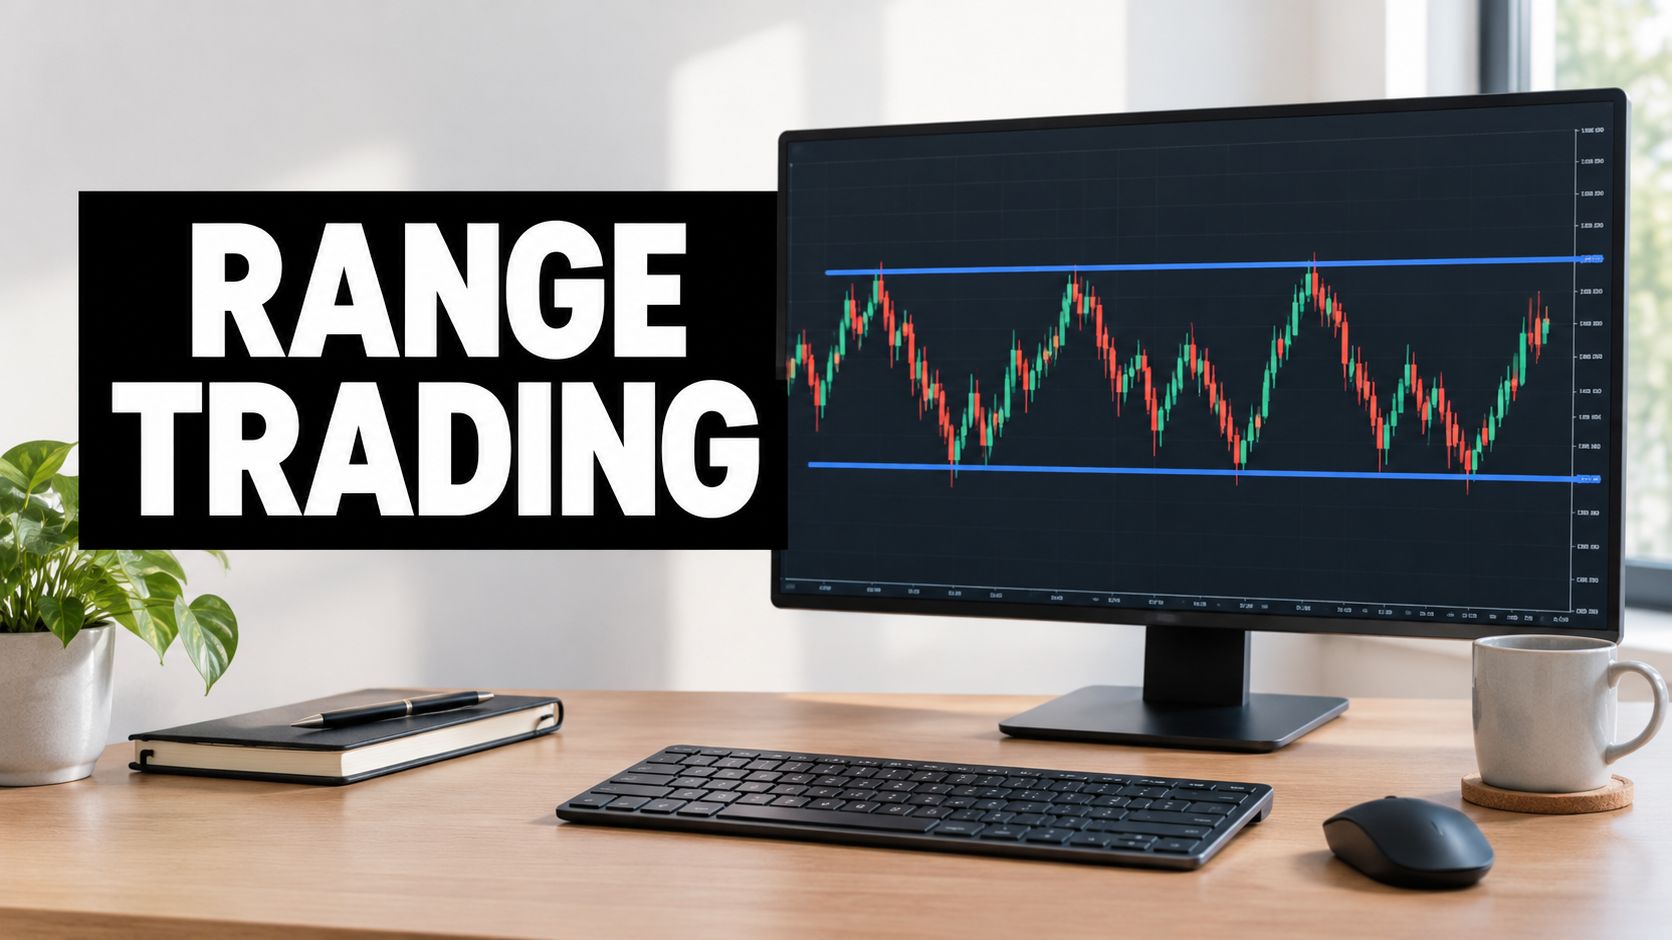
Range trading means buying near support and selling near resistance while price stays inside a horizontal band, and exiting when that band breaks. It's a mean-reversion approach, built on the expectation that price may reverse near familiar boundaries rather than continue in one direction.
You've probably watched a chart revisit the same low, recover, then stall near the same high. The pattern looks straightforward until you buy another apparent bounce and price keeps falling. That's where range trading becomes a risk-management problem: you need a plan for recognizing when the familiar pattern no longer applies.
What Range Trading Means in Plain Terms
A trading range is a horizontal corridor between a lower boundary, called support, and an upper boundary, called resistance. Traders look for reversals near those boundaries rather than betting on a sustained upward or downward move, a framework described in historical technical-analysis literature.
Range, trend and breakout compared
| Setup | Price behavior | Trade logic | Main risk |
|---|---|---|---|
| Range | Oscillates between support and resistance | Buy near the floor, sell near the ceiling | A breakout ends the range |
| Trend | Higher highs and higher lows, or the reverse | Trade with the slope and consider pullbacks | A trend reversal |
| Breakout | Closes beyond a boundary and keeps moving | Consider entry in the break direction after a retest | A false breakout returns inside |
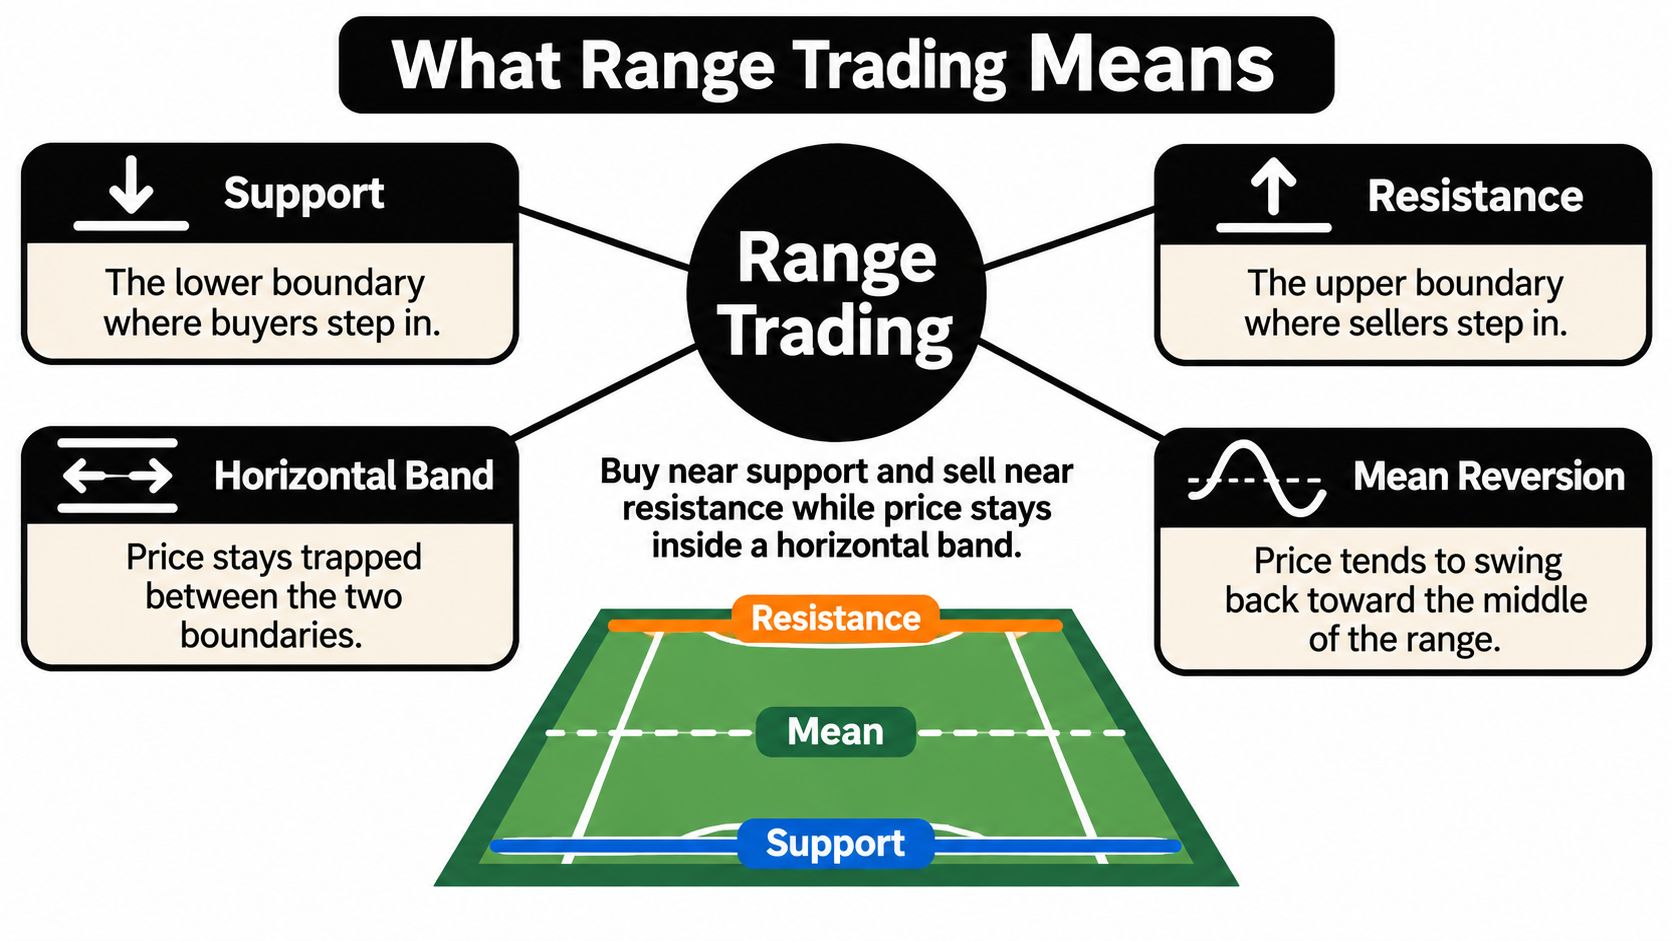
Think of a tennis ball bouncing between court lines. Support is the lower line where buyers have repeatedly interrupted declines; resistance is the upper line where sellers have interrupted advances. The middle represents the area toward which price may revert.
The analogy has a limit: market boundaries aren't physical barriers. Buyers can stop defending support, sellers can stop containing resistance, and price can overshoot either zone without immediately establishing a trend.
This diagram connects the terms to the horizontal band.
Why time matters
A brief pause isn't automatically a mature range. The historical literature linked above describes extended containment, with some definitions requiring several months and examples lasting years.
That doesn't mean you can't study shorter bands. It means you shouldn't treat a fleeting sideways patch as equally convincing evidence of stable buying and selling behavior.
Practical test: Name the floor, the ceiling and the condition that would prove your interpretation wrong before considering an entry.
If you can identify the boundaries but can't explain invalidation, you've drawn a box, not completed a trading plan.
How to Spot a Range on Your Chart
Start with the turning points. Connect repeated swing highs to sketch resistance, then repeated swing lows to sketch support. Treat these as zones, especially when neighboring candles reverse at slightly different prices.
You're looking for repeated reactions, not a line that happens to fit a convenient candle. A guide to identifying support and resistance levels can help you distinguish meaningful boundaries from marks added after the outcome is obvious.
Use this checklist as an observation framework. The moving-average, volume and candle-pattern rows are supporting checks, not universal requirements or independently proven entry signals.
Range identification checklist
| Signal | What to look for | Practical threshold |
|---|---|---|
| Horizontal boundaries | Repeated swing highs around an upper zone and lows around a lower zone | Multiple independent reactions at each side |
| Duration | Price remains contained without a clear slope | Sustained containment rather than a brief pause |
| Moving average | A relatively flat average with price crossing it repeatedly | No persistent directional slope |
| Volume cues | Participation changes as price approaches the edges | Watch for unusual expansion accompanying a boundary break |
| Volatility | Range width and candle size stop expanding | Contraction supports observation; sudden expansion warrants caution |
| Price action signs | Rejection wicks, pin bars or engulfing candles near the edges | A recognizable rejection rather than a touch alone |
| Trend check | Progressively rising or falling swing points | A clear directional sequence argues against a horizontal range |
Interpret volatility in context
Smaller candles and contracting movement may indicate temporary equilibrium. Larger candles, expanding volume or consecutive closes beyond a boundary should make you question whether the same range assumptions still apply. These distinctions underpin the practical workflow described alongside range-based volatility research.
Don't interpret quiet trading as a promise of another bounce. Contraction tells you that movement has narrowed, not which direction the next meaningful move will take.
Timeframe changes what you see, too. Mark the broader structure on a higher-timeframe chart before examining a lower-timeframe entry, so you don't mistake a small counter-move for an independent range.
The checklist is a filter, not a score. Several reassuring observations don't cancel a clear sequence of directional swings. For practice, mark candidate ranges on a familiar chart and write down which observations support or contradict each interpretation.
How to Enter, Exit and Place Stops
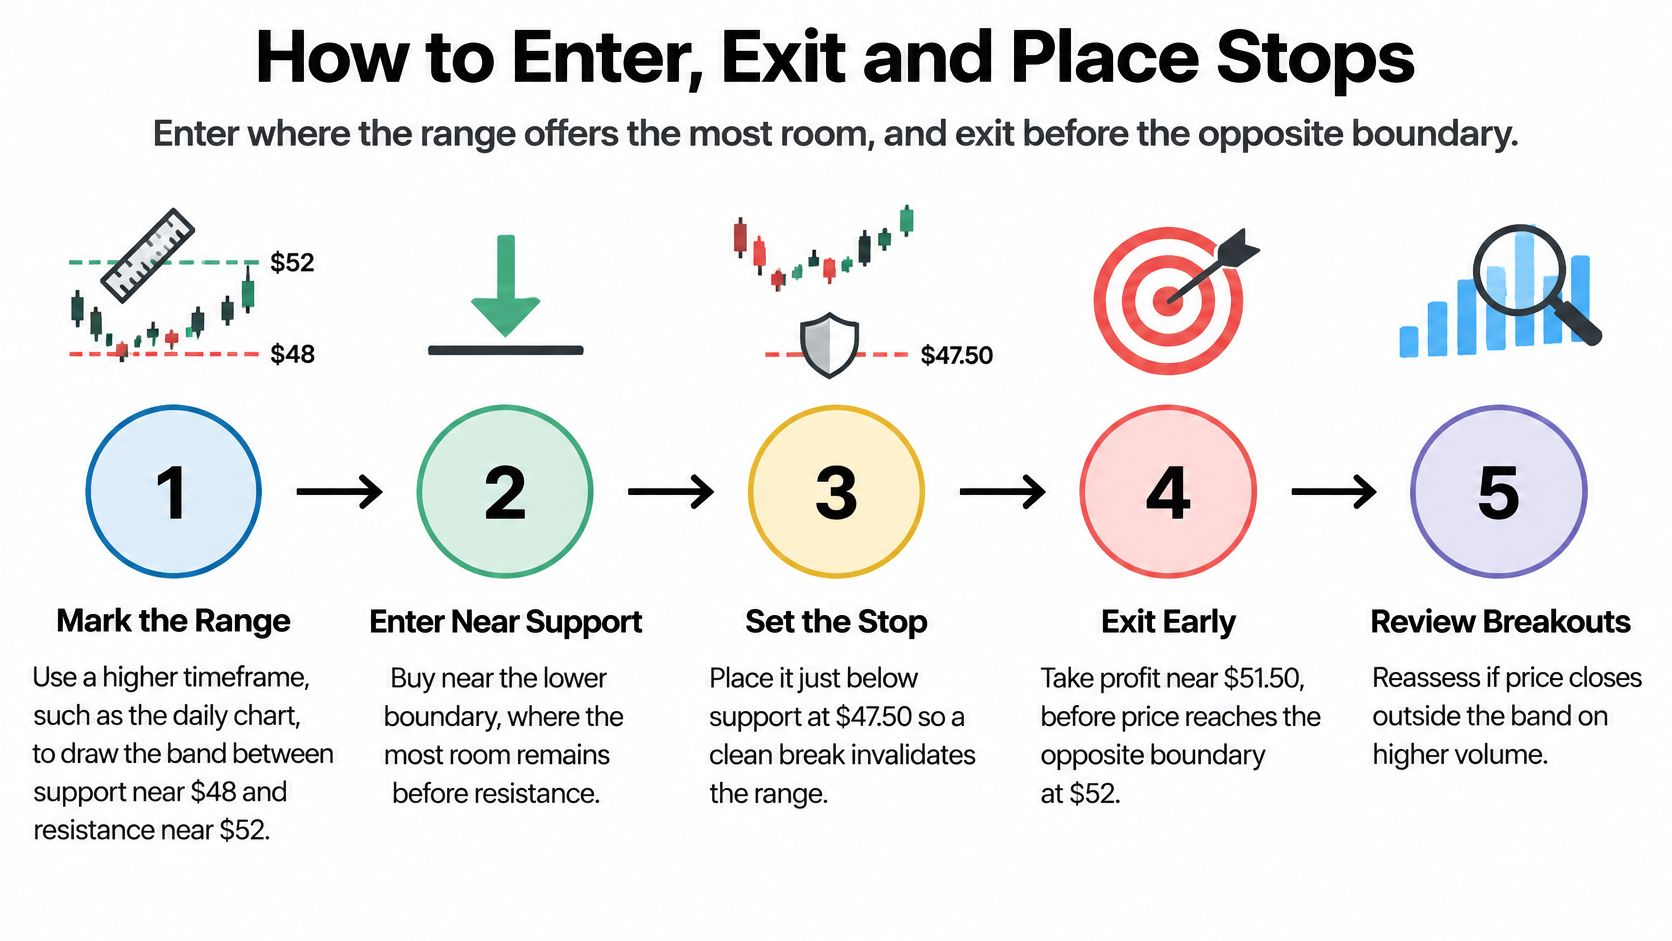
Price reaches support, briefly dips below it, then closes back inside the range. The entry may look clear, but the key question is whether this is a routine rejection or the start of a break. Plan the trade around both possibilities: where you might enter, where the setup is invalidated, and when to leave if the range no longer holds.
The illustration shows how an entry, stop and target can fit within the broader structure.
Build the trade before placing it
Mark the broader range. Use repeated swing lows and highs on a higher-timeframe chart, then keep those boundaries in view while checking a potential entry.
Wait for price to approach an edge. If it has already bounced toward the midpoint, chasing it may leave too little room before the target.
Look for rejection. Near support, a pronounced lower wick or bullish engulfing candle can show buyers responding. Near resistance, look for corresponding bearish behavior. A touch alone is not confirmation.
Consider entering after the signal candle closes. That avoids treating an unfinished candle as a confirmed rejection, though a completed pattern can still fail.
Place the stop beyond structural invalidation. Find the swing or zone whose failure would contradict the trade. A stop placed directly on the drawn boundary may be triggered by a brief move beyond it.
Set the target before the opposing zone. Earlier buying or selling may interrupt price there, so plan to exit near that area rather than require an exact line to hold.
Define an early-exit condition. If price closes decisively outside the range against your position, reassess instead of assuming another routine reversal. A stop and an early-exit rule address different risks: one sets the maximum planned loss, while the other prompts you to respond to evidence that the range has changed.
Walk through a long entry
Consider an illustrative, unpriced setup. Price approaches established support, dips into the zone, then closes back above it with a clear rejection wick. You plan a long entry, a stop beneath the rejected swing low and a target before resistance.
Before placing the order, compare the potential gain with the potential loss and execution costs. A faraway target can make the trade appear attractive, but distance alone does not show how likely price is to reach it. If price instead closes decisively below the range, the original setup may no longer apply. That transition is the risk to manage, not a reason to widen the stop and hope for a bounce.
For a chart-based demonstration, compare the video with your own marked boundaries.
The trade is conditional on support holding. Your stop marks where you'll stop paying to maintain that bet.
Sizing Risk Before Every Range Trade
Suppose a range trade needs a stop well beyond the entry. The risk comes from that distance, not from how confident the setup feels. Set an account-risk limit first, then calculate a position size that fits it. Don't choose a large position and pull the stop closer just to make the numbers work.
There is no single risk fraction that suits every trader. The planned loss should fit your account, instrument and ability to withstand a run of losing trades. Use a position-sizing guide to review the calculation, then apply it to your own trade.
Position size for the worked range trade
| Input | Example value | Calculation |
|---|---|---|
| Account size | Your available trading equity | Use current equity |
| Risk per trade | Your predefined risk budget | Account equity × chosen risk fraction |
| Entry price | Planned long entry near support | Use the intended executable price |
| Stop price | Beyond the rejected swing low | Based on structural invalidation |
| Stop distance | Entry minus stop | Planned price risk per share |
| Position size | Shares permitted by the risk budget | Risk budget ÷ estimated loss per share, including costs |
| Target price | Before resistance | Based on the opposing zone |
| Gross reward per share | Target minus entry | Potential gain before costs |
| Estimated costs per share | Instrument-specific estimate | Spread, commission and slippage |
| Net reward per share | Gross reward minus costs | Deduct estimated round-trip friction |
| Net reward to risk | Cost-adjusted potential gain relative to loss | Net reward ÷ estimated loss per share |
Check whether the range is economically tradable
A chart may show room for price to bounce, yet leave little profit after execution costs. Visible order-book depth alone does not show the full cost of executing a trade, as CME's analysis of liquidity and execution explains. Estimate costs using your instrument's spread, broker charges and realistic slippage instead.
Also separate reward-to-risk from expectancy. A favorable payoff ratio does not prove a strategy has an edge. Across tested setups, wins must occur often enough, and be large enough, to cover losses and costs.
Account protection: Don't widen a stop to avoid accepting a loss, and don't add size because a losing range trade now looks cheaper.
If the structural stop makes the position impractical, reduce the size or skip the trade. The stop marks where the setup is invalidated. Moving it to fit a preferred position size changes the risk rather than controlling it. A range can also stop behaving like a range, so keep the planned loss manageable enough to respond when its boundaries no longer hold.
A Range Trade From Start to Finish
Consider a hypothetical stock, not a reported trade or a historical case study. It has repeatedly recovered near a lower zone and stalled near an upper zone, giving a paper trader a candidate range to study.
The trader first records the boundaries without entering. They want evidence that the stock is still responding to those areas, rather than assuming every return to an old low deserves a purchase.
This chart-analysis image illustrates the act of marking structure before making a trading decision.

The first opportunity
On a later approach to support, price dips into the lower zone and closes back above it. The trader records a simulated long entry, protective stop and target using the procedure already established.
In this illustration, price subsequently reaches the target before resistance. The journal records a winning outcome, but also records whether the entry followed the rules. A profitable trade taken impulsively wouldn't be evidence of disciplined execution.
The next opportunity occurs near resistance. Buying pressure appears to fade, and the trader records a simulated short only after observing rejection. That trade also reaches its planned exit in this hypothetical sequence.
The boundary stops holding
On another approach to resistance, price behaves differently. Instead of rejecting the upper zone, it pushes through with expanding candles and stronger participation.
The trader's short reaches its protective stop. They accept the planned loss rather than moving the stop, increasing the position or arguing that earlier reversals make another decline inevitable.
| Decision point | Trader's response | Rule being tested |
|---|---|---|
| Rejection at support | Consider a planned long | Trade an observed reaction |
| Rejection at resistance | Consider a planned short | Apply the same discipline in reverse |
| Expansion through resistance | Accept invalidation | Don't defend an expired setup |
| Pullback holds above the former ceiling | Assess a separate opportunity | Don't confuse a continuation trade with the old range |
Later, price pulls back toward former resistance and holds above it. The trader can evaluate a continuation long, but it needs its own entry, stop and risk assessment. It isn't permission to reverse immediately after every stopped short.
The sequence is deliberately illustrative. Its lesson isn't that range trades produce convenient winners before a manageable loss. It's that following an invalidation rule prevents you from needing to predict how far the new move might travel.
Pitfalls and When a Range Stops Working
The hard skill isn't finding familiar boundaries. It's withdrawing your range assumption when buyers and sellers stop behaving as they did before.
A common mistake is to treat every move beyond support or resistance as either an obvious breakout or an obvious trap. At the first probe, you may not have enough evidence to distinguish them.
Range trading pitfalls and fixes
| Pitfall | What it looks like | Fix |
|---|---|---|
| Trading a range that is too short | A brief pause is mistaken for established containment | Require repeated reactions and a meaningful observation window |
| Treating a breakout as a bounce | Price closes beyond the boundary and continues | Follow the decisive-close exit rule without delaying a protective stop |
| Stop placed exactly on the boundary | Ordinary probing triggers the stop | Use structural invalidation beyond the swing or zone |
| Overtrading on lower timeframes | Frequent small trades lose their appeal after fees | Be selective and calculate net outcomes |
| Ignoring costs | Gross winners produce little net gain | Compare the opportunity with round-trip friction |
| Fighting a trend | Repeated countertrend entries in a sloping market | Recheck swing structure; use a flat moving average only as supporting context |
| Assuming history repeats | Attractive backtests don't translate into live results | Forward-test with realistic execution assumptions |
Separate evidence from certainty
Brock, Lakonishok and LeBaron tested 26 technical rules using Dow Jones closing prices from 1897 through 1986, including trading-range breakout rules, and reported statistical support in their historical study. That finding doesn't establish that buying support and selling resistance will be profitable today, and breakout rules aren't identical to boundary-fading trades.
Regime changes deserve separate attention. AQR's discussion of managed futures explains that trend-following can struggle in range-bound conditions and when trends reverse abruptly. The practical lesson is to test whether your strategy still matches current behavior.
For a suspected breakout, examine the close beyond the boundary, changes in participation or volatility, and the subsequent retest. Former resistance holding as support provides different evidence from price immediately falling back inside.
You don't need certainty about the next trend to know that your original range trade is invalid.
On an ambiguous break, reducing exposure or standing aside is a legitimate response. Don't wait for perfect confirmation if your protective stop has already been reached, and don't assume liquidity alone makes the setup safe.
Paper-Trade Range Setups Before Risking Money
A rejection candle gives you something more specific to test than a bare touch of a line. You can record what price did at the boundary, where you would have entered and exactly what would have invalidated the trade.
Possible observations include a bullish engulfing candle at support, a pin bar rejecting resistance or an inside bar following a boundary test. Location matters more than a pattern's name: a candle near a meaningful zone is a different setup from the same shape in the middle of a band.
Turn observation into a repeatable record
- Select a familiar liquid market. Mark historical ranges before revealing what happened next, so later price action doesn't influence your boundary placement.
- Record each boundary test, signal, intended entry, stop, target and estimated execution costs. Include skipped trades and explain why you rejected them.
- Paper-trade a predefined practice sample. Use consistent rules rather than changing the setup after every loss.
- Review your recurring mistakes. Separate poor range identification, late entries, ignored invalidation and underestimated costs.
Use a paper-trading workflow to keep the exercise organized. Chart replay and a spreadsheet are enough to begin; what matters is whether your records let you reconstruct each decision accurately.
Paper trading won't establish that you'll execute identically with money at risk. It does let you check whether your rules are clear enough to follow and whether an apparent opportunity survives realistic cost assumptions.
Start your log this week. Choose a chart, mark the boundaries and write your invalidation condition before revealing the next candles.
Colibri Trader offers price-action education and practical lessons focused on discipline and money management, which you can use alongside chart replay and a paper-trading journal. Visit Colibri Trader to explore its free educational material, then apply what you learn to identifying range boundaries and planning exits before risking money.