Support and Resistance Trading Strategy: Expert Guide
Mastering The Psychology Behind Support and Resistance
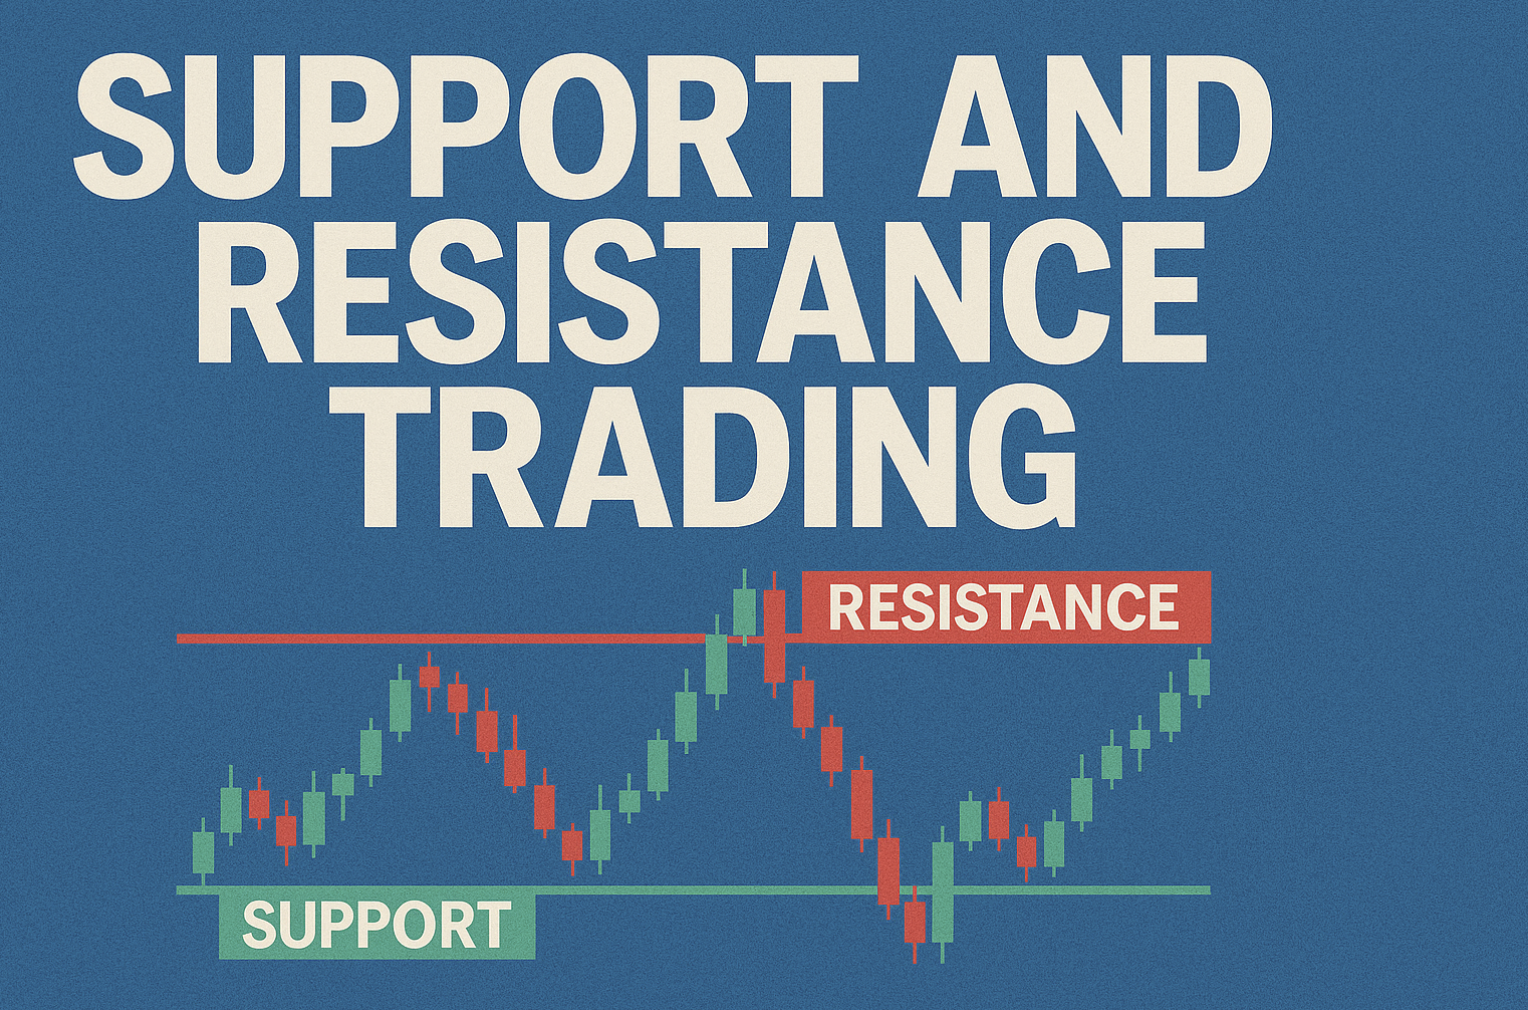
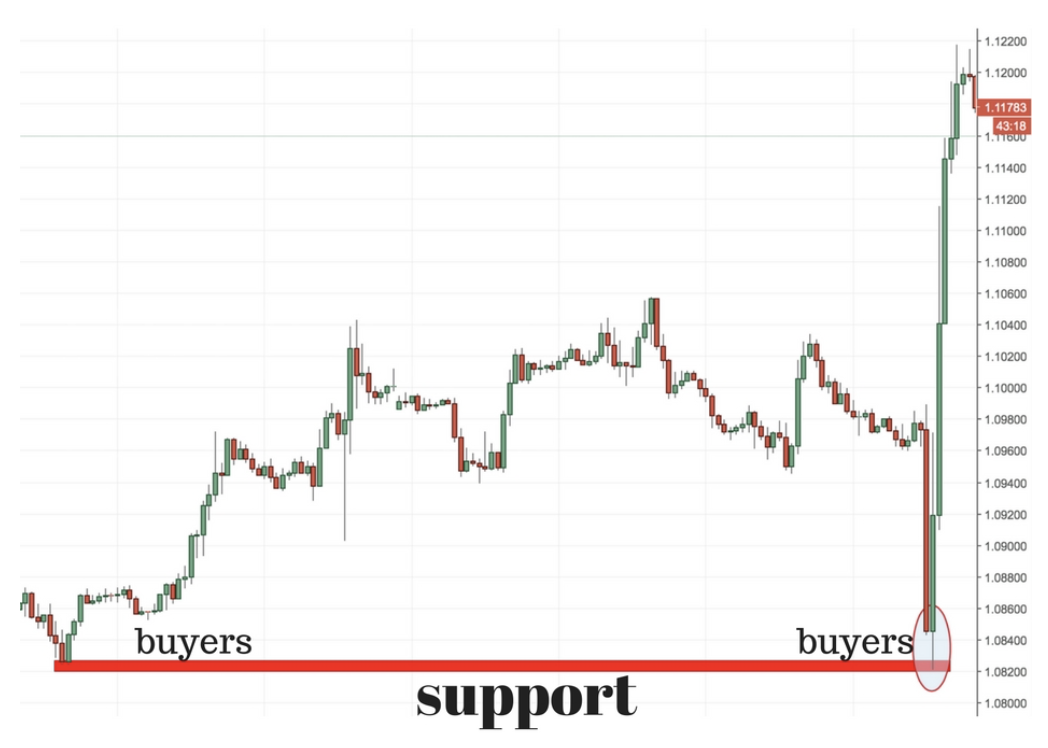
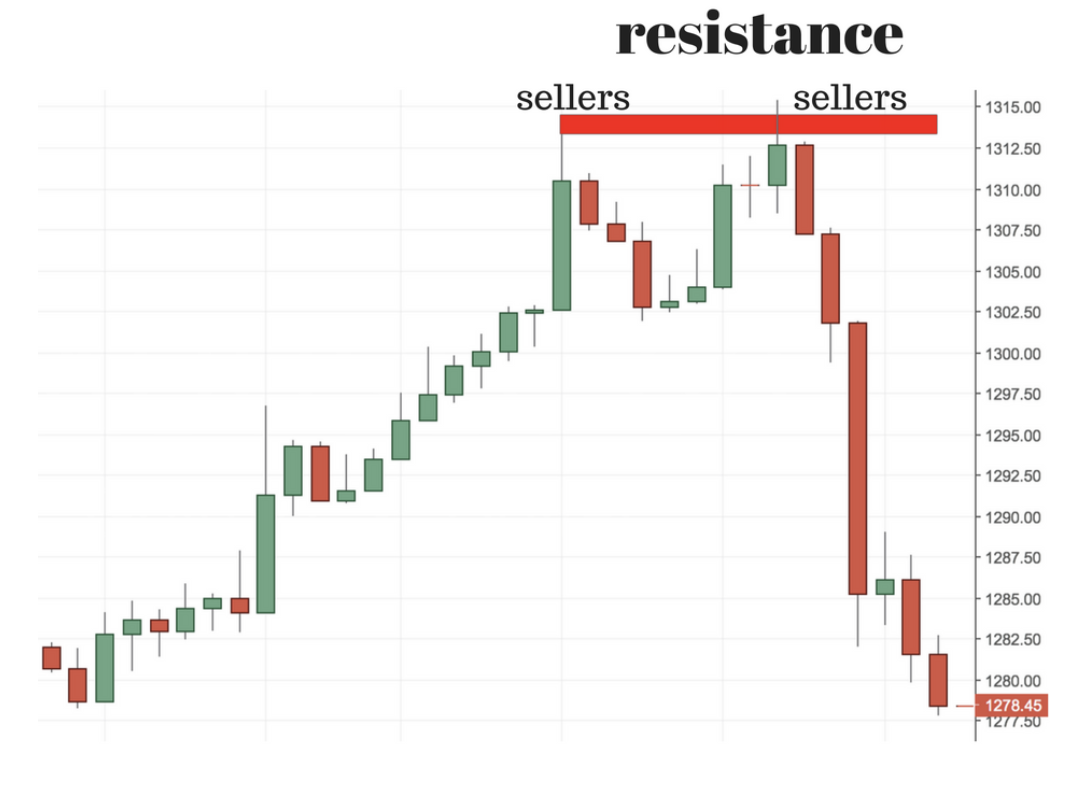
Support and resistance levels are more than just lines on a chart. They represent the collective psychology of the market, highlighting points where traders have historically bought or sold. This shared market memory can influence future trading, creating predictable turning points. For example, a stock consistently failing to break above $100 suggests strong selling pressure at that price, possibly due to profit-taking or short selling.
How Market Psychology Creates These Zones
Institutional money flow reinforces this psychological phenomenon. Large institutions often place substantial orders at specific prices, creating natural barriers. These barriers act as support when buying pressure prevents further price declines, and as resistance when selling pressure prevents further price increases. This interplay between institutional actions and individual traders solidifies these zones as key areas for a support and resistance trading strategy. Traders are often drawn to round numbers like $50 or $100, strengthening these psychological levels.
Support and resistance levels are essential for technical analysis, helping traders identify potential price reversals or pauses. These levels are often identified by observing past price action, particularly where the price has repeatedly bounced or been rejected. The more a price tests a support or resistance area, the more significant it becomes, as traders base their decisions on these observed levels. Want a deeper dive?
Recognizing Role Reversals
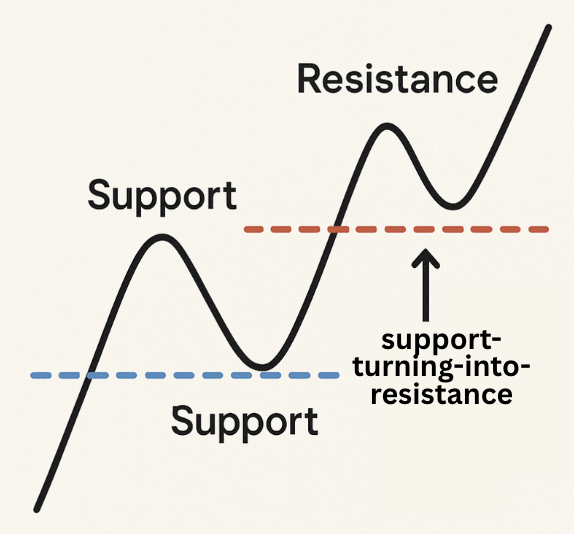
One fascinating aspect of support and resistance is the potential for role reversal. A support level can become resistance once broken, and vice versa. This occurs because traders who bought near support may exit near the same price, creating selling pressure. Understanding this potential for role reversal is critical for anticipating market shifts.
Psychological Triggers At Support and Resistance
Several psychological triggers underpin the effectiveness of support and resistance. FOMO (Fear of missing out) can drive buying near support, while fear of losses encourages selling near resistance. These emotional responses often generate predictable price movements. However, it’s important to remember that support and resistance aren’t impenetrable. Strong news or shifts in market sentiment can cause breakouts, creating new trading opportunities. Therefore, incorporating additional technical indicators and price action analysis can further refine your trading strategy.
Finding High-Probability Zones That Actually Work
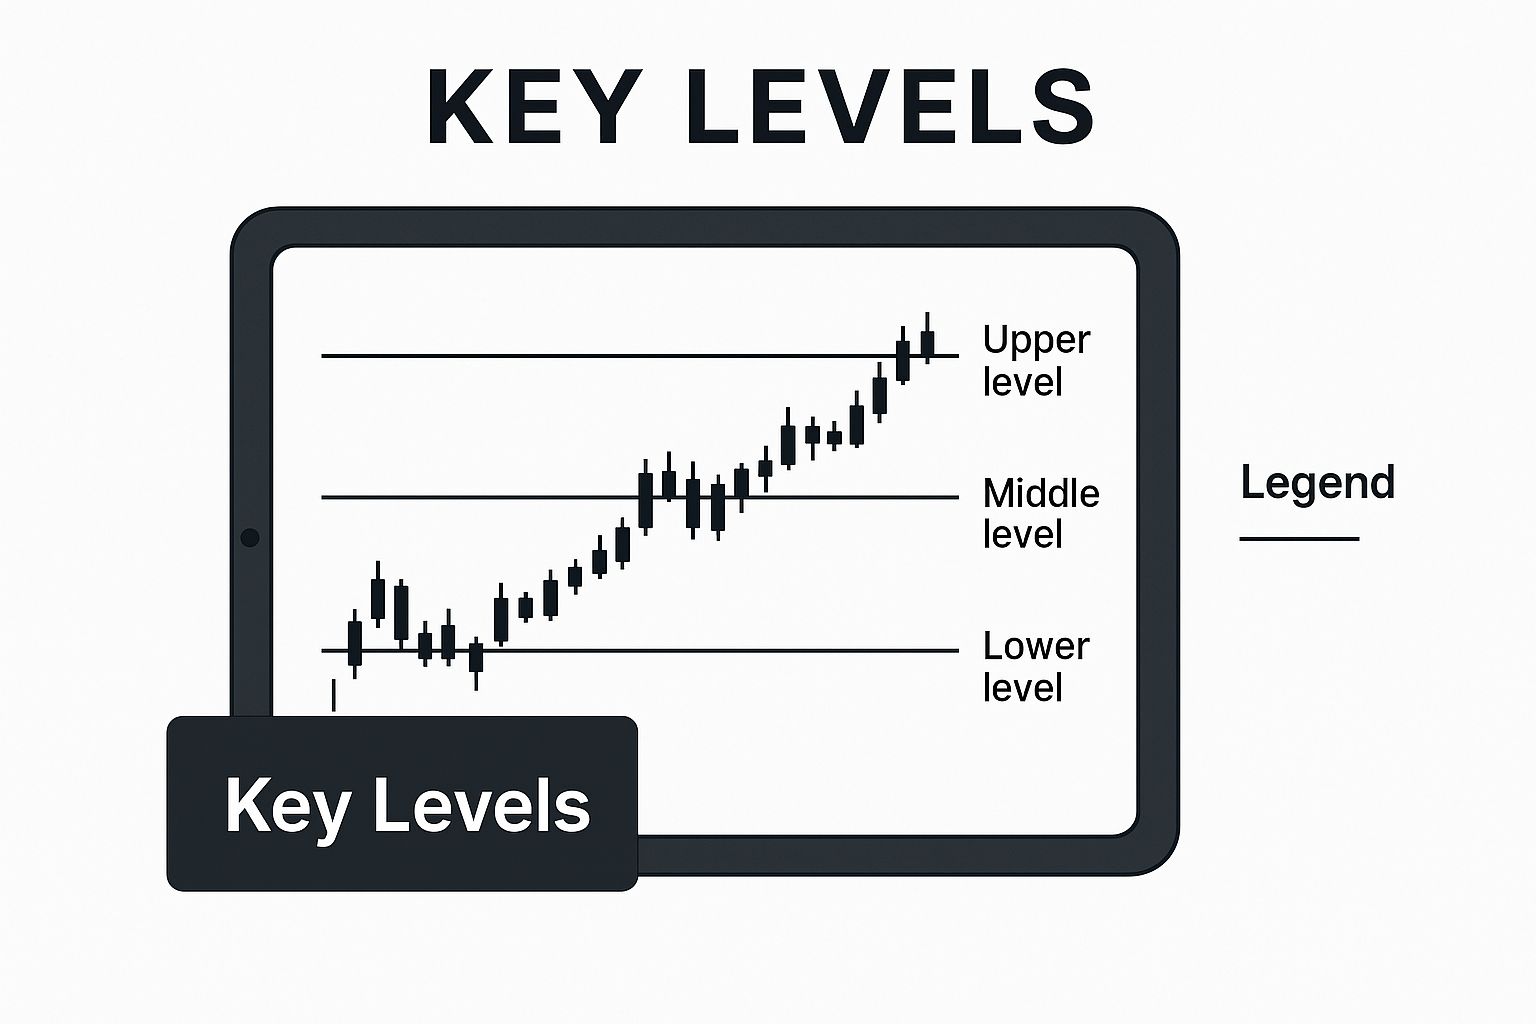
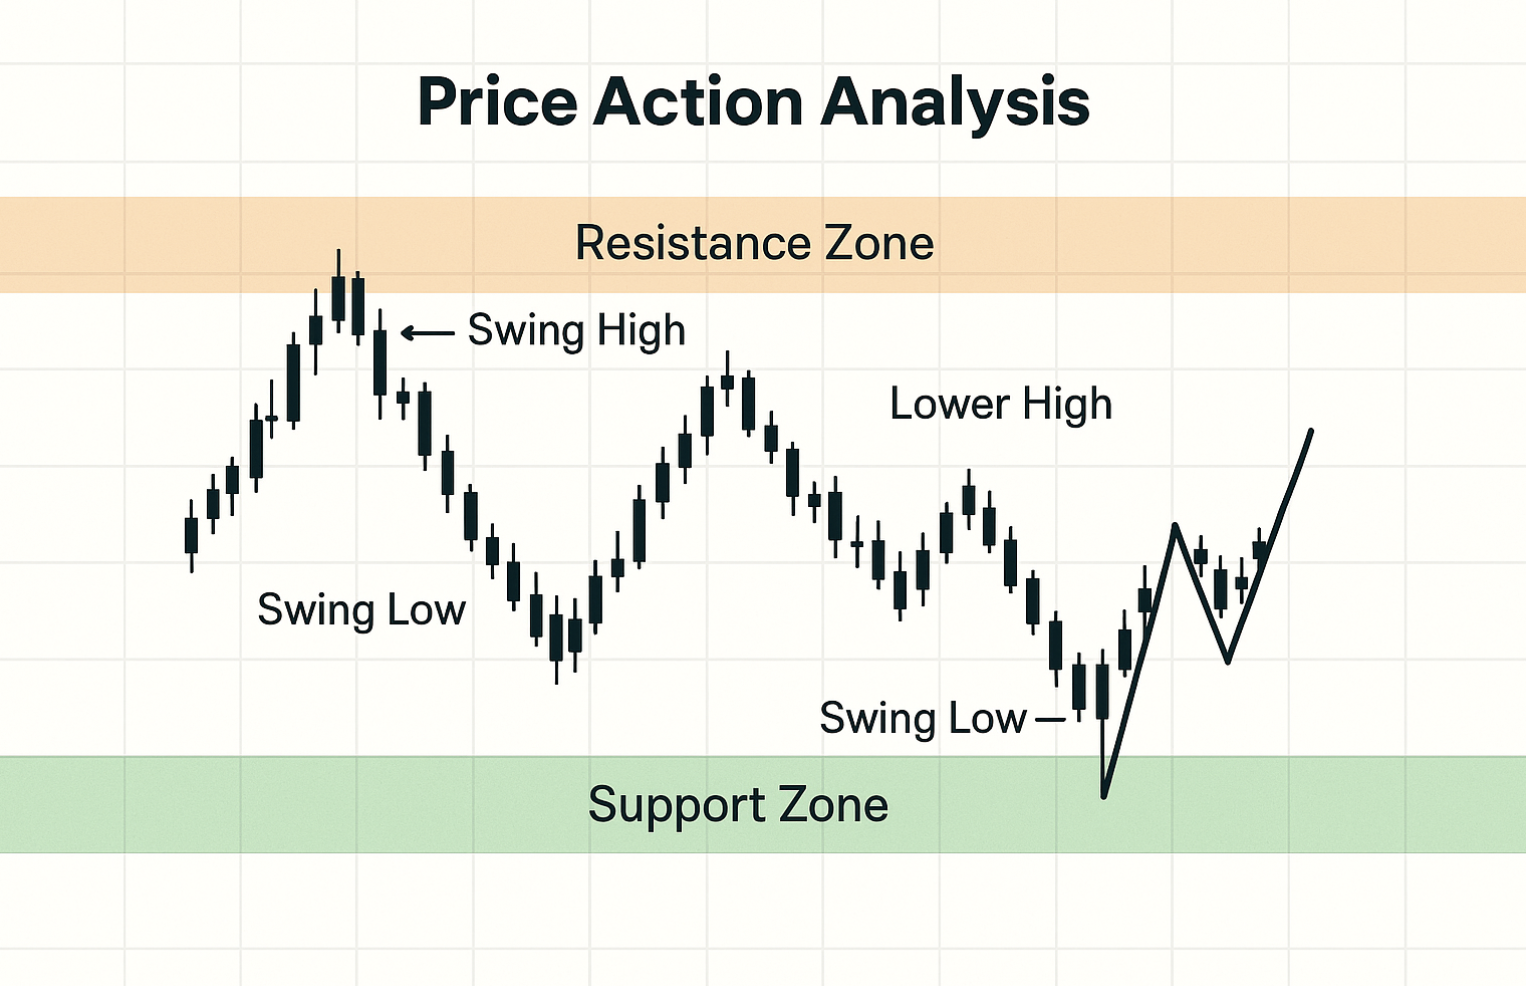
This infographic shows a tablet displaying a financial chart. Horizontal lines mark key support and resistance levels. These lines represent potential points where the price might reverse or consolidate. As the image illustrates, finding these “Key Levels” is essential for a successful support and resistance trading strategy.
But identifying these high-probability zones isn’t as simple as drawing lines on a chart. It requires understanding the market dynamics that create these levels. Professional traders use a variety of techniques to find zones with real trading power. Let’s explore a few of these approaches.
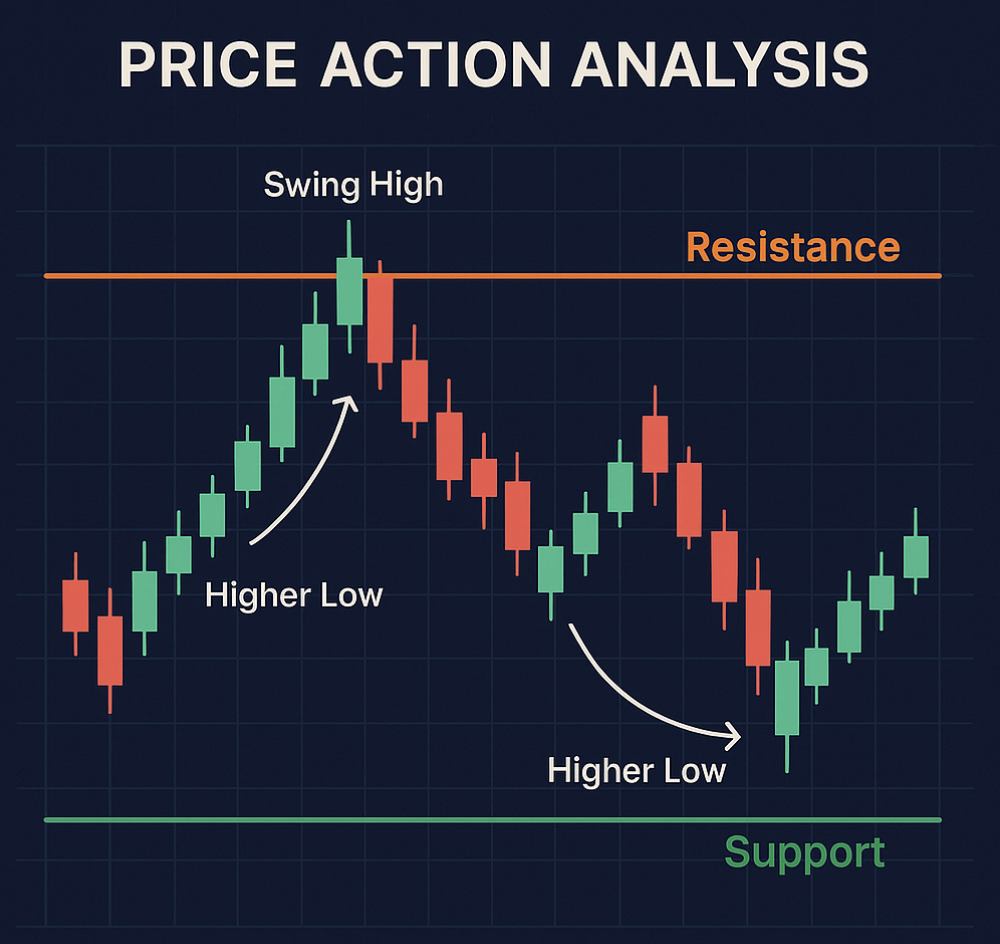
Price Action Analysis
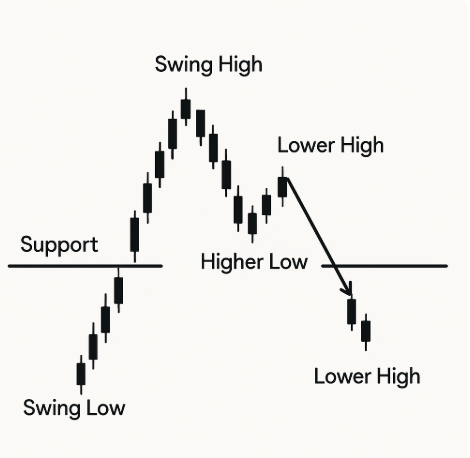
One reliable method for identifying support and resistance is price action analysis. This involves examining past price movements to find areas where the price has repeatedly reversed or stalled. For example, a swing high followed by lower highs can signal a strong resistance zone. A swing low followed by higher lows suggests possible support. Interested in learning more?
Check out this resource: How to master price action.
Pivot Point Analysis
Pivot points are another helpful tool. They’re calculated using the previous day’s high, low, and closing prices. Pivot points generate multiple support and resistance levels, giving traders a wider view of potential turning points. This helps filter minor price fluctuations and highlight significant reversals.
Volume Analysis
Price action and pivot points provide useful insights, but adding volume analysis can greatly improve accuracy. Increased trading volume at a support or resistance level reinforces its importance. For instance, if a price approaches support with high volume and then bounces, it suggests strong buying pressure, confirming the support zone’s validity.
Distinguishing Between Minor and Major Zones
It’s essential to remember that not all support and resistance levels are equal. We need to distinguish between minor speed bumps and major reversal zones. Major zones usually have multiple touches, align with other technical indicators, and show increased trading volume. Identifying these major zones is key to optimizing entry and exit points, thus improving the probability of successful trades. Understanding these techniques is crucial for filtering out market noise and focusing on the most influential price levels.
To help clarify the different types of levels, let’s examine the following table:
Types of Support and Resistance Levels
This table compares different types of support and resistance levels, their characteristics, and reliability factors.
| Level Type | Formation Characteristics | Reliability Factors | Best Timeframes |
|---|---|---|---|
| Swing High/Low | Formed by peaks and troughs in price | More reliable on higher timeframes | Daily, Weekly |
| Pivot Points | Calculated from previous day’s high, low, and close | Provides multiple levels, but can be less reliable individually | All timeframes |
| Trendlines | Drawn along rising or falling price patterns | Reliability depends on the strength and duration of the trend | All timeframes |
| Fibonacci Levels | Derived from Fibonacci retracement sequences | Can provide confluence with other levels | All timeframes |
| Psychological Levels (Round Numbers) | Whole numbers or easily recognizable price points | Often act as strong support or resistance | All timeframes |
The table summarizes the characteristics and reliability of different support and resistance types. Notice how factors like timeframe and confluence with other indicators play a role in determining a level’s strength. By understanding these nuances, traders can better assess the potential impact of each level.
Supercharging Your Analysis With Strategic Indicators
Pinpointing robust support and resistance zones is paramount for successful trading. But how can you amplify your strategy? Using strategic indicators can significantly enhance your approach, providing valuable confirmation and filtering out those pesky false signals. This deeper understanding of price action can lead to more informed and potentially more profitable trading decisions.
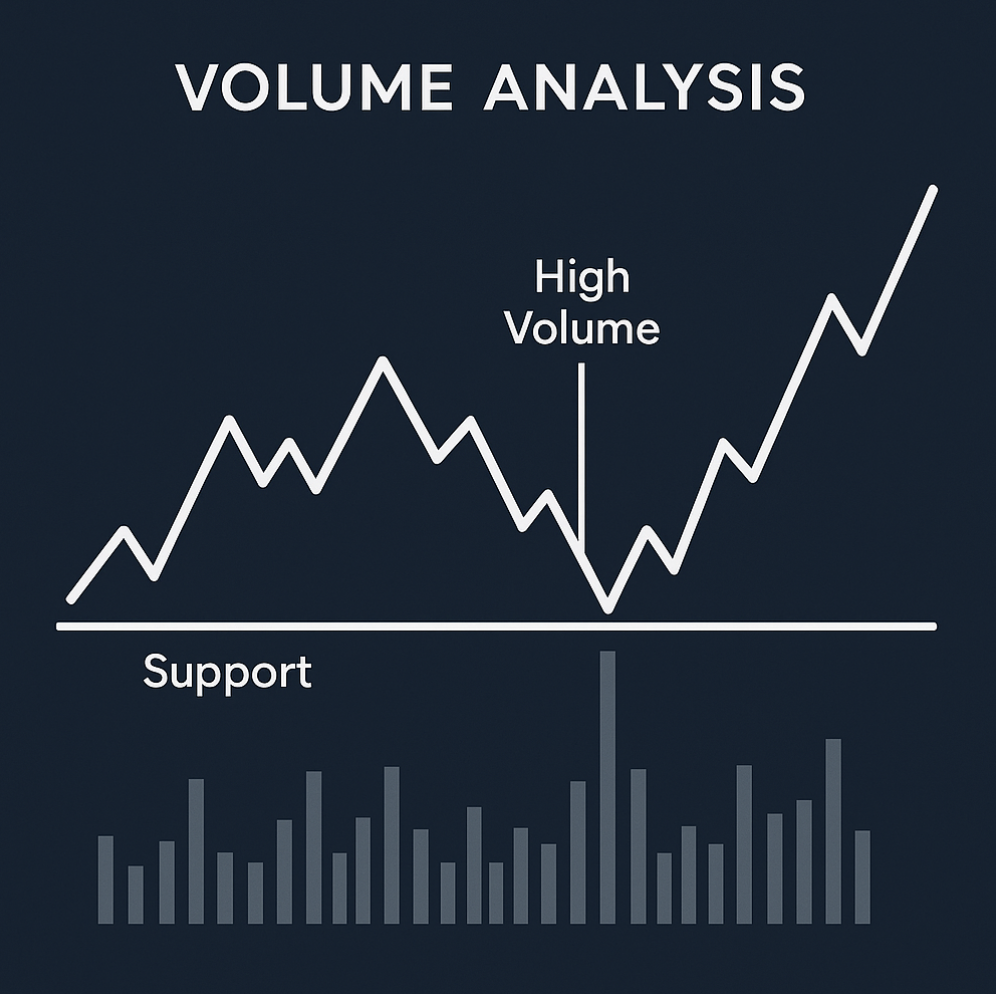
Volume as a Validation Tool
One of the most effective tools for validating the strength of support and resistance is volume. High volume during price rejections at these levels often indicates strong conviction among traders.
For example, imagine the price bouncing off a support level. If this bounce occurs with significantly higher volume than average, it reinforces the level’s importance. Conversely, low volume during bounces or breaks might suggest a lack of conviction and could signal a false signal.
Momentum Indicators for Entry Timing
Momentum indicators, such as the Relative Strength Index (RSI) or the Stochastic Oscillator, can refine entry timing within a support and resistance strategy. These indicators track the speed and magnitude of price fluctuations.
Consider a scenario where the price touches a support level. If the RSI simultaneously displays a bullish divergence—price hitting lower lows while the RSI forms higher lows—it might signal a potential reversal. This could present an opportune entry point for a long trade.
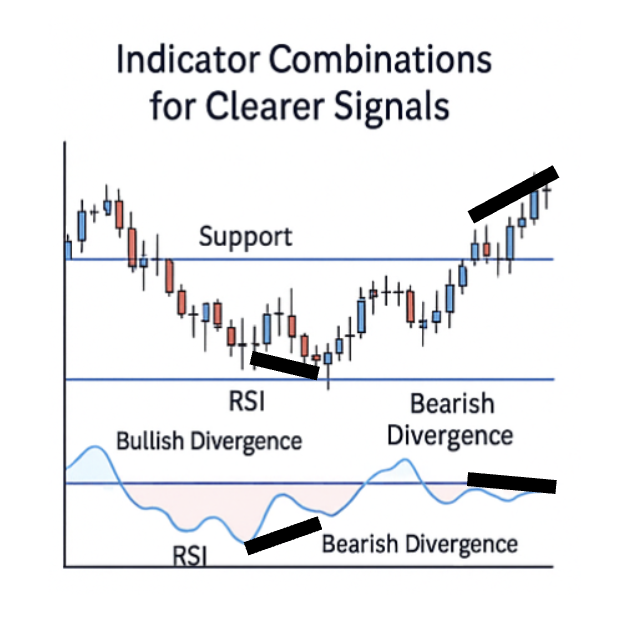
Indicator Combinations for Clearer Signals
Combining indicators can unlock even clearer market insights. Using a moving average alongside support and resistance levels can be particularly potent.
Picture a price rebounding from support while remaining above a key moving average. This convergence could provide a strong confirmation signal for a long trade. Such a layered approach helps filter out market noise and potentially improves the probability of successful trades. Traders frequently utilize tools like moving averages and Bollinger Bands to validate these levels. To delve deeper into this concept, explore this comprehensive guide on support and resistance levels: Support and Resistance Levels.
Identifying Reversals vs. Breakouts
Specific indicator setups can help distinguish between potential reversals and breakouts. For reversals, watch for divergences between price action and momentum indicators, coupled with strong volume at the support or resistance level. For breakouts, high volume accompanying a price piercing through a key level serves as a potent confirmation signal. Bollinger Bands can also help anticipate volatility breakouts, providing traders with invaluable information.
Practical Examples Across Market Conditions
The effectiveness of these indicator combinations is evident across diverse market environments. In a trending market, prior swing highs and lows frequently become new support and resistance levels. Momentum indicators can then help identify optimal entry points as the price interacts with these levels. In a ranging market, oscillators like the RSI can be particularly useful in identifying overbought and oversold conditions near support and resistance, presenting opportunities for range-bound trading strategies. Mastering the integration of these indicators empowers traders to identify high-probability trading opportunities.
Crafting Precision Entry and Exit Rules That Deliver
Identifying strong support and resistance zones is only the first step. To truly profit from these levels, you need precise entry and exit rules. This disciplined approach removes emotion from your trading decisions. Let’s explore how professional traders create these rules, turning potential into profit.
Price Action Confirmations for High-Conviction Entries
Simply reaching a support or resistance level isn’t enough for professional traders. They look for price action confirmations. These confirmations include rejection candles, volume spikes, and momentum shifts. For example, a bullish pin bar forming at support, coupled with increased volume, significantly strengthens the likelihood of a profitable long trade. This confluence provides traders with higher conviction in their entry decisions.
Here is an example of a resistance level and a bearish engulfing candlestick pattern:
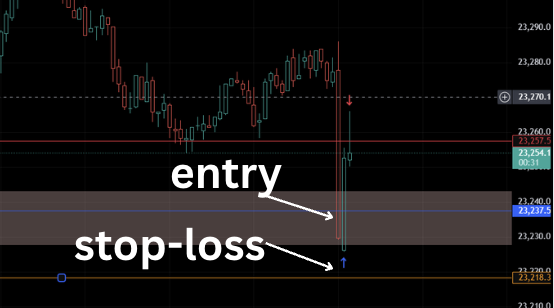
Protective Stops: Balancing Risk and Reward
Managing risk effectively requires protective stops. These stops should be strategically placed to minimize potential losses while avoiding getting stopped out prematurely. A common strategy involves placing stops just beyond the support or resistance level, factoring in typical price movements. Imagine entering a long trade at support. Your stop-loss would be placed slightly below that support level.
Profit-Taking Approaches That Maximize Gains
Profit-taking strategies are just as important as entry and exit rules. Several approaches exist, each with its own advantages. Some traders use fixed profit targets, aiming for a specific percentage return. Others prefer trailing stops, which let profits run while protecting against sudden reversals. A trailing stop adjusts dynamically as the price moves in your favor, locking in profits if the trend continues.
Contingency Plans for Unexpected Market Turns
Markets are constantly changing, and trades don’t always go as planned. Developing contingency plans is critical for managing trades that don’t behave as expected. This may involve adjusting your stops, taking partial profits, or even exiting the trade altogether if the market signals a significant shift. Predefined rules for these situations help traders stay objective and avoid emotional reactions. You might find this interesting: How to master different trading strategies.
Scenario Analysis: Reversals and Breakouts
To refine your strategies further, let’s examine two common scenarios: reversals and breakouts.
To help illustrate these scenarios, let’s examine the following table:
Support and Resistance Trading Scenarios
This table outlines different trading scenarios at support/resistance levels, with corresponding entry signals, stop placement, and target strategies.
| Trading Scenario | Entry Signal | Stop-Loss Placement | Profit Target Strategy | Risk-Reward Ratio |
|---|---|---|---|---|
| Reversal at Support | Bullish Pin Bar/Engulfing Candle with increased volume | Slightly below the support level | Fixed target or trailing stop | 1:2 or higher |
| Reversal at Resistance | Bearish Pin Bar/Engulfing Candle with increased volume | Slightly above the resistance level | Fixed target or trailing stop | 1:2 or higher |
| Breakout from Resistance | Strong close above resistance with high volume | Slightly below the previous resistance, now acting as support | Multiple of the breakout range or trailing stop | Varies based on market conditions |
| Breakout from Support | Strong close below support with high volume | Slightly above the previous support, now acting as resistance | Multiple of the breakout range or trailing stop | Varies based on market conditions |
This table summarizes key entry and exit points based on different market scenarios. Combining support and resistance analysis with price action confirmations and defined risk management creates a robust trading framework. This structured method allows you to trade with more clarity, consistency, and confidence across diverse market environments. Remember, mastering support and resistance trading is an ongoing process of practice and refinement.
Mastering Role Reversal: The Ultimate Trading Advantage
The most powerful aspect of a support and resistance trading strategy isn’t simply identifying these levels. It’s understanding their dynamic nature and anticipating when they’ll switch roles. This “role reversal” phenomenon, where previous support transforms into resistance (and vice versa), often catches traders off guard. However, by learning to recognize the signs, you can capitalize on these shifts and gain a significant trading edge.
Why Support Becomes Resistance (and Vice Versa)
This role reversal stems from the underlying psychology of the market. Imagine a stock struggling to break above $100. This level acts as resistance. Once the price finally breaks through, traders who previously sold at $100 might now view it as a good entry point. This creates buying pressure and turns the former resistance into support. Conversely, if a stock breaks down through a support level, those who bought near that level might sell to limit losses, reinforcing the newly formed resistance.
Anticipating the Transformation
Anticipating these role reversals involves careful observation of price action and volume. Strong breakouts accompanied by high volume suggest a higher probability of a successful role reversal. For example, if a stock breaks above resistance with significantly increased volume, it signals strong buying conviction. This makes the former resistance a likely support level. Additionally, pay close attention to candlestick patterns during these breakouts. A strong bullish engulfing candle during a breakout from resistance adds further confirmation to the potential role reversal.
Trading the Transitions
Once you’ve identified a potential role reversal, specific trading techniques can help you profit. For example, after a breakout from resistance, consider entering a long position near the newly established support (the former resistance level). Place your stop-loss just below this support to manage risk. Conversely, after a breakdown from support, a short position near the new resistance could be profitable, with a stop-loss placed just above it. Check out this guide on How to Master Various Trading Strategies to expand your knowledge base.
Recognizing False Reversals
Not all breakouts lead to genuine role reversals. False breakouts, also known as fakeouts, can occur when the price breaks through a level but quickly reverses. These traps can lead to significant losses if not recognized. Look for low volume during the breakout and subsequent price action that fails to confirm the new support or resistance level as warning signs of a false reversal. For instance, if the price breaks above resistance on low volume and then quickly falls back below it, it might suggest a lack of genuine buying pressure and could be a false breakout.
High-Probability Setups Across Markets
These role reversal opportunities exist across various asset classes, from stocks and forex to cryptocurrencies. In the volatile cryptocurrency markets, identifying these dynamic shifts is especially crucial. For example, in Bitcoin, previous all-time highs can often become strong support levels once surpassed again, demonstrating the power of role reversals in different market conditions. Mastering this concept of dynamic support and resistance gives you a nuanced understanding of how market psychology shapes price action, creating some of the most reliable trading opportunities. By anticipating these shifts and utilizing a well-defined support and resistance trading strategy, you can increase your trading success significantly.
Building Your Personalized Support and Resistance System
Now, let’s move from theory to practical application. It’s time to build a personalized support and resistance trading strategy. This strategy should complement your unique trading style, risk tolerance, and the time you have available. This goes beyond simply identifying levels; it’s about creating a comprehensive trading plan.
Selecting the Right Timeframes
Choosing the right timeframes is paramount for your analysis. A day trader might concentrate on 5-minute or 15-minute charts, while a swing trader might find daily or weekly charts more useful. Your chosen timeframe should align with your trading goals and the amount of time you can commit to market analysis. For instance, if you’re only able to monitor the markets for a few hours a day, shorter timeframes might be impractical.
Customizing for Market Conditions
Different market conditions require different strategies. In a trending market, prior swing highs and lows often form significant support and resistance levels. However, in a ranging market, horizontal levels and psychological numbers might be more pertinent. Your support and resistance trading strategy needs to adapt to these changing conditions. This adaptability helps you anticipate market shifts and capitalize on trading opportunities.
Systematically Tracking Your Performance
Tracking your trading performance is vital for improvement. Document each trade, including entry and exit points, stop-loss and take-profit levels, and your reasoning for each decision. This detailed record provides crucial information for analyzing your strengths and weaknesses. By recognizing patterns in your wins and losses, you can refine your trading strategy over time. This constant refinement is essential for long-term success.
Documenting Your Trading Rules
A well-documented trading plan provides structure and consistency. Detail your rules for identifying support and resistance, your entry and exit criteria, your risk management strategies, and your position sizing rules. This documentation acts as a guide, helping you maintain discipline and avoid impulsive, emotional trading decisions. For example, clearly define specific price action confirmations, such as a pin bar forming at support, before entering a trade.
Establishing Key Performance Metrics
Establish key performance metrics (KPIs) to monitor your progress. These metrics might include your win rate, average profit/loss per trade, and maximum drawdown. Regularly reviewing these KPIs helps you pinpoint areas for improvement and reinforces effective trading habits. If your win rate consistently falls below a certain level, it might indicate a need to re-evaluate your entry and exit rules.
Building a Sustainable Framework
Developing a sustainable trading framework takes patience and discipline. It’s an ongoing process of learning and adaptation, not a quick solution. As you gain experience, your understanding of support and resistance will grow, enabling you to refine your approach and enhance your trading results. This continuous learning and adaptation are key components for building a successful trading career.
Position Sizing and Adaptation
Finally, consider position sizing relative to the strength of the identified zones. Stronger zones often justify larger positions, while weaker zones warrant smaller allocations. This dynamic approach optimizes your risk-reward ratio. Moreover, stay adaptable. Markets are constantly evolving, and your support and resistance trading strategy should evolve with them. Continuously refining your methods and integrating new market insights will contribute to your long-term profitability.
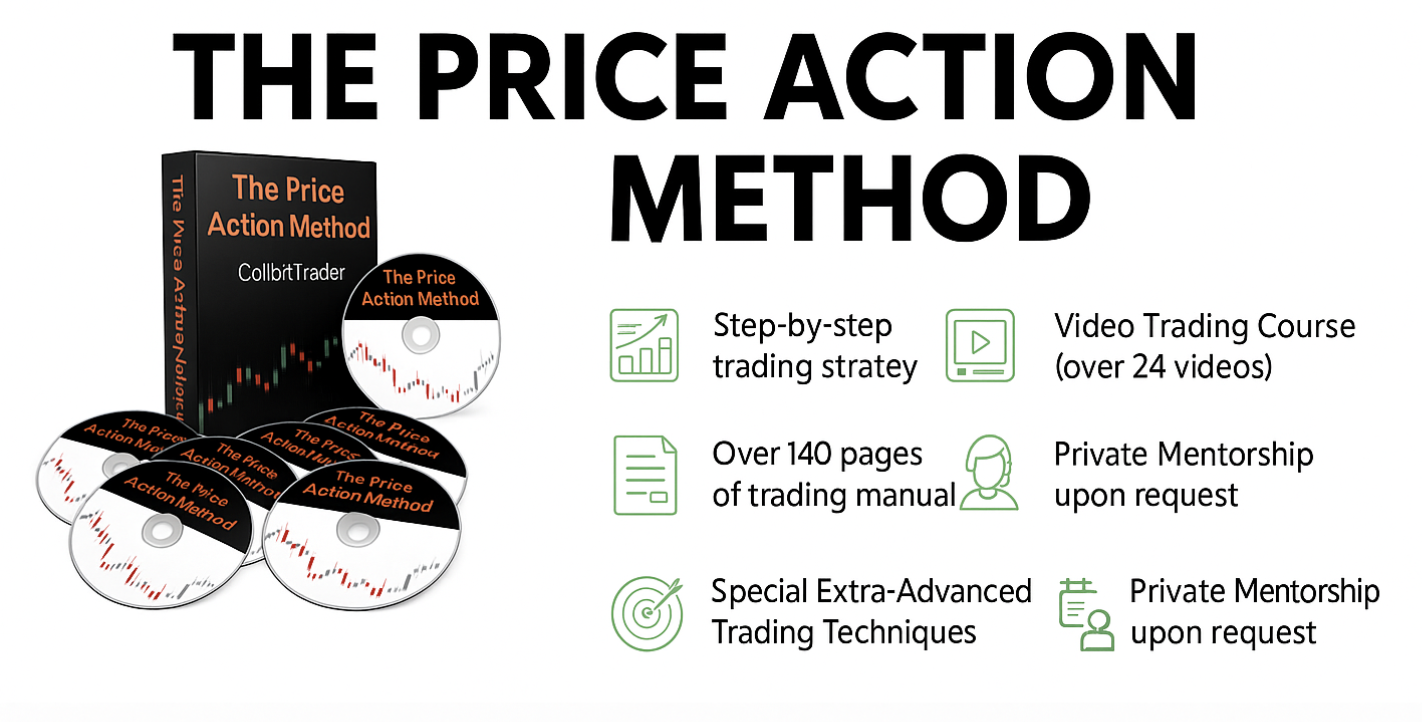
Ready to improve your trading with a proven, price action-focused approach? You can gain instant access to our world-renowned price action trading course.