Master the Supply and Demand Trading Strategy Today
The Psychology Behind Effective Supply and Demand Trading
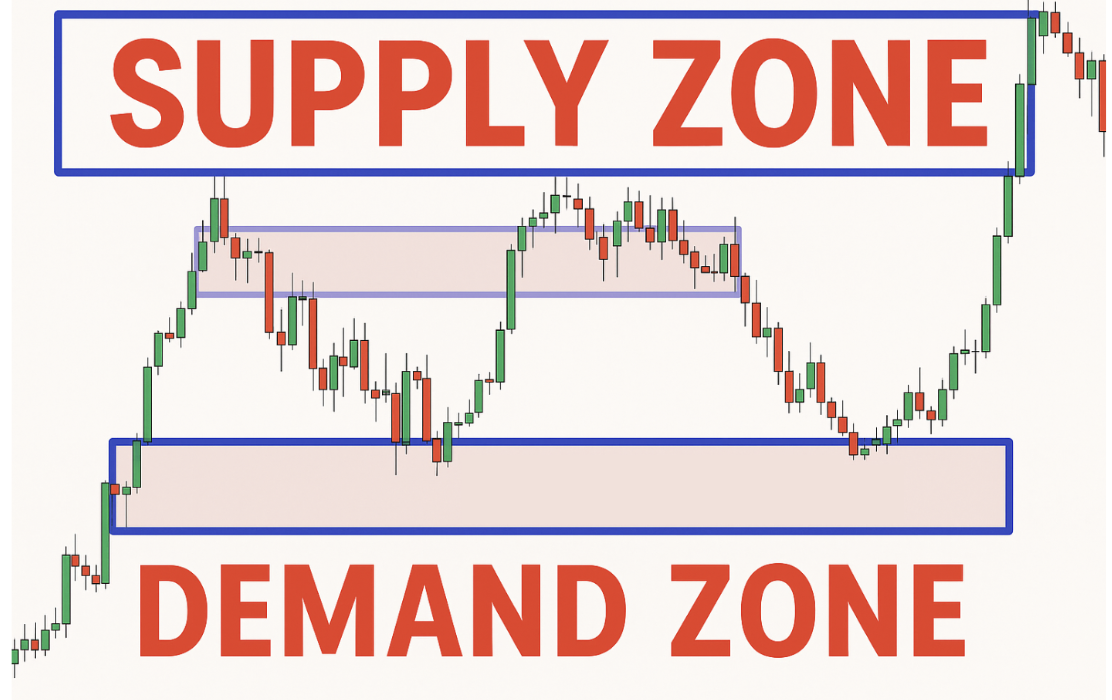
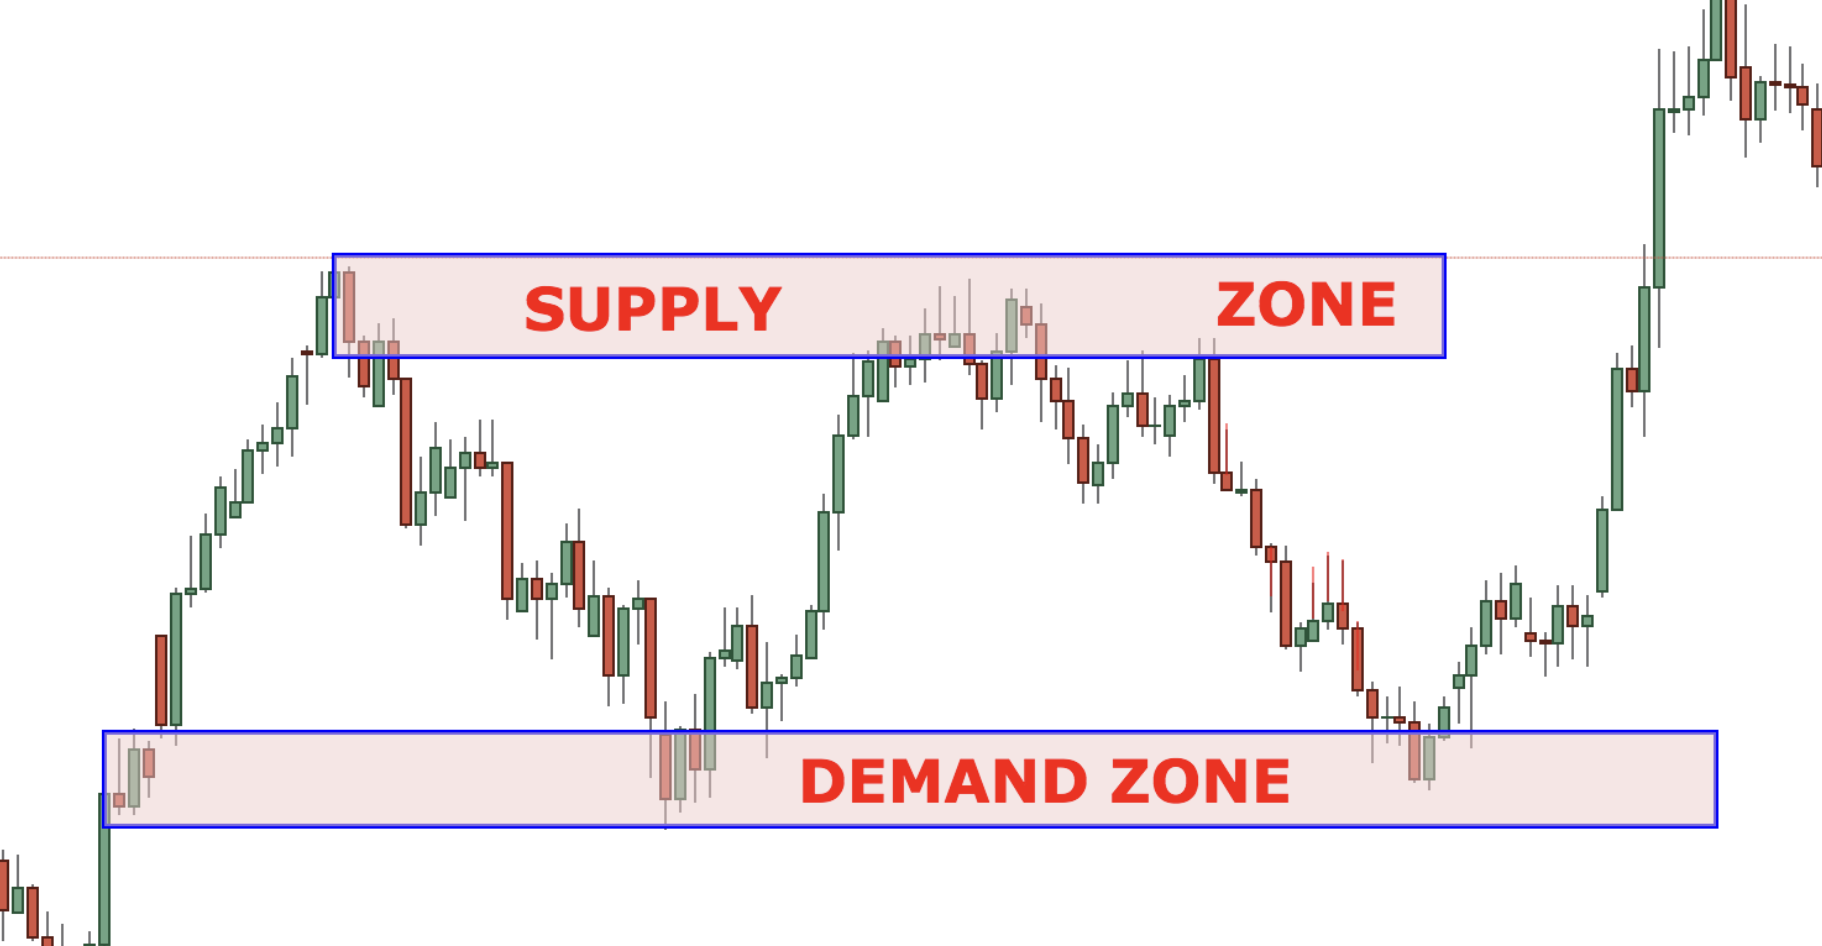
This supply and demand approach revolves around a basic economic truth: price fluctuates due to imbalances between buyers (demand) and sellers (supply). This core concept helps traders anticipate price reversals by pinpointing areas where these imbalances are most pronounced. This means looking at where price has historically shown strong reactions, rather than relying on lagging indicators.
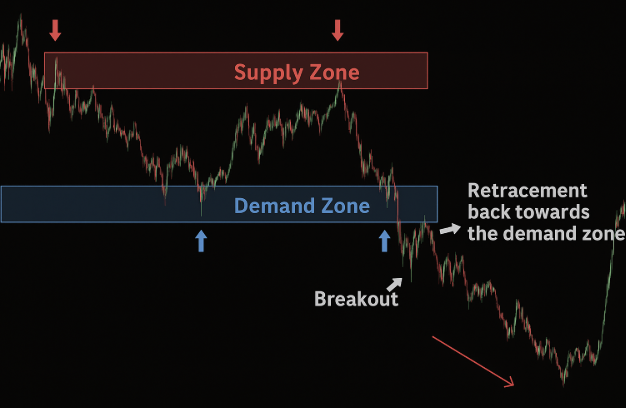
A significant price drop immediately followed by a sharp reversal, for example, suggests a demand zone. This is where buyers aggressively entered the market, absorbing the available supply and pushing the price upward. Conversely, a rapid price jump followed by a sudden drop indicates a supply zone, where sellers overwhelmed buyers, driving the price down. This focus on actual price action simplifies trading, making it more intuitive.
The effectiveness of supply and demand trading also stems from its emphasis on the fundamental driver of price movement: the buyer-seller imbalance. Unlike strategies based on complex indicators, this approach analyzes price action directly. For instance, a study of the S&P 500 index showed that price reversals in high-probability supply and demand zones led to successful trades over 60% of the time. This high success rate is attributed to the clear supply and demand zones created by large institutional trades, such as those made by banks.
These zones are identifiable through sharp price reversals following periods of intense buying or selling. The strategy is especially useful in volatile markets where traditional indicators might struggle. By understanding historical price action and the behavior of major market participants, traders can improve their risk management and trading results.
The Psychological Advantage
This intuitive method offers a significant psychological benefit. Trading directly from price action builds confidence, as traders witness the direct cause-and-effect relationship between supply and demand imbalances and price movements. This provides a clear, logical foundation for trading decisions, especially valuable in volatile market situations. This clarity is why many traders choose this strategy over complex, indicator-based systems.
Maintaining Discipline in Volatile Markets
Supply and demand trading fosters discipline. By identifying key zones in advance, traders can pre-plan entries and exits. This reduces the chance of impulsive, emotional decisions during market swings. A defined trading plan based on these levels helps traders maintain focus and avoid being influenced by short-term market fluctuations. The clarity of this strategy enables traders to stick to their plan, improving their overall trading performance.
Finding the Gold Mines: Identifying Premium Trading Zones
Forget textbook theories. Let’s explore how seasoned traders pinpoint real supply and demand imbalances on price charts. By examining actual market movements, we’ll uncover the subtle price action signals that separate high-probability trading zones from typical support and resistance. This involves recognizing signs of institutional trading activity, often a precursor to future price reversals, a cornerstone of the supply and demand trading strategy. A critical part of this is distinguishing between fresh and exhausted zones.
Spotting Institutional Footprints
One way to locate strong supply and demand zones is by searching for signs of institutional activity. These large players often leave distinct “footprints” on the charts. For instance, a sudden, sharp price spike followed by a period of consolidation can signal a supply zone where institutions are distributing their holdings. Conversely, a rapid drop followed by a swift recovery may suggest a demand zone where they are accumulating.
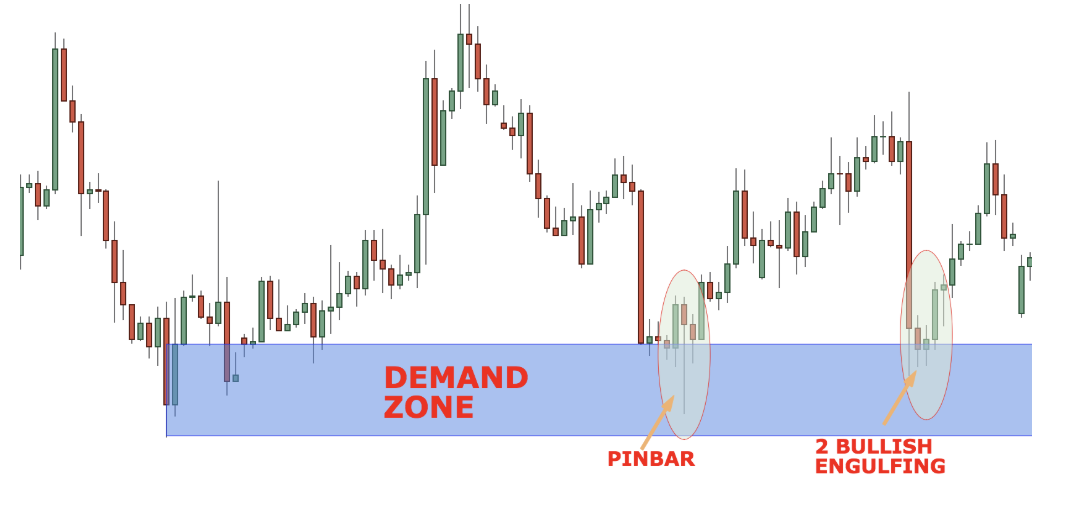
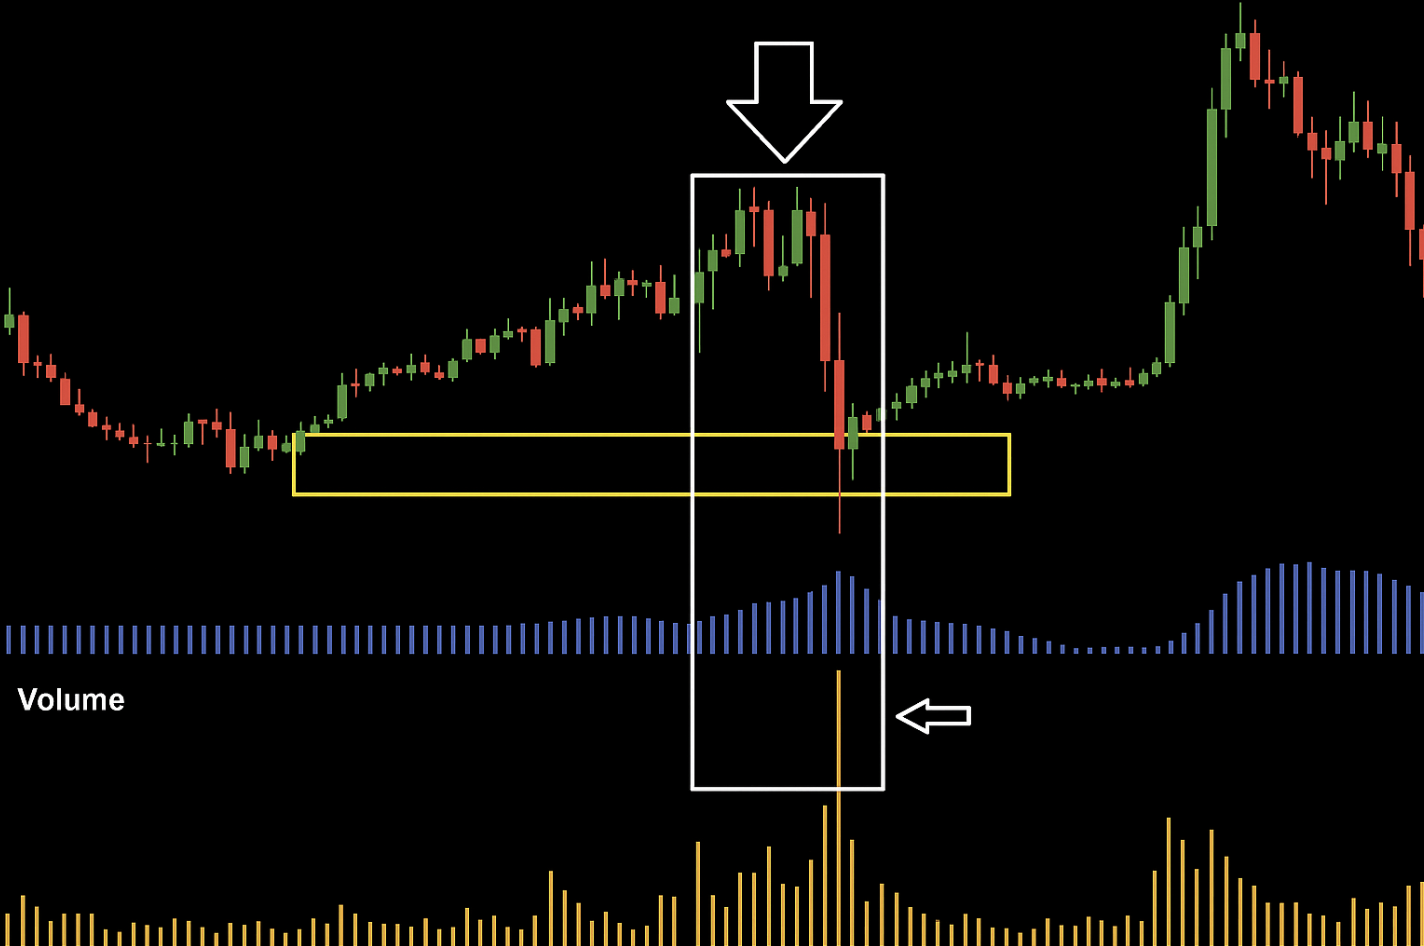
This infographic illustrates a typical supply zone, marked by the peak price and the corresponding volume spike. The high volume at the peak suggests intense selling pressure, probably from institutional traders unloading their positions. This visually reinforces how to identify supply zones based on swift price increases and sharp reversals. There is a pin bar and a bullish engulfing candlestick, which confirm the interest of the buyers and push the price higher.
Validating Zone Strength With Volume
Volume analysis is essential for confirming the potential of a zone. High volume during the initial price movement that creates the zone suggests strong conviction and increases the chance of a significant reversal. Diminishing volume on subsequent tests of the zone, however, might signal weakening pressure and a possible breakout. That’s why monitoring volume is so important in supply and demand trading.
Using Historical Examples to Understand Supply and Demand
Looking at past market behavior can provide valuable insights into supply and demand dynamics. The platinum market between 2013 and 2018 offers a good example. During this time, shifts in industrial demand and mining production created significant price swings. The 2014 South African miners’ strike, for instance, triggered a 4% surge in platinum prices because of supply constraints. Conversely, falling demand caused sharp drops. Studying these situations helps traders anticipate similar events and improve their ability to identify profitable supply and demand zones. These zones often represent strong support and resistance levels where prices reverse due to imbalances between buyers and sellers. More detailed statistics can be found here.
Prioritizing and Analyzing Multiple Zones
Charts frequently display numerous supply and demand zones. Prioritizing them is crucial for trading successfully. Focus on the zones with the most recent and significant price reactions. Also, consider your trading timeframe. Zones on higher timeframes (like daily or weekly charts) are typically stronger than those on lower timeframes (like hourly or 15-minute charts).
To help traders better understand the qualities of strong and weak zones, let’s look at a comparison:
Characteristics of Strong vs. Weak Supply/Demand Zones
| Zone Characteristic | Strong Zones | Weak Zones |
|---|---|---|
| Price Reaction | Significant, sharp reversals | Small or insignificant price bounces |
| Volume | High volume during initial zone formation | Low volume during zone formation |
| Recency | Recent price reactions | Older, less relevant price reactions |
| Timeframe | Appear on higher timeframes (daily, weekly) | Appear on lower timeframes (hourly, 15-minute) |
| Number of Tests | Fewer tests with strong reactions | Multiple tests with weak reactions |
This table highlights key differences between strong and weak supply and demand zones. Strong zones typically exhibit sharp price reversals with high volume, are found on higher timeframes, and haven’t been tested numerous times. Weak zones, on the other hand, show weak price reactions, low volume, exist on lower timeframes, and may have been tested repeatedly. Focusing on strong zones increases the probability of successful trades.
Recognizing Warning Signs
Not every zone is equal. Some are weaker and more prone to failure. Be cautious of zones tested multiple times with minimal price reaction. This may mean the buyer/seller imbalance has diminished, underscoring the importance of fresh zones. Also, watch for false breakouts, where the price briefly exceeds a zone then quickly reverses. These can trap inexperienced traders. Careful analysis is essential. Recognizing these warning signs can prevent losses and lead to more profitable setups.
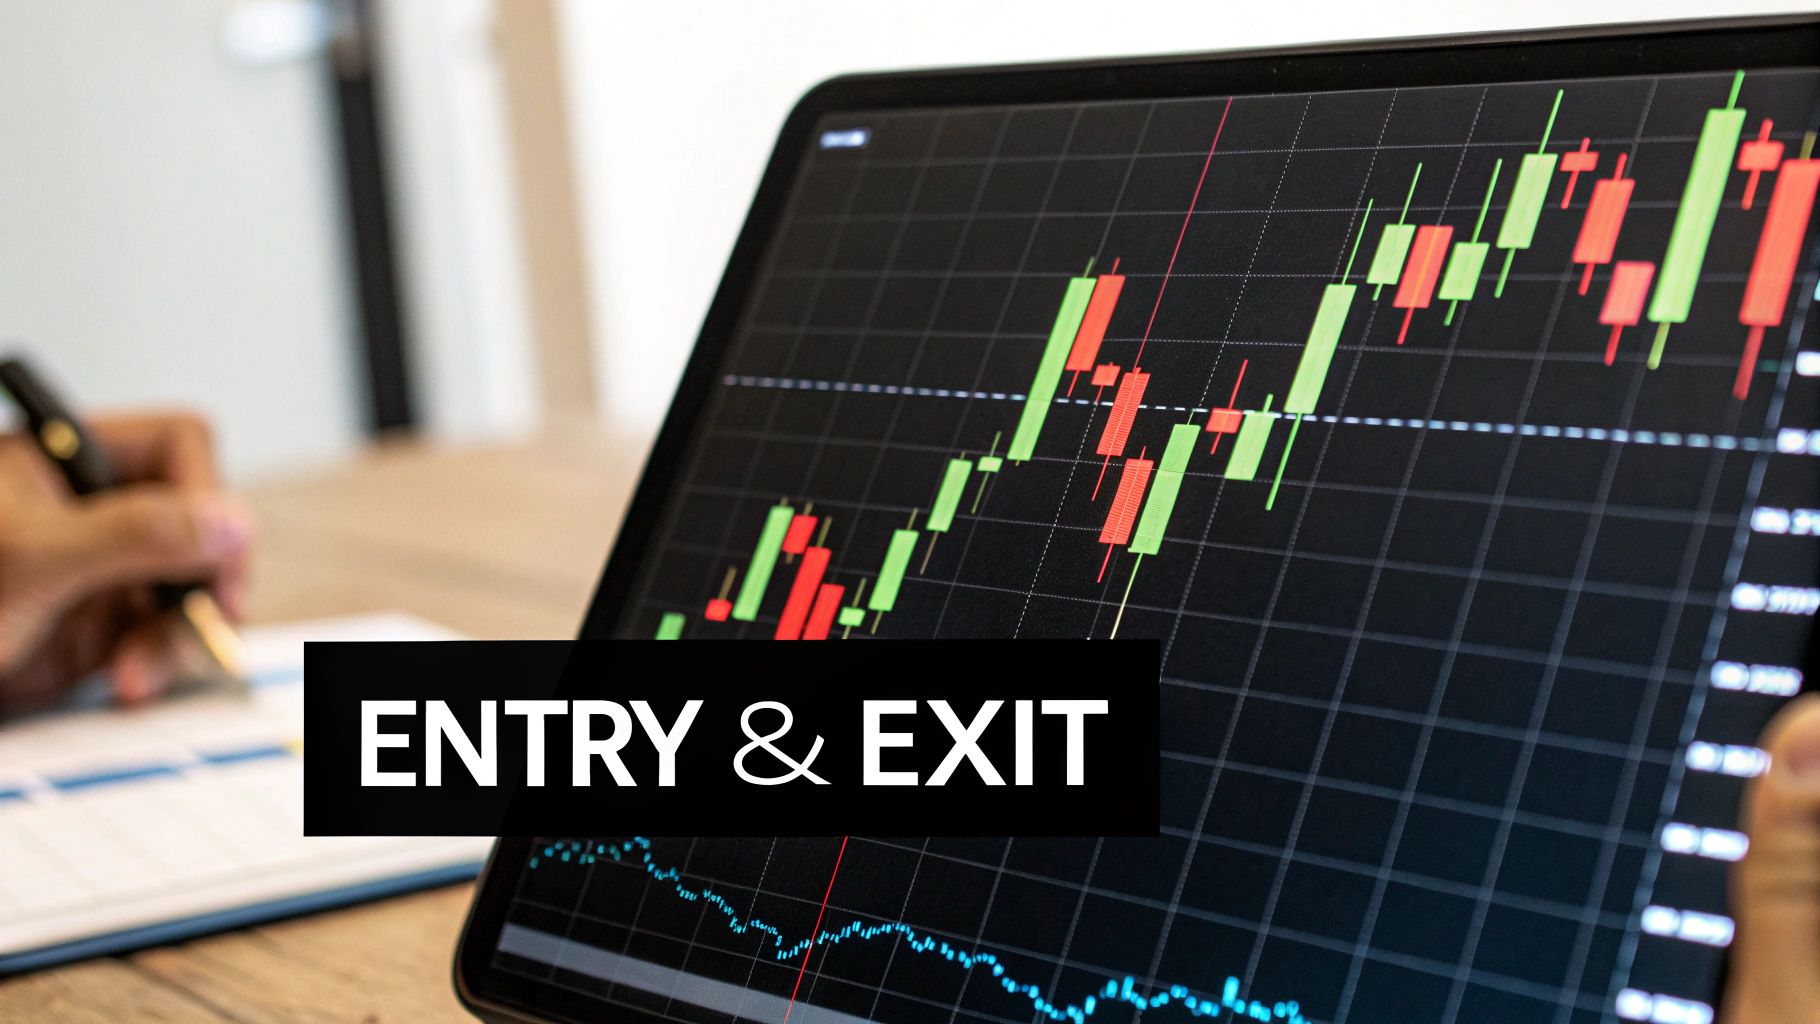
Executing Trades That Maximize Profit While Minimizing Risk
Identifying promising supply and demand zones is only half the battle. The next crucial step is executing trades that capitalize on these opportunities while managing risk effectively. This involves strategically selecting entry points, setting appropriate stop-loss orders, and implementing profit-taking strategies that optimize returns. This section explores these critical aspects of the supply and demand trading strategy.
Mastering Entry Techniques
Entering a trade at the optimal moment is key to maximizing profit potential. There are several approaches, each with its own balance of precision and practicality. Limit orders allow precise entries at a predetermined price within the identified zone, ensuring you don’t overpay. This conservative approach is ideal for traders who prioritize minimizing risk.
However, limit orders aren’t always filled, potentially causing you to miss a trading opportunity. A more aggressive approach involves confirmation-based entries. This method requires observing confirming price action signals, such as a candlestick pattern or a break of a trendline, before entering.
This typically results in entries slightly later than limit orders but provides more assurance that the zone is holding. Understanding these different approaches and selecting the one that aligns with your risk tolerance and trading style is crucial.
Stop Loss Placement: Protecting Your Capital
Defining your stop-loss level is essential for risk management. Placement should be based on the zone’s characteristics and the prevailing market volatility. For a strong demand zone, place the stop-loss just below the zone’s lower boundary.
For a supply zone, position it just above the upper boundary. Adjust these placements based on volatility; wider stops are appropriate in more volatile markets. This practice limits potential losses if the trade moves against you, protecting your capital.
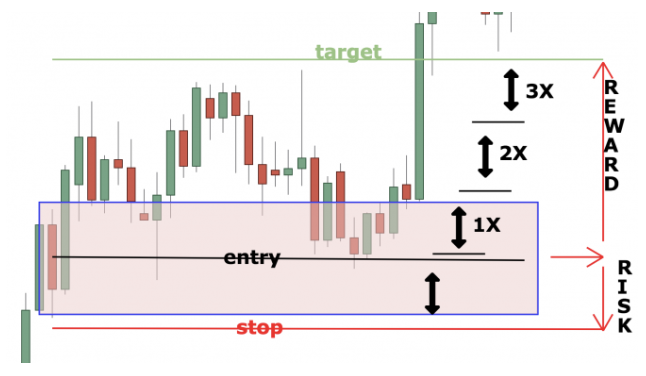
Profit-Taking Strategies: Securing Your Gains
While managing risk is crucial, effective profit-taking is how you realize gains. Basic exit strategies often fall short of maximizing profit. Partial profit taking involves securing a portion of your profits at pre-determined levels within the anticipated price move.
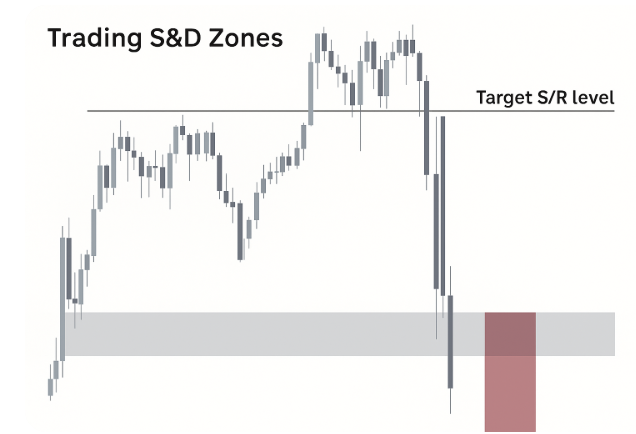
This locks in gains while allowing the rest of the position to potentially run further. Trailing stops are another technique, dynamically adjusting your exit point as the price moves in your favor, locking in profits as the trade progresses. Finally, consider using opposing zones as natural profit targets.
For example, if you enter a long trade in a demand zone, look for a supply zone higher on the chart as a potential exit point. These opposing zones often represent areas of strong potential resistance, providing a logical and often highly profitable place to exit a trade.
Position Sizing and Risk Adjustment
Position sizing is an often-overlooked aspect of trading. The amount of capital you allocate to each trade should be relative to the zone’s strength. Stronger zones, characterized by sharp reversals and significant volume, justify larger position sizes. Conversely, weaker zones warrant smaller positions.
Experienced traders also adjust their risk parameters based on zone qualities. For instance, they might tighten stop losses in weaker zones to minimize potential losses.
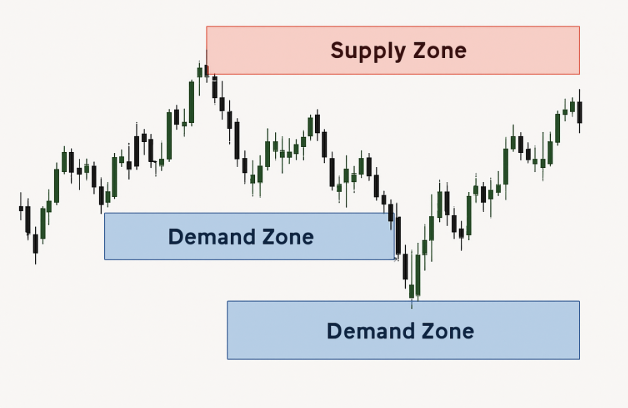
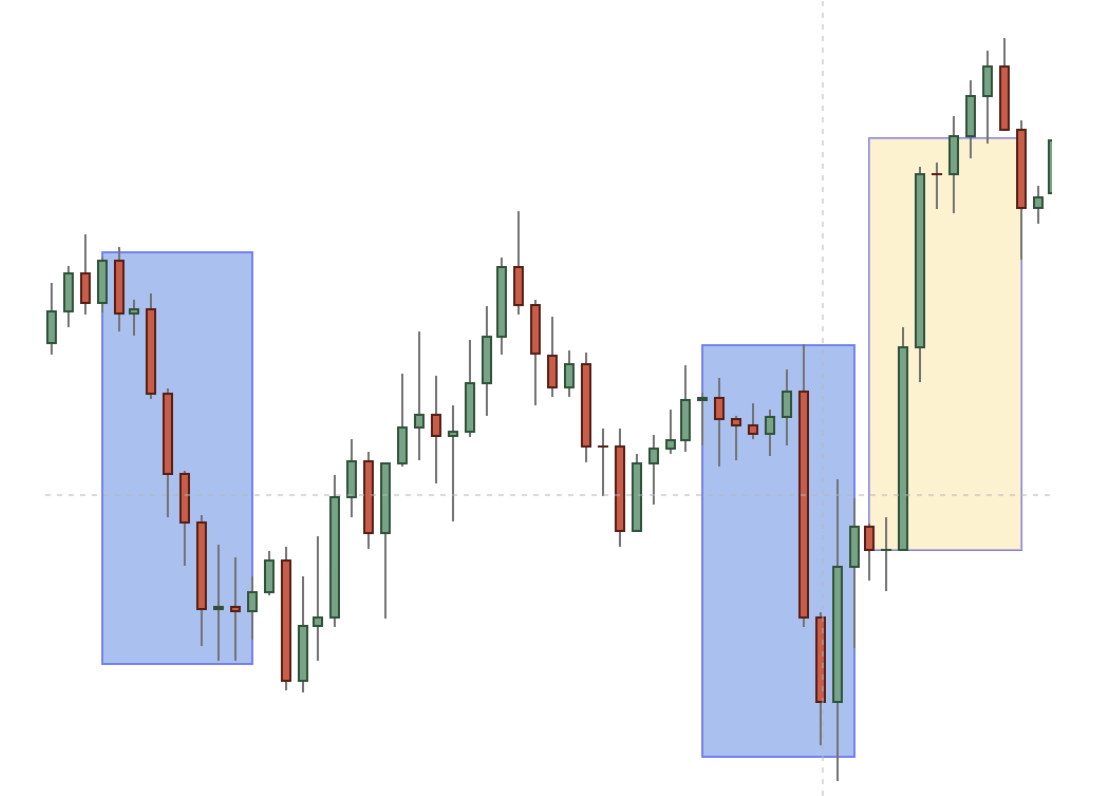
This image demonstrates how professional traders visualize supply and demand zones within a broader market context. Note the varying sizes of the zones, reflecting differing levels of anticipated trading activity and potential strength. This helps traders make informed decisions regarding position sizing and highlights the importance of a holistic understanding of market dynamics in supply and demand trading strategy.
Creating Your Supply and Demand Trading Ecosystem
A robust supply and demand trading strategy offers a strong starting point. However, combining it with other analytical tools can significantly boost its power. This is how seasoned traders consistently achieve those enviable win rates. Let’s explore how to seamlessly blend complementary techniques without sacrificing the core principles of supply and demand.
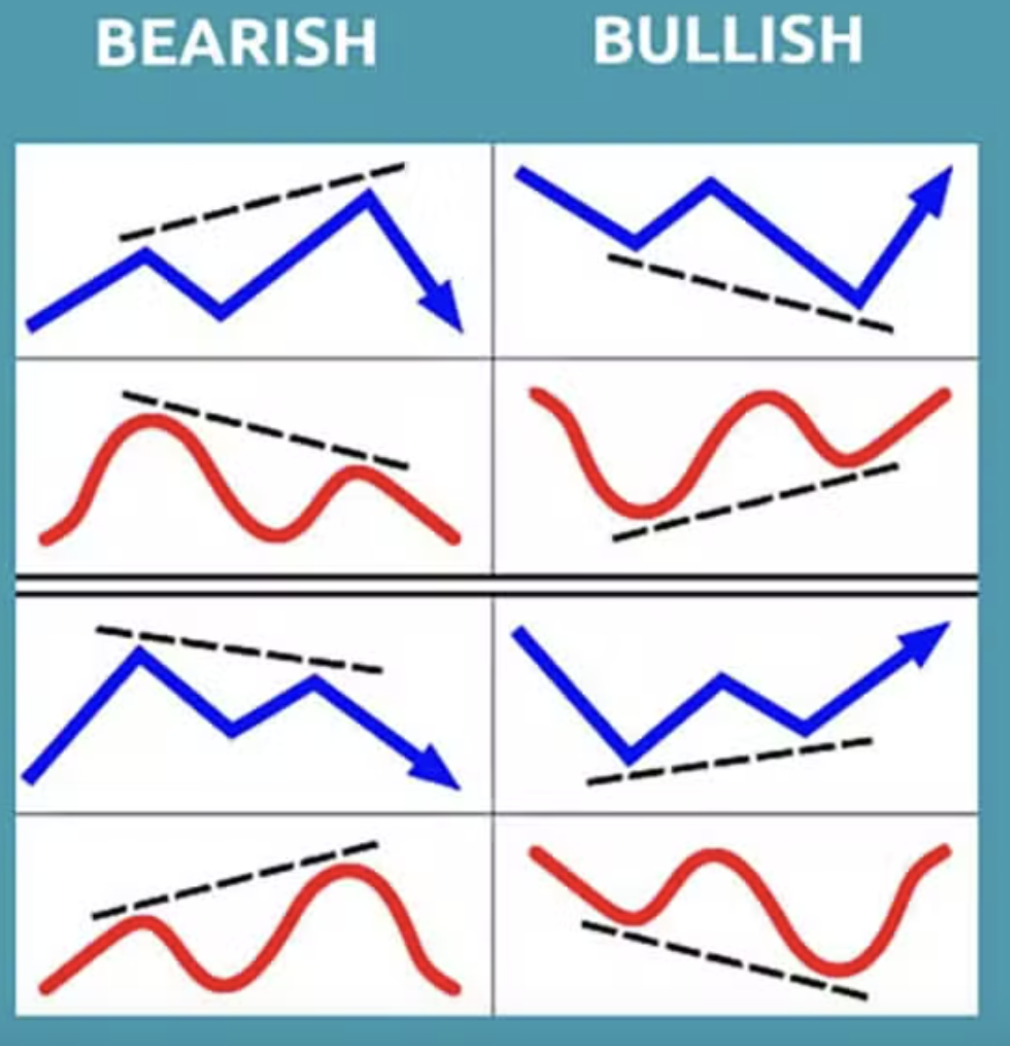
Integrating Trend Analysis
Understanding the dominant trend gives you crucial context. Imagine selling at a supply zone during a powerful uptrend. The upward momentum could easily squash the selling pressure, resulting in a losing trade.
Simple tools like trendlines and moving averages provide valuable clues. For example, trading only supply zones that form within a downtrend greatly increases your chances of success. Likewise, concentrating on demand zones in uptrends lets you ride the upward wave more effectively. This filters out lower probability trades.
Candlestick Patterns as Confirmation Signals
Specific candlestick patterns near supply and demand zones can act as strong confirmation signals. A bearish engulfing pattern at a supply zone reinforces the potential for a downward reversal. A bullish engulfing pattern at a demand zone does the same for an upward move.
These patterns offer visual cues, adding confidence to your trade execution. However, don’t overemphasize individual candlestick formations without considering the bigger picture of the zone and the trend.
Momentum Indicators and Market Structure
Momentum indicators, like the Relative Strength Index (RSI), can be useful tools, if applied cautiously. Divergence between price and momentum can signal weakening pressure, hinting at a potential reversal. However, relying solely on momentum indicators without considering the underlying supply and demand dynamics can be misleading.
Understanding market structure, such as identifying higher highs and lower lows, provides a broader context for your decisions. It helps you see where your supply and demand zones fit within the overall market, leading to a more complete understanding of market conditions.
Maintaining Strategy Integrity
The key to integrating additional techniques is to uphold the integrity of your supply and demand strategy. These additions should complement, not replace, your core analysis. Focus on using them to validate your zones and filter out weaker setups. This ensures your trading decisions are rooted in the fundamental principles of supply and demand, while still benefiting from other analytical insights.
To help illustrate how this integrated approach can play out across different markets, let’s look at a statistical breakdown. The following table showcases performance metrics based on market type, offering insights into how adjustments can be made for optimal results.
Here’s a statistical breakdown of strategy performance across different market instruments and conditions.
| Market Type | Win Rate | Average R:R Ratio | Best Timeframes | Key Adjustments |
|---|---|---|---|---|
| Stocks | 65% | 1:2 | Daily, Weekly | Focus on earnings reports and news catalysts |
| Forex | 70% | 1:1.5 | 4-Hour, Daily | Account for major economic releases |
| Futures | 60% | 1:2.5 | Daily | Pay attention to seasonality and contract expirations |
This table reveals that while the win rate is relatively consistent across different market types, the average R:R ratio and best timeframes can vary. This underscores the importance of adapting your approach and making key adjustments based on the specific market you’re trading. By analyzing these metrics, you can tailor your strategy for optimal performance in each market.
Avoiding the Traps That Derail Supply and Demand Traders
Successfully implementing a supply and demand trading strategy involves more than simply spotting zones on a chart. It takes discipline, patience, and a sharp understanding of potential pitfalls. This section explores common challenges that can throw traders off course and offers practical guidance for overcoming these obstacles.
The Psychological Hurdle of Contrarian Trading
Supply and demand trading frequently requires taking positions that go against the current market sentiment. Buying when everyone else is selling, or selling when others are buying, can be psychologically tough. This is where truly understanding your market becomes essential. The crucial factor is maintaining conviction in your analysis, even when the market appears to disagree. Building this conviction requires trust in your strategy, cultivated through consistent practice and careful analysis. Concentrate on the long-term potential of each trade, rather than getting sidetracked by short-term market fluctuations.
Navigating Zone Saturation
In active markets, certain zones can become saturated with traders expecting reversals. This can weaken a zone’s effectiveness, resulting in false breakouts or weak price reactions. To avoid this trap, prioritize fresh zones that haven’t seen extensive trading activity. These often present superior opportunities compared to over-traded zones. Consider using multiple timeframe analysis to find zones that align on different charts, bolstering their reliability.
Recognizing Manipulation and Fundamental Influences
Sometimes, institutional traders might intentionally manipulate obvious zones to catch less experienced traders off guard. They could create a false breakout, triggering stop-loss orders before moving the price in their intended direction. Watch for unusually high volume spikes during these breakouts – a possible indication of manipulation.
Fundamental factors can also sometimes override technical patterns, even within strong supply and demand zones. Unexpected news or economic reports can shift market sentiment and cause a zone to fail. Keeping up with relevant news and economic events can help you anticipate potential disruptions to your technical analysis.
Overtrading and Confluent Zones
Overtrading, driven by the urge to always be in a trade, can lead to hasty decisions and diminished profits. Adhere to your trading plan and only take trades that meet your predetermined criteria. This requires patience and discipline, but ultimately yields better long-term results.
When multiple zones converge at similar price levels, they create confluent zones. These areas can present powerful trading opportunities, but demand careful analysis. Identify the strongest zone within the confluence, focusing on those with the largest historical price reactions and most significant volume. This helps pinpoint the most likely reversal point.
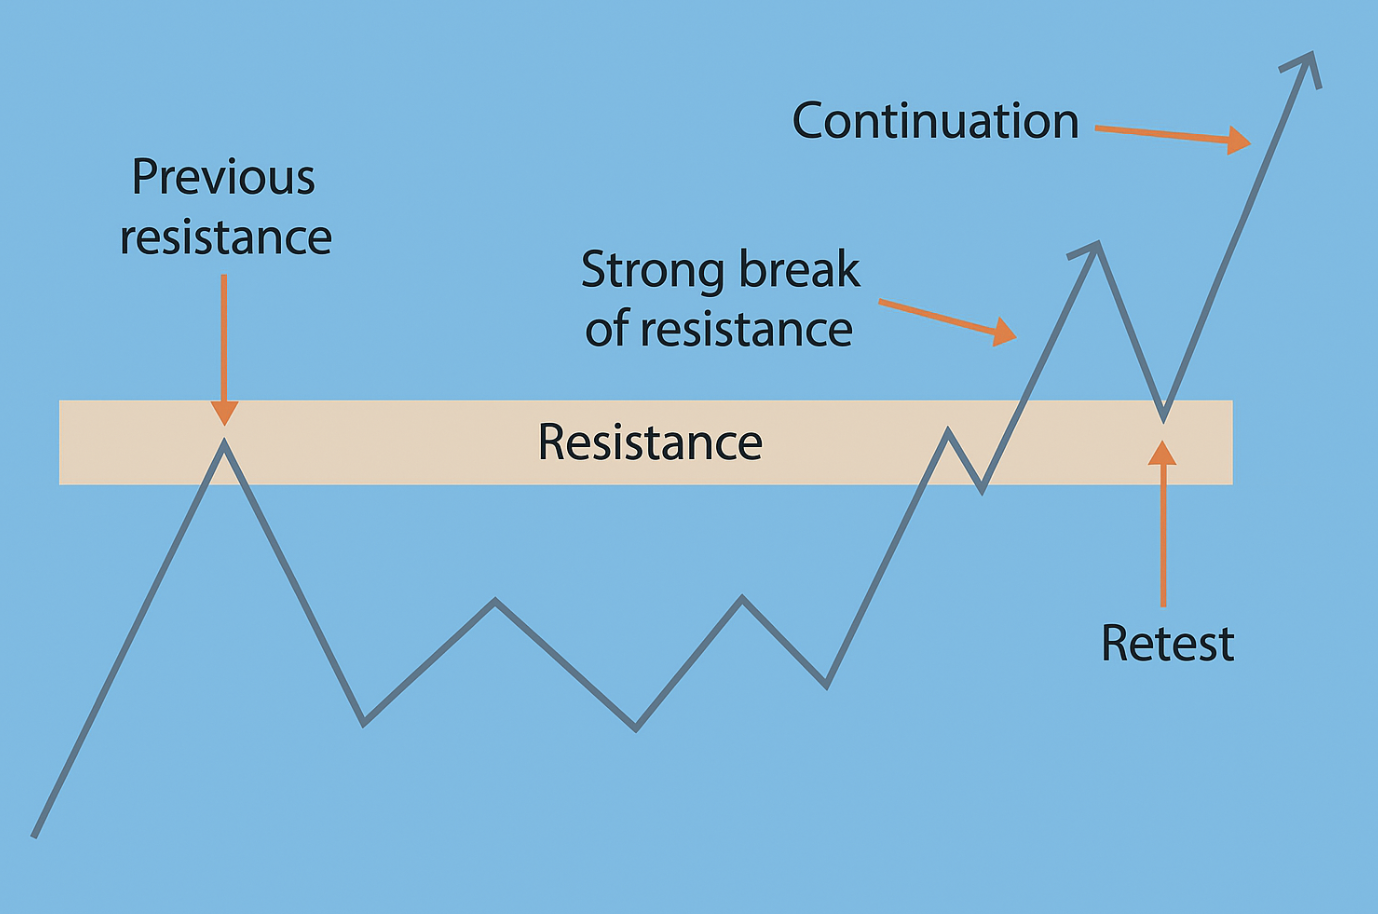
Differentiating Retests and Failures
A retest occurs when the price revisits a zone after an initial move away, confirming its strength. A failure occurs when the price decisively breaks through a zone, signaling a shift in supply and demand dynamics. Distinguishing between these two scenarios is essential.
Look for strong volume and momentum during the break to confirm a failure. Conversely, weak volume and hesitant price action during a retest often signal a favorable entry opportunity.
By understanding these common pitfalls and applying the strategies outlined, you can significantly improve your success with supply and demand trading. This will not only enhance your trading results but also build confidence in your approach.
Elevating Your Supply and Demand Trading to a Professional Level
Moving beyond the basics of supply and demand trading requires a nuanced understanding of what sets consistently profitable traders apart. This involves identifying genuine institutional supply and demand zones, the areas where large financial institutions accumulate and distribute assets. This article will explore advanced techniques to refine your approach and help you capitalize on high-probability trading opportunities.
Identifying Trapped Traders
Professional traders often look for scenarios where less experienced traders become trapped within a zone. This often occurs when the price breaks through a zone, triggering stop-loss orders, only to quickly reverse. This reversal creates a “squeeze” as trapped traders are forced to exit their positions, accelerating the price move. Recognizing these patterns is key to capitalizing on volatile price swings.
Multi-Timeframe Zone Confluence
Analyzing zones across multiple timeframes increases the probability of pinpointing strong reversal points. When a zone on a higher timeframe aligns with a zone on a lower timeframe, it creates a confluent zone. This confluence often signals a significant imbalance between supply and demand, leading to stronger price reactions. This multi-timeframe approach adds another layer of confirmation to your trading strategy.
For example, a demand zone on a daily chart that coincides with a demand zone on a 4-hour chart presents a higher-probability long entry than a demand zone appearing only on the 4-hour chart. This is because the confluence suggests agreement between short-term and long-term buyers, increasing the likelihood of a sustained upward movement.
Zone Refreshment and Order Flow Analysis
Zone refreshment happens when the price revisits and bounces off a zone after a period of consolidation or a move away. This reaffirms the zone’s strength, often setting up excellent trading opportunities. For example, a demand zone retested after consolidation, with the price bouncing sharply off the zone’s lower boundary, is considered refreshed.
Order flow analysis, which examines the actual buying and selling activity at key levels, provides deeper insights into a zone’s strength. A high volume of buy orders within a demand zone suggests strong institutional accumulation, increasing the likelihood of a sustained upward move. While not always readily available to retail traders, understanding order flow’s value enhances your awareness of market mechanics.
Quantifying Zone Strength
While visually assessing zones is helpful, using quantifiable measures significantly improves objectivity. Factors to consider include the magnitude of the price reversal creating the zone, the volume associated with the reversal, and the time elapsed since the zone formed.
A zone formed by a large price reversal with high volume is generally stronger than one formed by a small reversal with low volume. More recent zones are also typically considered more relevant than older ones.
| Factor | Strong Zone | Weak Zone |
|---|---|---|
| Price Reversal | Large, sharp reversal | Small, insignificant reversal |
| Volume | High volume | Low volume |
| Recency | Recent formation | Older formation |
This table summarizes how these factors contribute to zone strength. Using these quantifiable measures allows for a more objective approach to supply and demand trading, lessening reliance on subjective interpretation. Combining these metrics with visual analysis creates a more robust trading framework.
By incorporating these advanced techniques – identifying trapped traders, analyzing multi-timeframe confluence, understanding zone refreshment and order flow, and quantifying zone strength – you can substantially improve your supply and demand trading strategy. These principles empower you to identify higher-probability setups and navigate market complexities with greater precision. Improve your trading with the Ultimate Supply and Demand Strategy