Pin Bar Candlestick Strategies to Win More Trades

The Anatomy of a Powerful Pin Bar Candlestick
A pin bar candlestick is a valuable tool for traders, but understanding its structure is essential for effective use. This distinctive candlestick pattern, marked by a long wick and small body, provides clues about potential market reversals. Let’s explore the key components that separate a high-probability pin bar from a less reliable one.
The Wick (or Shadow): A Story of Rejection
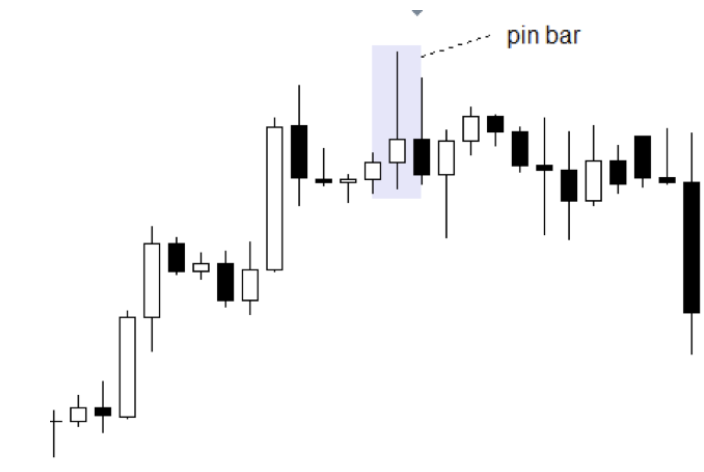
The most noticeable feature of a pin bar is its elongated wick, also known as a shadow. This extended wick signals price rejection. A long upper wick shows buyers pushing the price higher, only to be met by selling pressure that drives the price down. Conversely, a long lower wick means sellers initially controlled the price, only to have buyers take over and push the price back up. The wick’s length is crucial. Wicks at least two to three times the length of the candle body are considered more significant. This price swing shows a battle between buyers and sellers.
The Body: A Glimpse of Momentum
The wick tells the story of rejection, but the pin bar’s small body hints at prevailing momentum. A small body indicates indecision after the initial price rejection. Its color provides additional information. A green (or white) body after a long lower wick strengthens a bullish signal. A red (or black) body after a long upper wick reinforces a bearish indication.
Context is Key: Support and Resistance
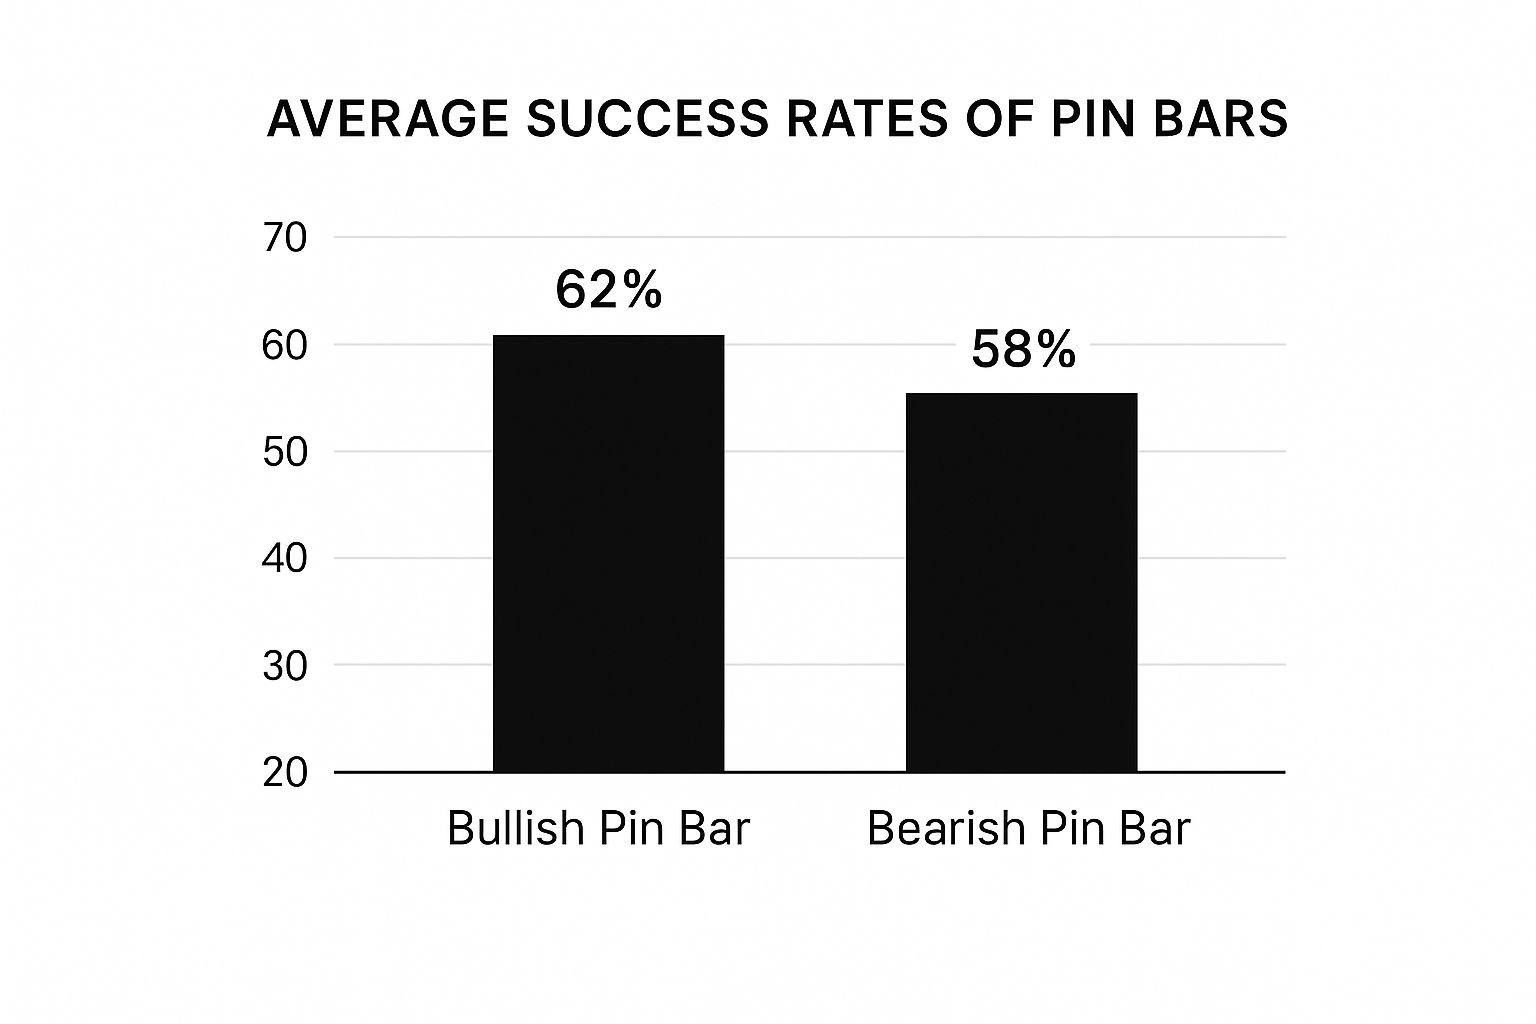
Identifying a well-formed pin bar is only the first step. A pin bar’s strength lies in its context within the overall market. Pin bars near key support and resistance levels, trendlines, or moving averages carry more weight. For example, a bullish pin bar at a support level suggests the price could bounce. Conversely, a bearish pin bar at a resistance zone hints at a potential downward reversal. The pin bar candlestick pattern, gaining popularity in the early 2000s, has become a key aspect of price action trading. Studies show that pin bars combined with support and resistance can have a directional accuracy of 58-65% in major forex pairs. On daily charts, pin bars with tails exceeding two or three times the body show even higher reliability, particularly when entering at the wick’s 50% retracement level, helping filter false signals.

Bullish vs. Bearish Pin Bars: Two Sides of the Same Coin
Bullish and bearish pin bars have distinct features, though the underlying principles remain the same. Bullish pin bars, with long lower wicks, signal lower price rejection, suggesting buying opportunities, especially in downtrends or near support. Bearish pin bars, with long upper wicks, represent rejection of higher prices, indicating selling opportunities in uptrends or around resistance.
By understanding these nuances, you can distinguish between strong and weak pin bar signals. The relationship between wick length, body size, and market context allows you to use the pin bar to identify high-probability trading setups. This leads to improved market analysis and better trading decisions.
Inside The Psychology Driving Pin Bar Formations

Understanding the anatomy of a pin bar candlestick is just the first step. To truly grasp its power, we need to explore the market psychology behind it. These patterns aren’t random; they reflect the interplay of market forces, often a tug-of-war between smart money (institutional traders) and retail traders.
Imagine a bullish pin bar appearing at a support level. This isn’t just a price blip. It often suggests institutional buyers stepping in, scooping up discounted assets from exiting retail traders. The long lower wick visually represents this absorption of selling orders. Pin bars offer a peek into the actions of significant market players.
Decoding The Long Wick
The defining feature of a pin bar is its long wick. This wick tells a story of rejection. A long upper wick shows buyers pushing prices up, only to be met by a wave of sellers. This often indicates a failed breakout, where the market tested resistance but lacked the strength to continue. Conversely, a long lower wick suggests strong buying overcoming initial selling pressure.
The wick can also reveal insights into institutional order flow. A bearish pin bar at resistance might indicate institutional selling into a rally, capitalizing on retail buyer enthusiasm. Recognizing these patterns provides a deeper understanding of market dynamics.
Identifying Absorption and Rejection
Pin bars often mark turning points. They can signal exhaustion, where one side loses momentum, or rejection at a significant price level. A bullish pin bar at a downtrend’s bottom could show weakening selling pressure, hinting at a potential reversal. A bearish pin bar after a rally might signal rejection of higher prices.
A 2022 study comparing candlestick patterns showed pin bars’ consistent effectiveness across markets, highlighting their universal psychological basis. Nikkei 225 index futures saw a 60% reversal rate for daily pin bars at 52-week highs/lows. European DAX pin bars at moving average confluence zones showed a 63-68% success rate. The psychology behind the pattern – failed breakouts and institutional order flow – remains universally relevant.
Not all pin bars are equal. Market context is critical. A pin bar within a ranging market has less significance than one at a key support or resistance level. Understanding this context helps distinguish high-probability setups from false signals.
High-Probability Pin Bar Trading Strategies That Work
Now that we understand the psychology behind pin bar candlestick formations, let’s discuss how to use them in actionable trading strategies. This means going beyond simply identifying the pin bars. We’ll explore how professional traders use these formations for consistent profits. This involves mastering key techniques like the 50% retracement entry, understanding confluence factors, and using sound position sizing methods.
The 50% Retracement Entry: Maximizing Your Edge
Trading pin bar candlesticks can be highly effective using the 50% retracement entry technique. This approach substantially improves your risk-reward ratio. Imagine a bullish pin bar with a long lower wick. You’d place your buy order at the price halfway between the wick’s low and the candle’s close. This allows traders to enter at better prices, minimizing risk and maximizing potential profits.
Confluence Factors: Boosting Your Success Rate
Pin bars are valuable signals on their own. However, combining them with other indicators, known as confluence factors, can significantly increase your success rate.
- Support and Resistance Levels: Pin bars at established support or resistance zones are much more reliable.
- Trendlines: Confirmation from a pin bar during a trendline break or bounce strengthens the signal.
- Moving Averages: Pin bars aligning with key moving averages (like the 50-day or 200-day) boost the pattern’s validity.
- Fibonacci Retracement Levels: Pin bars at important Fibonacci levels (especially 61.8% or 78.6%) often offer high-probability setups.
By looking for these confluence factors, you filter out less promising setups and focus on those with a higher likelihood of success.
Position Sizing: Protecting Your Capital
Even with a high probability of success, proper position sizing is vital for long-term trading. This involves determining the appropriate capital to risk per trade. Consider your total account size and your risk tolerance. Oversizing can lead to significant losses, even with frequent wins. A good rule is to risk no more than 1-2% of your trading capital on any single trade.
Trading Strategies: Reversal vs. Continuation
Pin bars can be used in both counter-trend reversal strategies and trend continuation strategies.
- Reversal Strategies: Trade against the current trend. A bullish pin bar at the bottom of a downtrend can signal a potential upward reversal.
- Continuation Strategies: Trade with the prevailing trend. A bullish pin bar after a pullback in an uptrend might signal continued upward movement.
To help illustrate the performance differences, the table below compares reversal and continuation strategies using data from Colibri Trader’s analysis of major currency pairs on the 4-hour timeframe:
| Strategy Type | Best Timeframes | Success Rate | Risk-Reward Ratio | Best Market Conditions | Key Confluence Factors |
|---|---|---|---|---|---|
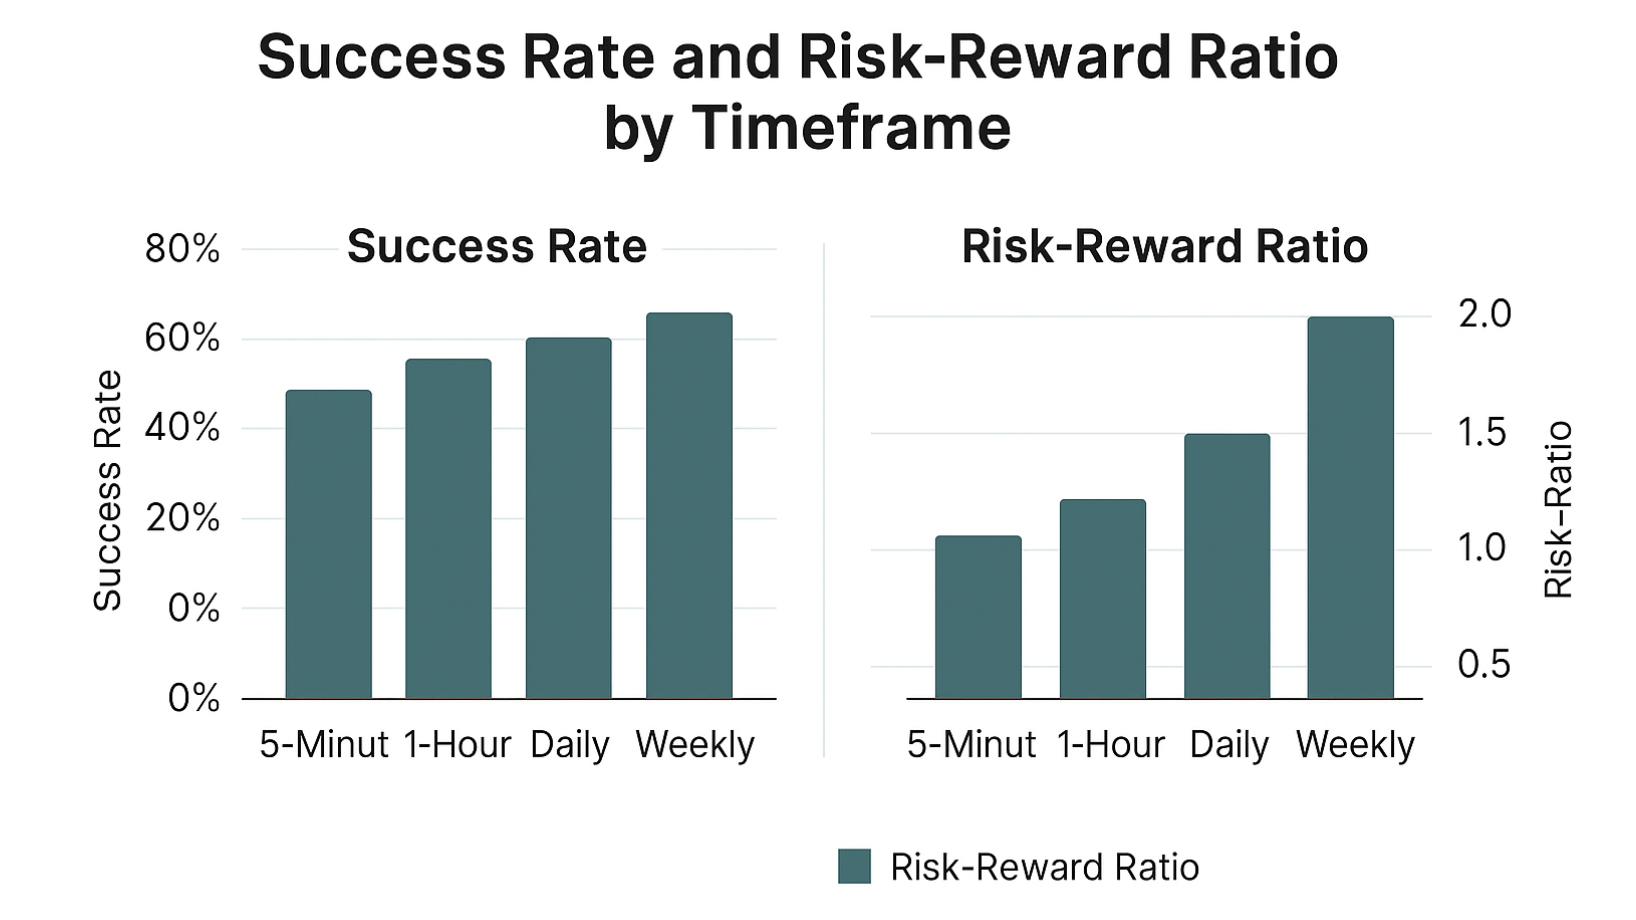
| Reversal (Counter-Trend) | 4H, Daily | 62% | 1:2 or better | Trending Markets | Support/Resistance, Trendlines, Fibonacci |
| Continuation (With-Trend) | 1H, 4H | 70% | 1:1.5 | Strong Trends | Moving Averages, Trendlines |
The following data chart visualizes the success rate and risk-reward ratio for both strategies. Continuation strategies show a slightly higher success rate, while reversal strategies often present better risk-reward scenarios. 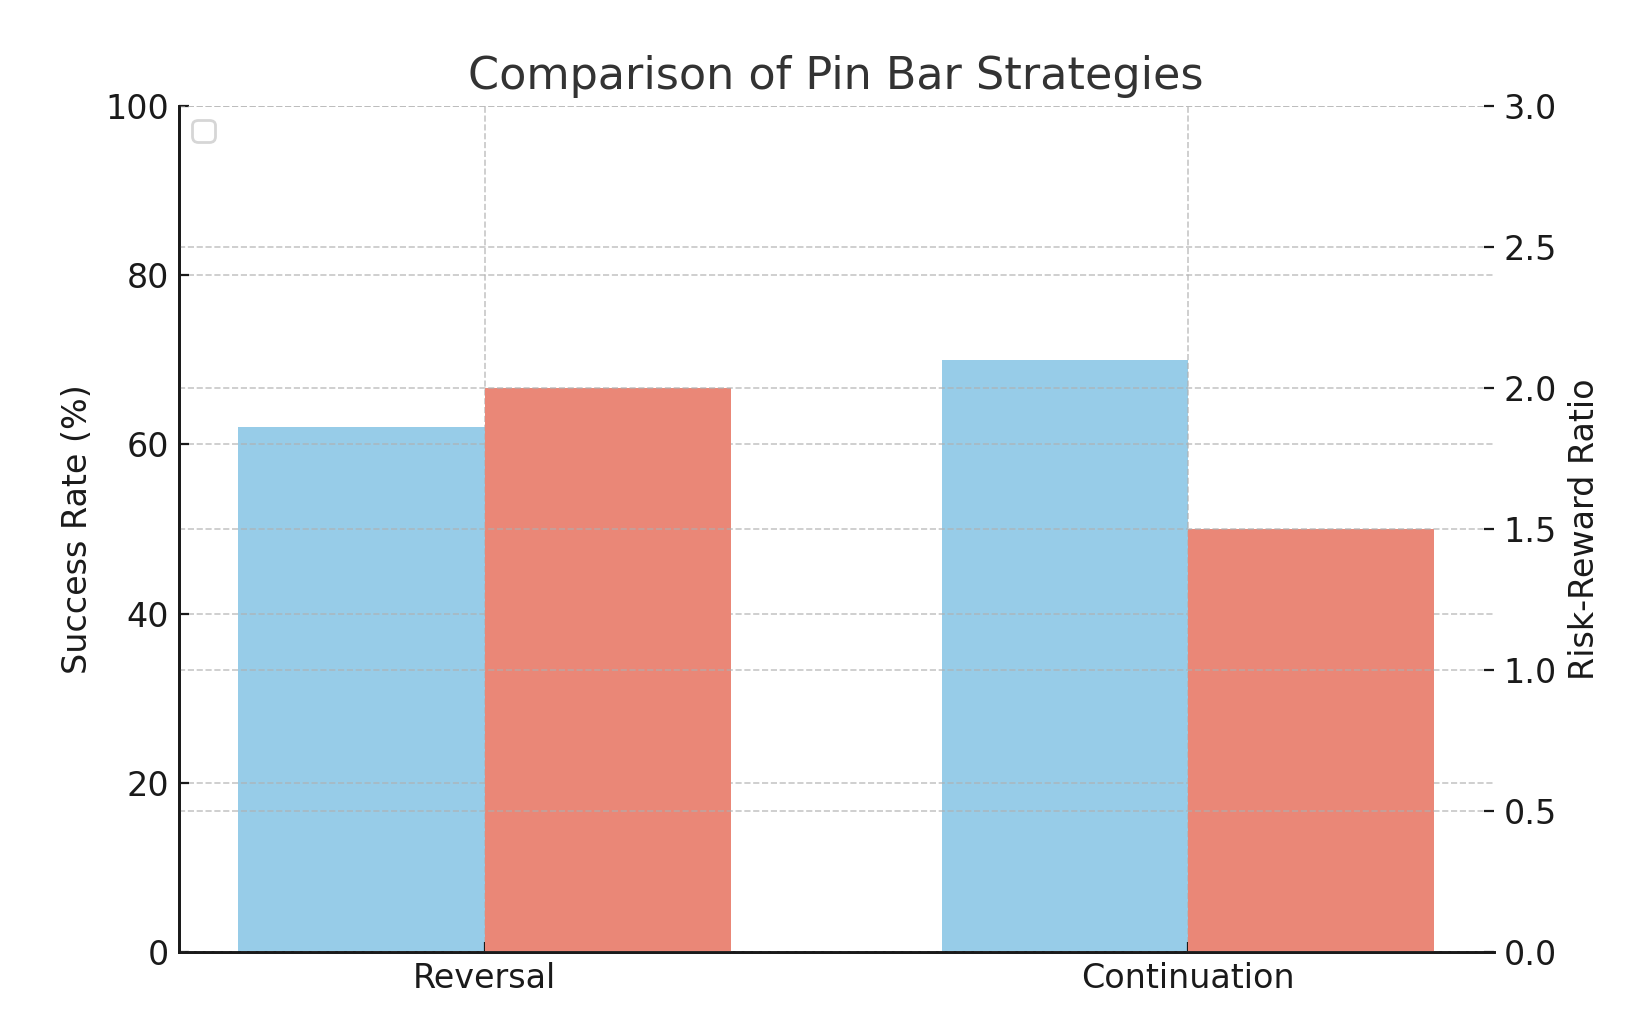
As the chart shows, with-trend trades boast a 70% win rate compared to 62% for counter-trend trades. However, reversal trades often offer a 1:2 risk-reward ratio or better, meaning profits can be double the potential losses.
Understanding these strategies and their performance is crucial for adapting to different market conditions. Choosing the right strategy based on the current market is essential for consistently profitable pin bar trading.
Finding the Perfect Market Context for Pin Bar Trades

Not all pin bar candlesticks are created equal. Identifying the right context is key to success in trading. This section unveils the market environments where pin bar patterns deliver their strongest signals. Just as a salesperson needs to understand their customer, a trader must understand the market.
Support and Resistance: The Trading Battleground
Pin bars become particularly interesting when they appear at key support and resistance levels. These zones represent price points where significant buying and selling activity has historically occurred. A bullish pin bar forming at support may indicate buyers overpowering sellers, potentially signaling a reversal upwards. Conversely, a bearish pin bar at resistance might suggest sellers gaining control, hinting at a potential downturn.
Trendlines: Riding the Market’s Current
Trendlines serve as dynamic support and resistance, guiding the market’s overall direction. Pin bars that align with these trendlines can strengthen the signal. A bullish pin bar bouncing off an upward trendline, for instance, provides extra confirmation for a long trade. This confluence of signals can increase the probability of a successful trade.
Moving Averages: Smoothing Out the Noise
Moving averages help filter out price fluctuations, highlighting the underlying trend. Moving Averages act as a smoothing mechanism, making it easier to discern the prevailing market direction. Pin bar candlesticks appearing near key moving averages, such as the 50-day or 200-day Exponential Moving Average (EMA), lend additional weight to the signal.
Fibonacci Retracements: The Golden Ratio in Trading
Fibonacci retracement levels identify potential areas where prices might pull back before resuming their trend. Pin bars appearing at these levels, especially the 61.8% retracement, can present high-probability setups. These levels are based on the Fibonacci sequence, a mathematical concept found in various aspects of nature and often applied to financial markets.
Trending vs. Ranging Markets: Know the Difference
Pin bar interpretations differ between trending and ranging markets. In a strong trend, pin bars frequently signal continuations after pullbacks. However, in ranging markets, pin bars can be less reliable due to the back-and-forth price action. Understanding the current market state is critical for accurate pin bar analysis.
Volatility: The Double-Edged Sword
Volatility significantly influences how you interpret pin bars. High volatility can create exaggerated wicks, potentially leading to false signals. Conversely, lower volatility often produces more reliable pin bar setups. Backtesting by FXOpen between 2015-2020 showed pin bars at key psychological levels (like 1.2000 in EUR/USD) had a 15-20% higher success rate than those in ranging markets. The 2020 market crash saw a surge in valid pin bar formations, particularly in crude oil futures.
Developing a Framework: Your Pin Bar Checklist
By considering these elements, traders can create a framework for evaluating market context and identifying promising pin bar opportunities. This structured approach can help filter out noise, minimize false signals, and ultimately improve trading outcomes. Your checklist might include analyzing price action against support and resistance, checking alignment with trendlines or moving averages, and assessing current market volatility.
Mastering Pin Bars Across Multiple Timeframes
The same pin bar candlestick pattern can produce vastly different outcomes depending on the timeframe you analyze. This means traders must adapt their approach based on whether they’re scalping the 5-minute chart, day trading the hourly chart, or swing trading daily or weekly setups. This section explores how to tailor your pin bar strategy for optimal results.
Timeframe Selection and Trading Style
Different timeframes align with various trading styles and preferences. A fast-paced scalper, seeking quick profits from small price fluctuations, might focus on the 5-minute or 15-minute charts.
A swing trader, aiming to capture larger price swings over days or weeks, would likely analyze daily or weekly charts. The key is to find the timeframe that best suits your trading personality and risk tolerance.
Multiple Timeframe Analysis: Filtering Out Noise
Many professional traders use multiple timeframe analysis to confirm pin bar signals. This involves checking higher timeframes for confluence with the pin bar identified on a lower timeframe.
For example, a bullish pin bar on a 1-hour chart gains additional strength if it coincides with a support level on the daily chart. This approach helps filter out low-quality setups and improves the probability of a winning trade.
Specific Adjustments for Each Horizon
Each timeframe requires specific adjustments. On lower timeframes, pin bars appear more frequently, but are also susceptible to market noise. Stricter filtering criteria, such as increasing trading volume or confirmation from other technical patterns, become essential.
On higher timeframes, pin bars are less common, but often signal more significant price moves. This affects your stop-loss and take-profit placement.
To illustrate the varying performance characteristics across different timeframes, let’s look at the table below:
Pin Bar Performance By Timeframe
This table presents statistical data on pin bar effectiveness across different chart timeframes
| Timeframe | Average Success Rate | False Signal Frequency | Typical Risk-Reward | Recommended Markets | Key Considerations |
|---|---|---|---|---|---|
| 5-Minute | 60% | High | 1:1 to 1:2 | Forex, Indices | Prone to noise, requires quick execution |
| 1-Hour | 65% | Medium | 1:2 to 1:3 | Forex, Commodities | Better balance between noise and signal |
| Daily | 70% | Low | 1:3 to 1:5 | Stocks, Futures | Strong signals, but less frequent |
| Weekly | 75% | Very Low | 1:5+ | Stocks, ETFs | Requires significant patience |
As you can see, the success rate generally improves on higher timeframes, while the frequency of false signals decreases. This reinforces the importance of adapting your strategy to the chosen timeframe.
Matching Timeframes to Trading Goals
Understanding how certain timeframes match particular trading goals and account sizes is essential. Smaller accounts might benefit from shorter-term timeframes, allowing for quicker compounding. Larger accounts might be better suited for longer-term swing trades on higher timeframes.
Examples of Timeframe Adaptation
- Scalping (5-Minute Chart): A scalper might look for a bullish pin bar at a support level on the 5-minute chart, entering long with a tight stop-loss below the pin bar’s low. Their target might be a small profit of a few pips.
- Day Trading (1-Hour Chart): A day trader might seek a bearish pin bar near resistance on the 1-hour chart. Their stop-loss would be above the pin bar’s high, and their profit target might be based on a recent support level. They might also use tools like TradingView for charting and analysis.
- Swing Trading (Daily Chart): A swing trader might identify a bullish pin bar at a significant support level on the daily chart. They would use a wider stop-loss and a profit target based on a key resistance level or a measured move calculated using Fibonacci extensions.
By mastering pin bars across multiple timeframes, you create a flexible trading approach tailored to your goals and market conditions. You gain the ability to approach markets from different perspectives, giving you an advantage in reading price action.
Avoiding the Pin Bar Mistakes That Cost Traders Money

The pin bar candlestick pattern seems straightforward. Yet, profitability eludes many traders. Why? Often, it’s due to subtle but significant errors that can decimate trading accounts. Let’s uncover these common pitfalls and learn how to sidestep them, turning potential losses into consistent gains.
Confirmation Bias: Seeing What You Want
A major stumbling block is confirmation bias. After a series of losses, traders may desperately seek a winning trade. This can lead to misinterpreting any long-wick candle as a pin bar, disregarding crucial factors like body size or market context. A long-wicked candle in a ranging market isn’t necessarily a true pin bar.
The solution? Adhere strictly to the criteria of a valid pin bar candlestick. Remember: a small body and a wick at least two to three times the body’s length are essential. This disciplined approach minimizes wishful thinking and grounds your trades in reality.
Improper Risk Management: Over-Leveraging
Even accurate pin bar identification can’t overcome poor risk management. Oversizing positions, risking too much capital on one trade, is a recipe for disaster. Even a high win rate won’t save you.
Remember the 1-2% rule: limit the risk on any single trade to 1-2% of your account balance. This safeguards your capital during inevitable losing streaks. Always set a stop-loss order below the low (bullish pin bars) or above the high (bearish pin bars) of the pin bar. This contains potential losses and protects your capital.
Chasing Perfection: Missing Opportunities
The pursuit of the “perfect” pin bar setup traps many traders. While confluence factors improve trade probability, waiting for every indicator to align can mean missed opportunities. A solid pin bar candlestick at key support or resistance often provides a sufficient trading edge. Don’t over-analyze. Focus on high-probability setups.
Lack of Discipline: Abandoning the System
Trading psychology significantly impacts pin bar success. Many traders abandon their system after a few losses, questioning its effectiveness. But all strategies, even the best, have drawdowns. Consistency and discipline are key. Trust your backtested strategy. Maintain your trading plan.
Keeping a trading journal tracks progress and highlights areas for improvement. This promotes objective trade review and allows you to refine your approach.
Ignoring Market Context: The Big Picture
Pin bars aren’t isolated events. Analyze them within the broader market context. A bearish pin bar in a strong uptrend might just be a minor pullback, not a reversal.
Consider the overall trend, support and resistance zones, and other indicators. Understanding market structure helps you interpret pin bar signals effectively. Analyze higher timeframes for confluence or confirm signals using tools like volume analysis.
Advanced Pin Bar Techniques for Exceptional Results
Identifying basic pin bar candlestick patterns is a solid foundation. However, to truly excel, traders need to incorporate more advanced techniques. This section explores the strategies used by seasoned professionals to maximize their advantage when trading these formations.
Combining Pin Bars with Order Flow Analysis
Understanding order flow can give you a glimpse into future market movements. Order flow analysis reveals the real-time buying and selling pressure at different price levels. It offers a window into the activities of large institutional traders.
A bullish pin bar at a support level becomes even more promising if it coincides with a surge in buy orders. This combination suggests strong price rejection at a key level and active accumulation by institutional buyers. Conversely, a bearish pin bar at resistance with heavy selling pressure reinforces the potential for a downturn. Order flow adds a crucial layer of confirmation, enhancing the timing and precision of your entries.
Advanced Filtering with Market Internals and Volatility
Market internals and volatility offer valuable filters for refining your pin bar trades. Market internals, such as the advance-decline line or the new high-new low ratio, provide insights into overall market health. Trading pin bars in a strong market, characterized by positive internals, improves your odds of success.
Volatility plays a significant role as well. High volatility can create distorted pin bar formations and false signals. Low volatility, on the other hand, often produces more reliable setups. A pin bar appearing during decreasing volatility may signal a trend change with increased accuracy.
Compound Signal Strategies
While pin bars are effective standalone signals, combining them with other indicators creates even stronger setups. These compound signal strategies look for confluence with tools like moving averages, trendlines, or Fibonacci retracement levels. A bullish pin bar at support, aligning with a trendline bounce and a bullish moving average crossover, presents a particularly compelling opportunity.
Professional Position Management: Scaling, Runners, and Dynamic Stops
Professional position management is key to maximizing profits. Scaling in allows you to gradually increase your position size as a trade moves in your favor. Recognizing runners, or trades with sustained momentum, lets you ride the wave of extended moves. Dynamic stop adjustments, like trailing stops, protect profits and mitigate losses from sudden reversals.
Case Studies: Applying Advanced Techniques
Let’s illustrate these advanced techniques with practical scenarios. Imagine a bullish pin bar forming on the daily chart of a large-cap stock at a major support level. Order flow reveals strong institutional buying, market internals are positive, and volatility is declining. This confluence paints a compelling picture of a potential uptrend.
Alternatively, consider a bearish pin bar on a 4-hour forex chart at a resistance zone. Heavy selling pressure, confirmed by order flow, along with bearish market internals, increases the probability of a downward move.
By integrating these advanced techniques with thorough market analysis, you can develop a nuanced understanding of pin bars. You can start from our Price Action Swing Trading Course HERE