


Trading With Momentum – Price Action Trading Guide for Beginners
Trading With Momentum – Price Action Trading Guide for Beginners
Momentum is a unique indicator in the world of technical analysis. Its simplicity makes it a close replica to price action, and traders around the world find it useful.
But its simplicity is its worst enemy too. Because of the simple way to calculate its values, many traders ignore it.
As I will show you in this article, that’s a terrible mistake. Price action trading has a powerful ally, as trading with Momentum gives incredible insights into the future price levels.
>>CHECK OUT MY TRADING STRATEGY
The Momentum indicator is a source of incredible trading setups. Either scalper, swing trader or investor, it suits all trading styles as it has one important attribute: it doesn’t repaint.
Repainting in technical analysis refers to an oscillator or trend indicator changing its past values based on what the current price does. That’ll make it impossible to back-test a strategy, as the indicator suddenly becomes useless.
Fortunately, that’s not the case with the Momentum indicator. In fact, it is a remarkable oscillator that shows both continuation and reversal conditions. How often can an oscillator boast with such an attribute?
We’ll cover the way the Momentum oscillator is built, but we’ll mostly expand on how trading with Momentum helps price action traders. In the end, the Momentum trading strategies presented here will make one wonder how come such a powerful indicator exists.
Explaining the Momentum Oscillator
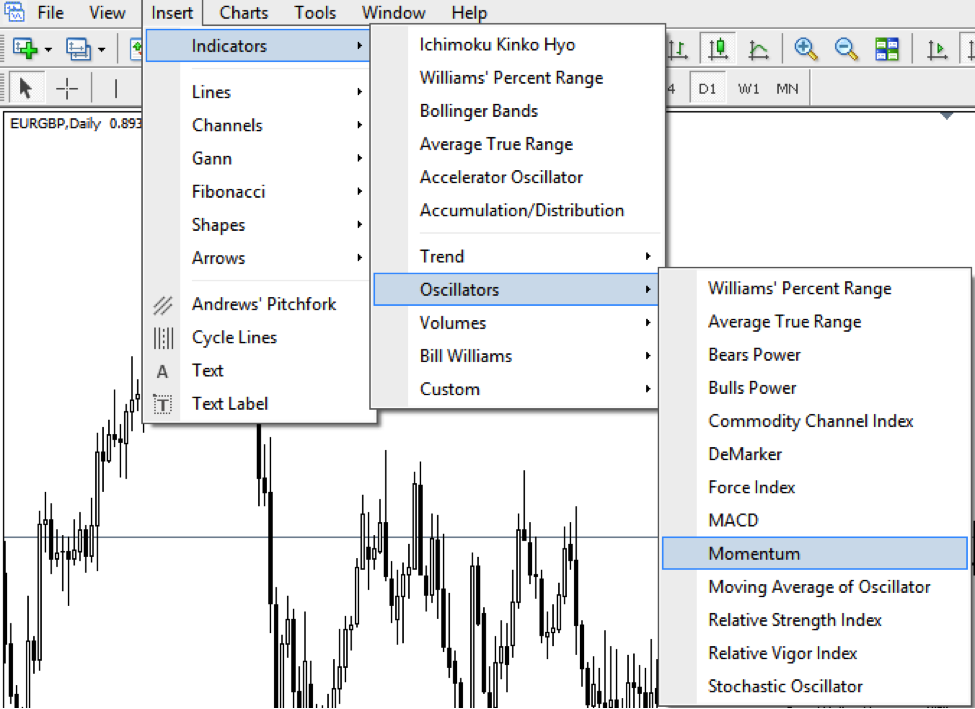
Also called the speed of movement indicator, the Momentum is an oscillator that appears at the bottom of a chart. The MT4 trading platform offers it with the default settings, under the Indicators and Oscillators category.
The Momentum indicator shows the difference between today’s closing price and the closing price on a specific date back in time. The default period used is the 14, and the MT4 uses a version of the Momentum oscillator that compares the values with the 100 level.
Hence, we can say that the 100 level is decisive in the Momentum’s interpretation. In fact, it splits the price action into bullish and bearish.
The chart below shows the GBPUSD daily timeframe, with the blue line representing the Momentum oscillator. As you can see, the 100 level is the pivotal one in Momentum’s interpretation, showing the overall market conditions.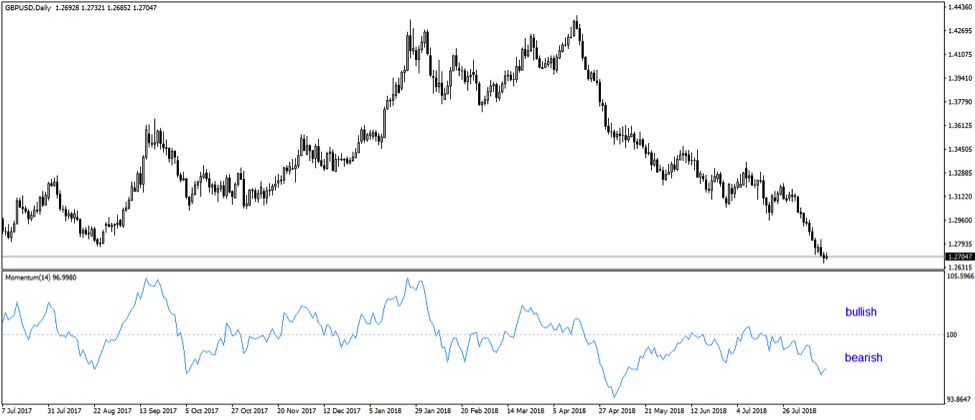
Trading with Momentum can be as simple as buying and selling the 100-line cross. However, a simplistic approach like this won’t get you far away, as the market often crosses the line up and down without much of a traction.
You can consider the 100 level is the bull/bear line. But, it also acts as a volatility indicator.
 More precisely, the further the Momentum goes from the 100 line, the higher the market volatility is… and, the stronger the trend becomes.
When the market pauses after London or New York sessions end, the price action stalls. Consolidation begins, and Momentum will slowly come to its neutral stance – the 100 level.
As the price action picks up, the Momentum will too, either above the 100, in bullish territory, or below, in bearish area.
Trading with Momentum is a fine balancing act of interpreting the 100 level.
Strategies for Trading with Momentum
Trading with Momentum follows the rules of trading with an oscillator. They are valued mostly for the divergences they show.
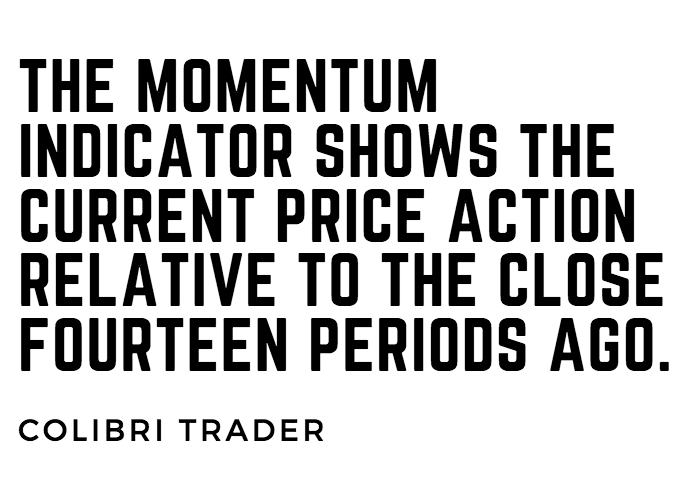
Almost all oscillators have an overbought and oversold area. Traders buy in oversold and sell in overbought. However, that’s not the case with the Momentum indicator, as it merely shows the current price action relative to the closing fourteen periods ago.
But the Momentum has other qualities, too. Since it reflects the market price action and splits it into bullish and bearish periods, it can be used both as a trend-following and a reversal indicator.
Higher Highs and Lower Lows with the Momentum Indicator
The same GBPUSD daily timeframe is ideal for illustrating how to ride a trend with the Momentum indicator.
A bullish trend is defined by a series of higher highs and higher lows. For as long as it keeps doing that, the price will continue to rise. Fading the trend makes no sense.
The beauty of an oscillator is that traders use it to discount the price movement. For instance, one of the two (actual price or the oscillator) is poised to make a false move.
Because the oscillator uses past price action to plot current values, traders trust the oscillator’s move more than the actual price. That’s especially true when the oscillator and the price are so similar.
Therefore, the rules of a trend applied to pure price action work just as well (or even better) when applied to the oscillator. Hence, instead of focusing on the price action to form a series of higher highs and higher lows, the attention shifts to the Momentum oscillator.
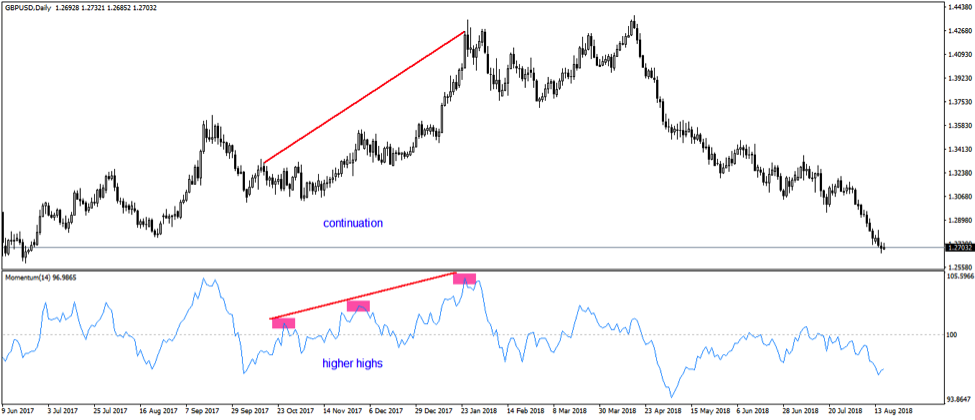
The chart above shows how Momentum rises above the 100 mark. Next, it forms a series of higher highs, while, in the meantime, the 100 level acts as the natural pullback in a rising trend. In other words, it shows continuation.
Trend Trading with Momentum is a great way to profit from the strongest trends in the market.
A trading strategy would work on all timeframes and currency pairs.
Divergences with Momentum
Oscillators aren’t meant to show trending conditions. Instead, traders look at differences between the price and the oscillator.
Called divergences, they form mostly right before significant tops and bottoms. Hence, trading tops and bottoms with Momentum implies trading divergences.
Higher highs and lower lows play an essential role here too. The idea is to stick with the Momentum oscillator when interpreting the price action.
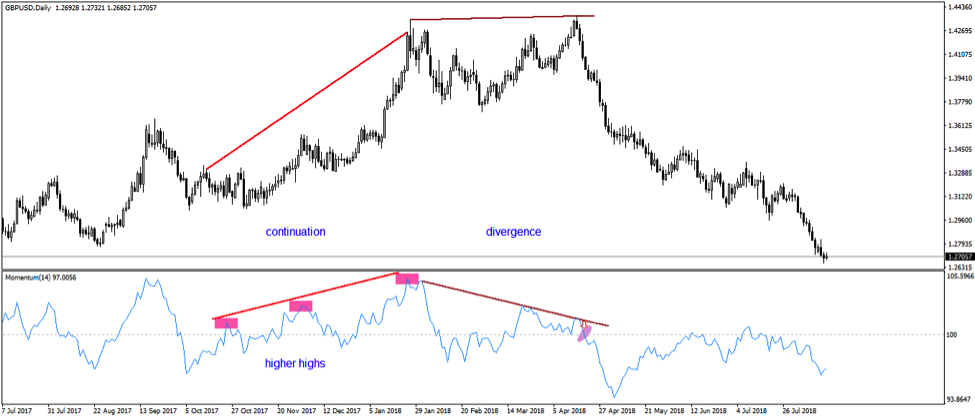
After the Momentum indicator showed trending conditions on the daily GBPUSD chart, the price made two consecutive higher highs. However, the Momentum indicator didn’t confirm the second high, showing a divergence.
Trading with Momentum divergences means selling after a bearish divergence and buying after a bullish one. But, not at all costs!
For instance, the chart above shows a bearish divergence. However, the entry should be only when the Momentum indicator crosses below the 100 line. After all, that is when the price action turns bearish, right?
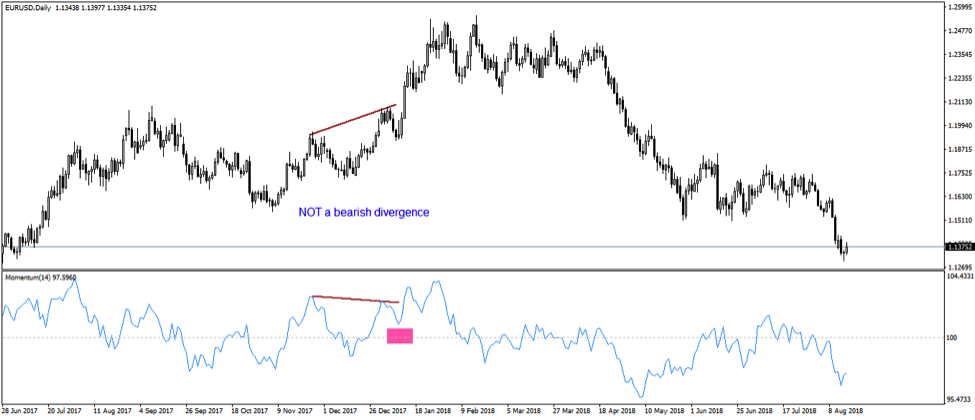
Otherwise, an odd situation appears, like on the chart above. It shows the EURUSD daily chart and, sometimes at the start of the trading year, the Momentum oscillator formed a bearish divergence with the price.
Jumping on the short side would be foolish, as the Momentum didn’t cross into the bearish market. Instead, it remained above the 100 level, showing still potential bullish conditions. Hence, traders must have patience, as trading with Momentum divergences gives many false alarms.
In my trading strategy, I DO NOT use the Momentum, but another oscillator.
>>CHECK IT OUT HERE
Momentum as a Volatility Indicator
Because the Momentum indicator closely reflects theactual price action, another way to use it is to spot volatility breakouts. Traders use it as a confirmation that the range ended and the trend resumes.
Once again, it all starts with the 100 level, the pivotal. The key here is to edit the indicator in such a way to add two new levels: 101 and 99. This way, we build a tight area that reflects close ranges.
You have to imagine that if the Momentum oscillator stays flat (at the 100 level), the price action remains flat too. Because price fluctuates all the time as the market is open 22/5, the Momentum also fluctuates around the 100 level.
Therefore, by adding the two levels, we create an area between the 101 and 99 values, which defines ranges. The idea is to spot breakouts from the area, a sign of increased volatility.
In other words, to avoid the market consolidations, or when the price action is very slow, traders keep positions open only when the Momentum indicator is either above or below the area. It is a guarantee that the market is volatile enough and moves fast.
Practical Examples of How Trading with Momentum Works
Trading with Momentum as a volatility indicator, therefore, is like scalping your way out of the market. Depending on the timeframe, the duration of a trade may differ.
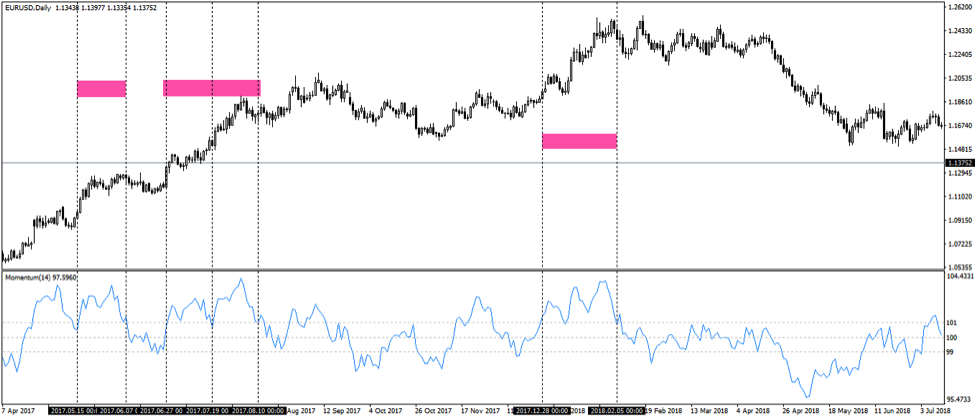
The chart above shows the same EURUSD on the daily timeframe, with the range between 101 and 99 visible. A quick comparison of the actual price action and how Momentum behaves, tells much about the importance of this range.
From the left side of the chart, when the Momentum oscillator breaks above the 101 level, it means the volatility is on the rise. The general market is on the rise.
The marked areas are great examples of how to profit from the rise in volatility with the Momentum indicator. They all show bullish setups.
On the right side of it, there is another setup, this time bearish. We leave it to you to apply the same rules, but this time to a bearish volatility breakout with the Momentum oscillator.
Trading With Momentum and RSI
 Perhaps the most complete way for trading with Momentum is to mix it up with another oscillator. Here’s why:
The Momentum oscillator compares the current closing price to the one from fourteen periods ago (the 14 period comes with the default settings).
That’s it.
It has only two values.
But other oscillators, like the RSI (Relative Strength Index – the most popular technical indicator among retail Forex traders) considers all the data in the previous fourteen candlesticks before plotting a value that corresponds to the current price.
A combination between the Momentum oscillator and the RSI, for instance, provides a unique approach to technical analysis. However, we must set the “rules of engagement” first.
The way to go is to keep the 101 and 99 area as defining ranges with the Momentum indicator. The idea of this strategy is to trade the breaks out of the range. But, to filter them with the RSI.
As an oscillator, the RSI’s main characteristic is that it shows overbought and oversold levels. The indicator comes with the levels as predefined, having two horizontal lines at the 30 and 70. Values lower than 30 or bigger than 70 show oversold, respectively overbought conditions.
Typically, traders sell overbought and buy oversold. But, this strategy works only with one condition: the market must be in a range.
When the market breaks out of a range, or when it’s trending, the overbought and oversold areas won’t work anymore. Instead, the price starts a trend that will test even the most experienced traders tempted to fade it.
If we use the same 14 periods for the RSI, we’ll see two indicators on the screen plotting almost the same values. Hence, to gain a competitive advantage ahead of the market, the secret ingredient is to use a faster RSI than the Momentum.
Trading Guide for the Strategy
 Let’s review again the logic behind this strategy, only to make it clear:
- We use the Momentum(14) with the 101 and 99 as the upper and lower edges that show ranging conditions
- We wait for the RSI (7) to reach overbought and oversold
- Finally, we filter the signal with the Momentum indicator
The logic is that if the RSI reaches overbought (values above 70), and, at the same time, the Momentum indicator stay in the range, that’s a confirmation for a trade. It means the classic overbought interpretation on the RSI won’t work because ranging conditions don’t exist. Hence, instead of selling overbought, we go long.
The opposite is true when the Momentum indicator breaks below 99. We check the RSI(7) and wait for it to reach oversold (below 30). If at the same time, the Momentum oscillator prints between 99 and 101, that’s a confirmation the range is over and, instead of buying oversold, we go short.
Consequently, if the RSI(7) reaches overbought or oversold but the Momentum indicator breaks out at the same time, ranges are still present, and the signal is simply ignored.
There’s a reason why traders do exactly the opposite. Because the Momentum indicator closely follows price action, when it sits close to 100, it forms ideal conditions to start a trend.
If you want to see how I trade using pure price action, click below:
>>Get My Trading Strategy<<
Trading with Momentum and RSI – Practical Examples on the EURUSD Daily Chart
The explanation above may be a bit confusing, but the idea behind it is relatively simple. The easiest way to prove it is to use practical examples.
The chart below shows the recent EURUSD daily price action. It has the two indicators on it (Momentum and RSI), with the 14, respectively 7 as periods. Four instances fill the criteria explained earlier.
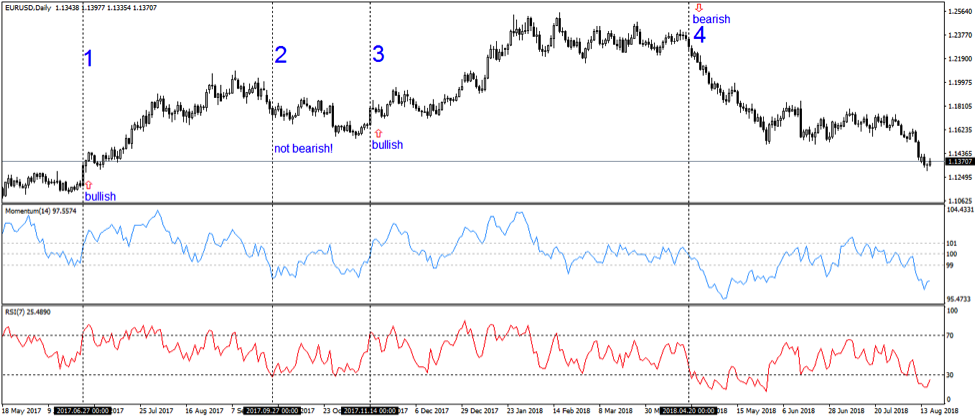
From left to right, the RSI reaches overbought levels above 70. Usually, that’s a signal to go short using the standard RSI interpretation.
However, the Momentum indicator has a value of 100.73, well inside the range. Conditions are perfect for the start of a new trend.
The RSI(7), using only seven candlesticks as period, proves a great signal for doing just the opposite. Savvy traders won’t sell the overbought. Instead, they go long.
The second example is a false signal. When the RSI breaks below 30, the Momentum indicator breaks out too. It means the price action is already underway, and the signal is just ignored.
Next, the market moves higher, and the RSI breaks above 70 again. At the same time, the Momentum indicator is well within the 99 and 101 area, confirming another bullish setup.
What follows is a staggering advance of over a thousand pips, with the RSI unable to break below 70 again.
However, when it finally prints below the 30 area, the Momentum confirms the signal again. This time a short signal, it is still valid even if the market dropped over a thousand pips.
Trend Trading with Momentum and RSI
So far, trading with momentum and RSI focused on spotting the start of a trend. How about adding to a trend?
The key here is for the RSI not to reach oversold areas in bullish trends. Or, overbought areas in bearish trends.
Therefore, the focus shifts to the Momentum indicator. To add in a bullish trend, wait for the Momentum to break below 99, while the RSI stays above 30.
On the other hand, to add in a bearish trend, wait for the Momentum to close above 101, while the RSI remains below 70. That’s a great place to add on the short side, in the same direction as the underlying bearish trend.
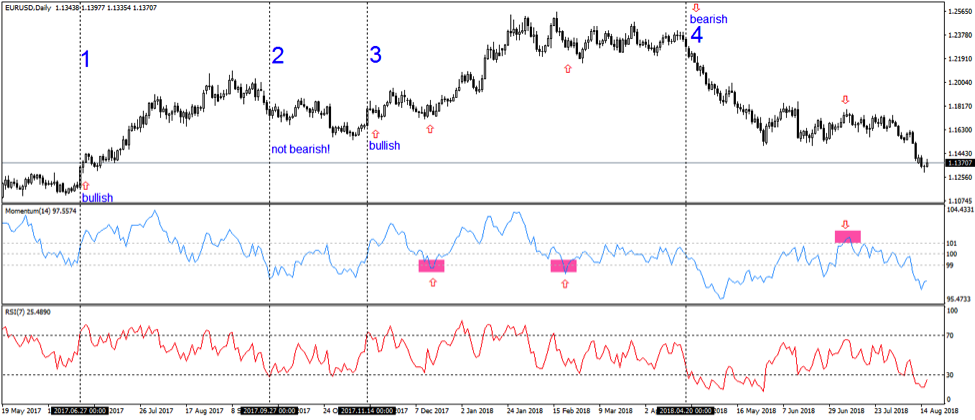
The EURUSD chart above offered two instance to add on the long side on the signal number three. The Momentum breaks below 99 while RSI remains above 70, providing two great entries in the same direction.
The recent EURUSD consolidation coincided with the Momentum indicator reaching values above 101, while the RSI remained below 70. Shorting again got a green light.
Final Words on Trading with Momentum
Trading with Momentum has a bit of everything. It follows the price action closely, keeping traders close to where the market goes.
Also, it filters signals given by other technical indicators, like the RSI, and tells traders to do precisely the opposite.
Moreover, it provides an equilibrium point as the 100 level acts as more than a classic pivot point.
I’m sure that after reading this article, you’ll inquire more about the power of trading with Momentum. After all, what other indicator provides such incredible trading setups?
P.S.
Want to learn about more oscillators? Check out my RSI and Stochastic articles.
Why not check out my PROFESSIONAL TRADING COURSE PAGE

This momentum indicator is different than that found for instance on tradingview.
Hi Kaus, in what sense? Can you be more specific please?
The Momentum indicator in usual platform has the value of middle 0 not 100. for instance on this indicator we couldn’t set the range between 99 and 101.