




Master Money Management Strategies for Futures Traders 2026
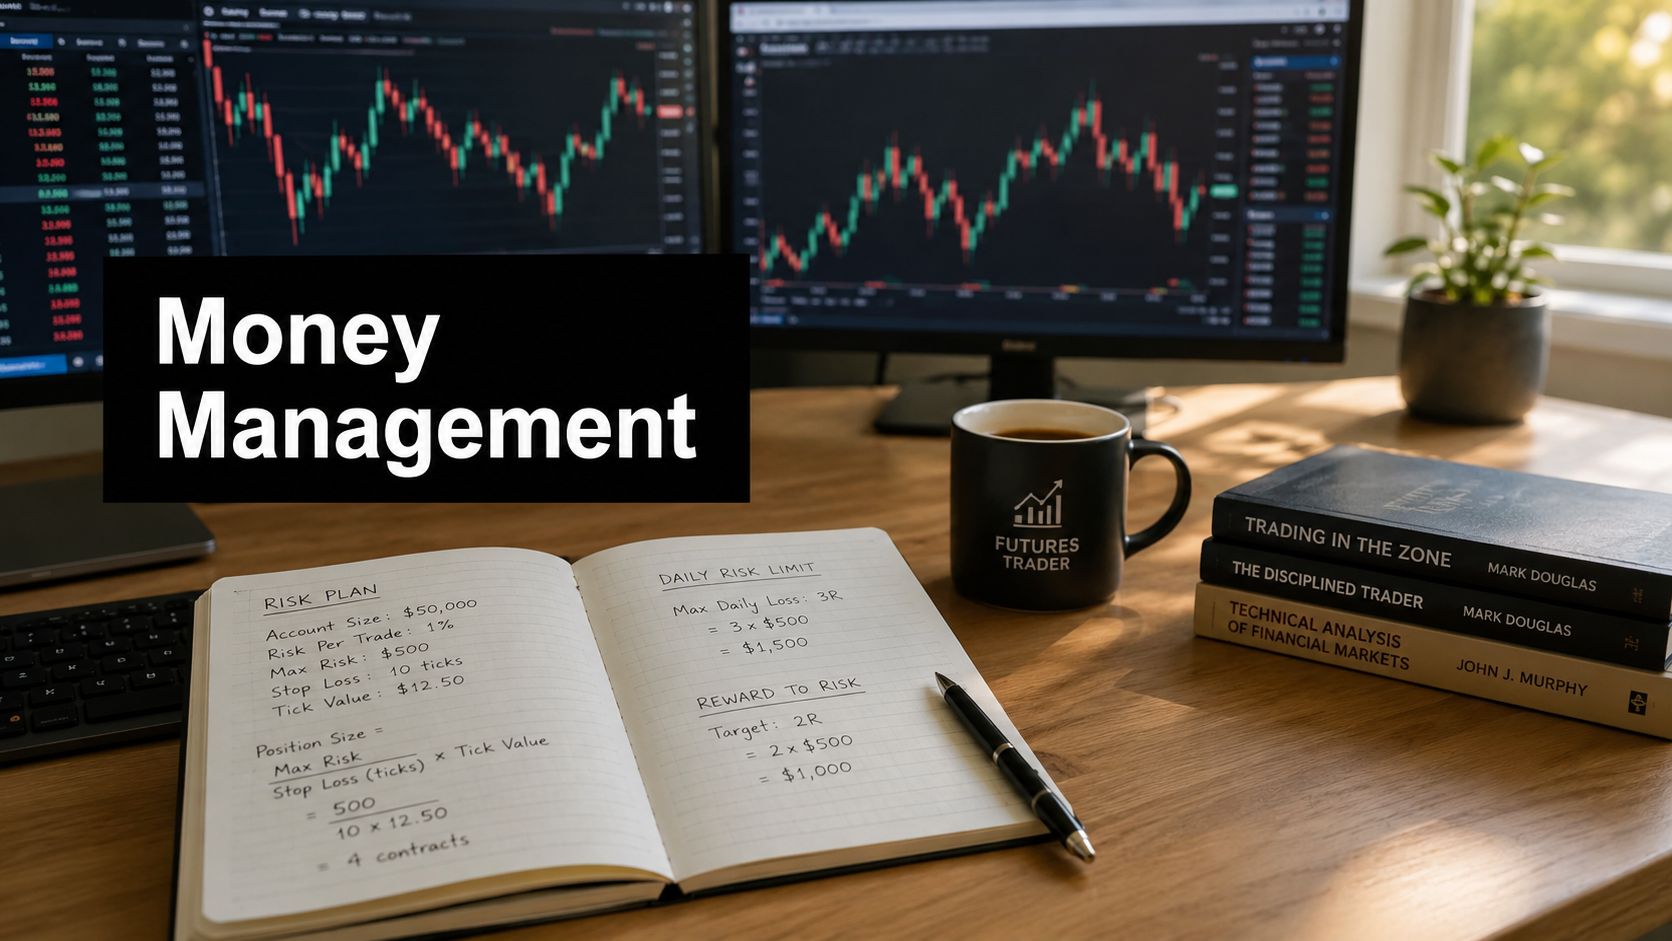
You catch a clean setup, size up because it looks obvious, and then the market snaps back through your stop. The loss isn't just bigger than planned. It changes how you trade the next signal. You hesitate on the good one, force the mediocre one, and by the end of the session you're no longer trading your chart. You're trading your P&L.
That cycle ruins more futures traders than bad entries ever do.
I trade price action, so I care about clean structure, location, and reaction. But none of that matters if position size is wrong, if risk is loose, or if a drawdown turns into revenge trading. The traders who last aren't the ones with magical pattern recognition. They're the ones who stay financially and mentally stable long enough for their edge to play out.
Why Most Futures Traders Fail and How You Can Succeed
Most futures traders don't fail because they can't find an entry. They fail because they treat money management like an afterthought.
The hard reality is clear. Retail traders in futures markets overwhelmingly lose money, with the median retail trader losing between $100 and $200 depending on the number of events traded, according to a CFTC analysis of retail futures trading. That matters because it cuts straight through the usual excuse that the problem is just strategy selection.

The real leak isn't your setup
I've seen the same pattern over and over on intraday charts. A trader finds a decent breakout pullback, a supply rejection, or a demand-zone bounce. The entry itself is fine. Then the trade is oversized, the stop is moved, or a second position gets added because the first one feels uncomfortable. A manageable loss turns into damage.
That's why I tell traders to stop asking, “What's the best pattern?” and start asking, “What happens to my account if I'm wrong several times in a row?”
A lot of the best answers for failing retail traders point back to the same issue. Poor risk control creates emotional trading, and emotional trading destroys execution.
Good chart reading helps you enter. Good money management keeps you in the game long enough to benefit from it.
Success starts with survival
If you trade price action, you already know that no candle pattern guarantees follow-through. A strong pin bar at support can fail. A clean break and retest can trap. A beautiful trend continuation can reverse the moment you commit size. That's normal.
What isn't normal is letting one failed idea distort the next five decisions.
The best money management strategies for futures traders do one job first. They protect capital so you can think clearly. Once that foundation is in place, your edge has room to work. That's when the chart starts making sense again, because you're no longer forcing outcomes.
The Bedrock of Survival: Your Core Risk Rules
The trade looks clean at 9:42 a.m. Price tags a prior demand area, prints a sharp rejection candle, and starts to lift. Then the actual decision shows up. Where is the trade wrong, how much can the account lose if it fails, and is the payoff worth taking at all?
That is the foundation.
Every futures trader needs a short set of hard rules that apply before any order goes in. Mine starts with capital protection. If a setup cannot fit the risk plan, it does not get traded. A solid entry pattern never overrides poor account math.
A practical baseline is the 1 to 2 percent risk limit, meaning one trade risks only a small slice of total account equity, as outlined in this guide on proven risk management strategies for futures traders. On a larger account, that still matters. A few oversized losses can put a trader into a drawdown that changes execution for weeks.

Start with invalidation, not profit
On my charts, the stop goes where the setup is proven wrong. If I buy a demand-zone reaction on the ES and price trades cleanly through the low that should have held, the idea failed. That point defines the stop. Only after that do I calculate whether the trade fits my allowed dollar risk.
This sequence matters because it keeps chart reading and account management connected. Price action gives the location. Risk rules decide whether that location is affordable.
Sometimes the stop is too wide. I pass and wait.
That is one of the trade-offs newer traders resist. They see structure they like and try to force smaller risk by tucking the stop inside obvious noise. I used to do that on breakout pullbacks in volatile sessions, and the result was predictable. I was right on direction often enough, but wrong on stop placement, so I paid for good reads with bad execution.
Demand enough payoff
A setup also needs room to travel. If the chart does not offer a realistic path to at least twice the initial risk, the trade is weak from a money-management standpoint even if the entry candle looks great.
On a chart, that usually means checking the next opposing area before entering:
- Demand-zone reversal: Stop below the zone. Target needs clear room into the next supply area.
- Breakout and retest: Entry on the retest only makes sense if price is not running straight into overhead resistance.
- Trend continuation: A pullback in trend is attractive only when the next barrier is far enough away to justify the risk.
A plug-and-play framework proves helpful. The chart pattern, stop placement, and required payoff all work together. Volatility changes the stop distance. Stop distance changes position size. Nearby structure determines whether the reward still justifies the trade. That is how price-action traders stay consistent instead of applying fixed rules blindly.
Three rules that keep traders in business
Write these down and keep them visible:
- Risk a fixed fraction of equity per trade. Keep each loss small enough that a losing streak stays manageable.
- Place stops beyond market structure. The stop belongs at the invalidation point, not at a random dollar figure.
- Require clear asymmetry. If the chart cannot reasonably support a favorable reward relative to risk, skip the setup.
For a broader look at building these rules into daily execution, this guide on money management in trading is useful. If you want another practical reference on execution discipline, this piece on how to manage trading risk is also worth reading.
The point is simple. Survival in futures trading comes from rules you can apply on a live chart, in fast conditions, without negotiation.
Sizing Your Positions Like a Professional Trader
Amateur traders ask, “How many contracts can I trade?” Professional traders ask, “How many contracts fit this exact setup without breaking my risk rule?”
That difference sounds small. On a live chart, it changes everything.

Fixed size versus chart-based size
A lot of traders use the same number of contracts on every trade. That feels simple, but it ignores the one thing a price-action trader can't ignore. Structure changes. Volatility changes. Stop distance changes.
If I'm trading a tight pullback in a calm market, my stop may sit relatively close to the entry. If I'm trading a wider swing reaction around a major zone, the stop often needs more room. Holding the same contract count across both setups means I'm not holding risk constant. I'm letting chart conditions decide my account exposure by accident.
A professional approach sizes from the stop distance, not from habit.
Here's the basic logic:
| Method | How it works | Main flaw or strength |
|---|---|---|
| Fixed contracts | Trade the same number every time | Easy, but ignores volatility and stop width |
| Fixed dollar risk | Keep the same dollar risk each trade | Much better, but still needs proper stop placement |
| Structure and volatility adjusted | Set stop from chart, then size to maintain constant risk | Closest to professional execution |
Tick value and stop distance decide the trade size
Proper risk management requires adjusting contract size based on the current tick value and the exact stop-loss distance in ticks, so the dollar risk stays constant even when volatility expands. One example given is a 50-tick stop, which must be translated into dollar risk before contract size is chosen, as explained in this video discussion of futures risk execution.
That's one of the most overlooked parts of money management strategies for futures traders.
If your stop is wider because the chart requires it, your size usually needs to come down. If the structure is tighter and still valid, size may increase while total risk stays the same. That's what professionals do. They don't force the market to fit a preferred size. They let the market define the stop, then they calculate size around it.
For quick execution, I'd keep a calculator ready. A dedicated position size calculator for traders helps remove guesswork when you're converting chart structure into actual order size.
A short walkthrough helps illustrate the process:
What good sizing feels like
Good sizing feels almost boring. You're not trying to hit a home run because the chart looks especially clean. You're not doubling size after a winner because confidence is high. You're not shrinking to irrelevance because the last loss hurt your confidence.
When size is correct, the trade still matters, but it doesn't control your emotions.
That's the point. Position sizing should protect your decision quality as much as your account balance.
Managing Leverage Margin and Drawdown Periods
Leverage is useful. Misused leverage is lethal.
Futures traders get into trouble when they confuse access with permission. Just because the platform lets you control a larger position doesn't mean your account can absorb the path price takes before the trade either works or fails. Margin gives you efficiency. It doesn't erase risk.

Margin trouble usually starts before the margin call
On the chart, the warning signs show up early. A trader starts widening stops to avoid being tagged out. Then comes a second entry to improve average price. Then a hold-and-hope decision replaces a clean exit. By the time the account is under real pressure, the damage was already done several decisions earlier.
If you're fuzzy on the mechanics, this plain-English guide to what a margin call is in trading is worth reviewing. Every futures trader should understand exactly what happens when account equity falls too far.
Daily loss limits should come from your own behavior
One of the most useful ideas in futures risk control is that daily loss limits should be based on statistical drawdown probabilities, not arbitrary percentages, because a mismatch between loss limits and real trading behavior leads to premature blowouts, as discussed in this community discussion on drawdown-based loss limits.
That point matters more than most traders realize.
A daily cutoff only works if it reflects how your system behaves. If your price-action method tends to produce clusters of losses before a clean run of trend trades, your daily stop has to account for that reality. If you set it too tight, you'll stop yourself out of normal variance and come back frustrated. If you set it too loose, you'll keep trading into an emotional spiral.
My drawdown playbook on price-action systems
When I hit a rough patch, I don't solve it with more screen time. I simplify.
- Stop for the session: Once I hit my predefined line, I'm done. No “one more setup.”
- Review the last sequence: I check whether the losses came from valid trades, poor location, or size and execution mistakes.
- Reduce size on return: I come back smaller, with a narrow focus on the cleanest patterns only.
- Wait for clarity: If the chart is noisy and reaction levels are sloppy, I won't force participation.
A drawdown is not the time to prove toughness. It's the time to protect judgment.
The traders who recover best aren't the most aggressive. They're the most controlled.
Putting It All Together A Price Action Trade Example
Let's put this on a chart the way I'd trade it.
Assume price has been trending higher, then pulls back into a well-defined demand zone that also lines up with a prior breakout level. As price tests the zone, sellers push lower but fail to hold the move. The next candle rejects the low and closes strong. That's the kind of price-action signal I want. Not because it's magic, but because it tells me exactly where the trade idea fails.
Step one read the location before the candle
The candle matters less than the location.
If a bullish rejection forms in the middle of a messy range, I don't care. If the same rejection forms at a clean demand area after a controlled pullback, now I'm listening. I want structure first, then confirmation.
My checklist on that chart is simple:
- Clear demand zone: Price previously left the area with urgency.
- Return into that zone: The market pulls back instead of collapsing through it.
- Reaction candle: Buyers step in and reject lower prices.
- Room to target: The next obvious opposing zone leaves enough space for a proper payoff.
Step two place the stop where the trade is wrong
The stop goes below the price structure that invalidates the long idea. Not below some random line. Not at a distance that feels comfortable.
If buyers defended demand, price shouldn't accept below that rejection structure. Once I have that stop placement, I can calculate the trade. However, many traders reverse the process. They decide how many contracts they want first and then force a stop that fits. That's backward.
Step three calculate size from the chart
Now I convert the setup into risk.
If the stop distance is wider because the rejection happened with bigger candles, contract size comes down. If the stop is tighter and still technically valid, contract size may rise while total account risk stays the same. The dollar risk remains fixed. The chart determines the distance. Position size does the adjustment.
That one habit solves a lot of problems:
| What the chart shows | Professional response |
|---|---|
| Wide pullback and deep stop | Reduce contract size |
| Tight, clean rejection | Size can be larger within the same risk cap |
| Choppy zone with unclear invalidation | Pass on the trade |
| Strong signal but poor target room | Pass on the trade |
Step four manage the trade without improvising
Once I'm in, I already know the target has to justify the risk. The benchmark I like is the same one serious traders use in any sound framework: a payout profile where the reward is at least meaningfully larger than the loss.
If price moves cleanly away from the zone, I let the trade work toward target. If it stalls immediately and prints weak follow-through into nearby resistance, I pay attention. Not every trade deserves heroic patience. The chart should continue to confirm the reason I entered.
The most important point is this. By the time I click buy, the hard decisions are already made. Entry, stop, size, and target logic were all defined before the order. That's what makes money management strategies for futures traders usable in live conditions. They have to fit inside a real chart-reading process, not sit in a spreadsheet disconnected from execution.
Your Money Management Action Plan to Ensure Longevity
A trading plan only matters if it survives contact with a live market. The strongest money management framework is the one you can execute on an ordinary Tuesday, after a loss, while the chart is moving fast.
The good news is that you don't need a complicated playbook. You need a repeatable one.
Build your operating rules in writing
Start with a one-page document. Keep it visible. Your rules should be simple enough to follow under pressure and specific enough to stop negotiation.
Write down:
- Your per-trade risk rule: Put your hard cap in writing.
- Your setup filter: Define which price-action patterns you trade.
- Your stop logic: State where invalidation belongs on the chart.
- Your loss-stop protocol: Decide what ends the session and what triggers a review.
If a rule lives only in your head, it will change the moment a trade goes against you.
Start smaller than your ego wants
A practical growth path is to start with one or two contracts, build and refine your method without the pressure of larger size, and only increase size when your risk tolerance supports it, according to this managed futures and position-building reference from CME Group. The same reference also states that the probability of making money in managed futures strategies increases dramatically when an investor maintains the allocation for three to five years.
That long-horizon idea matters even for active traders. It reminds you that this business rewards consistency and staying power, not bursts of aggression.
Use the next month to install the habit
Don't try to transform everything in one day. Use a short implementation cycle and focus on execution quality.
- Week one: Define your exact setups and mark where stops belong on historical charts.
- Week two: Build or refine a sizing worksheet so every trade starts from the same calculation process.
- Week three: Track whether you followed rules, not just whether trades won or lost.
- Week four: Review your drawdown behavior, especially what happens after the first loss of the day.
The traders who last treat discipline as a process, not a mood.
That's the true edge. Not a secret indicator. Not a perfect entry. Just clean price reading, controlled size, and enough consistency to let time work for you.
If you want to sharpen a price-action approach that connects entries, stops, and position sizing into one practical method, Colibri Trader is a strong place to continue. It's built for traders who want straightforward chart reading, disciplined execution, and a framework they can apply in live markets without relying on clutter or complicated analysis.