


Gold Trading Analysis 08.02.2023
Dear traders,
It has been a while since I last posted. I have been keeping busy in the trading room.
In my last article, I was walking you through a GBPUSD trade analysis.
I was looking for a short entry and even if the price went lower, there was no clear confirmation from the 4H chart.
Since then the price has been range-trading and it still has not established a clear direction.
Let’s jump to the other instrument that I have been looking at recently.
Gold Trading Analysis 08.02.2023
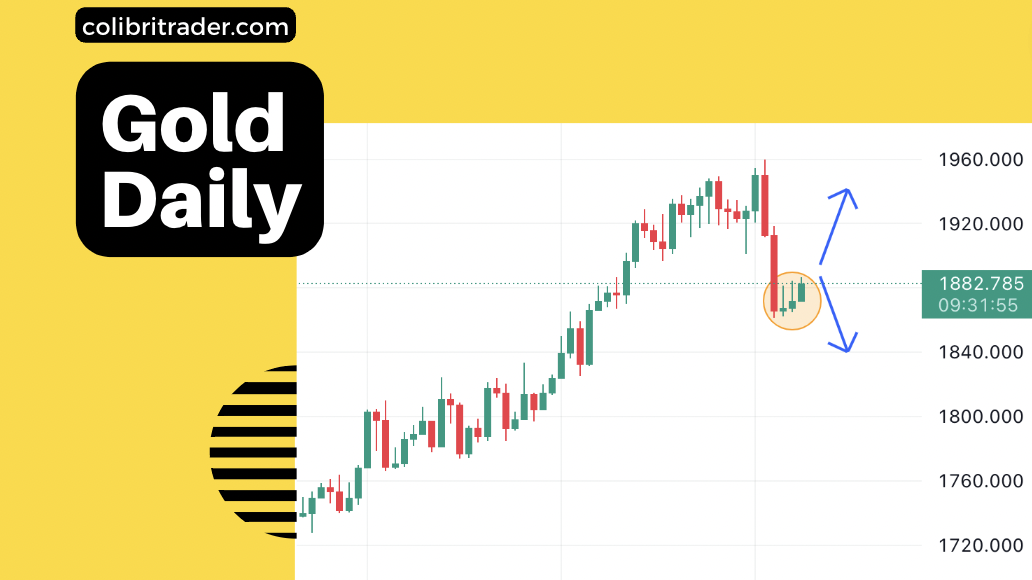
Today I am looking at the daily chart of gold.
It looks like we are at a crossroad.
There was a minor demand zone on the daily chart from which gold is bouncing off.
This coincides with a candlestick pattern confirmation from the daily chart.
There is an inside day that formed on the daily chart. In the context that the instrument provides, it looks more bullish than bearish.
On the other side, I would love to see another confirmation signal from the 4H or Daily.
There is a possibility that we might see the price re-testing the 1860 level.
Alternatively, if price does show a rejection candle and continues going higher, this might be a great buying opportunity.
Until I see one or the other scenario, I will stay on the sidelines.
Happy trading,
Atanas
P.S.
Did you read my recent article on Trading With Supply and Demand Zones?