


EURUSD Trading Analysis 02.03.2022
Dear traders,
The trading analysis from last time was on GBPUSD.
There was an inside day candlestick formation on the daily timeframe.
It coincided with a demand zone and since then price has been gravitating around this zone.
I was looking for the price to re-test the level of 1.3350 and such a re-test did really happen.
There was even a pin bar on the 4H chart.
Remember?
I shared with you that I would be looking for one.
And here it is:
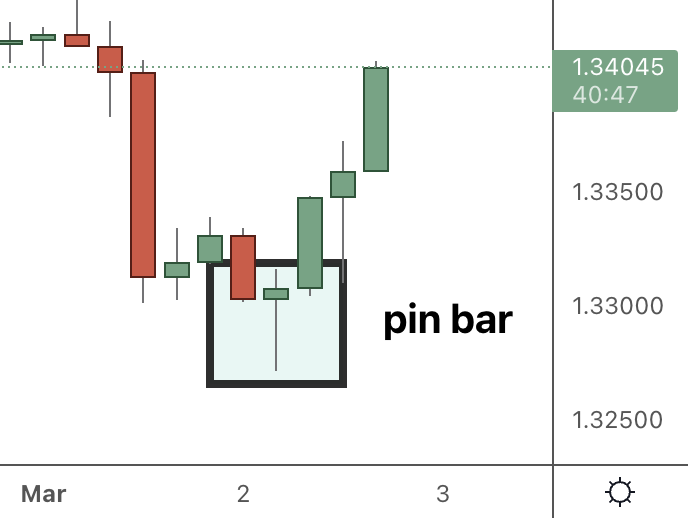
A trader could not have asked for a better price confirmation from the lower timeframes.
Where will price go from here?
Well, the top of the range is at 1.3850.
Will it really go that high?
The simple answer is that it depends on the price.
Now, let’s turn our attention to EURUSD.
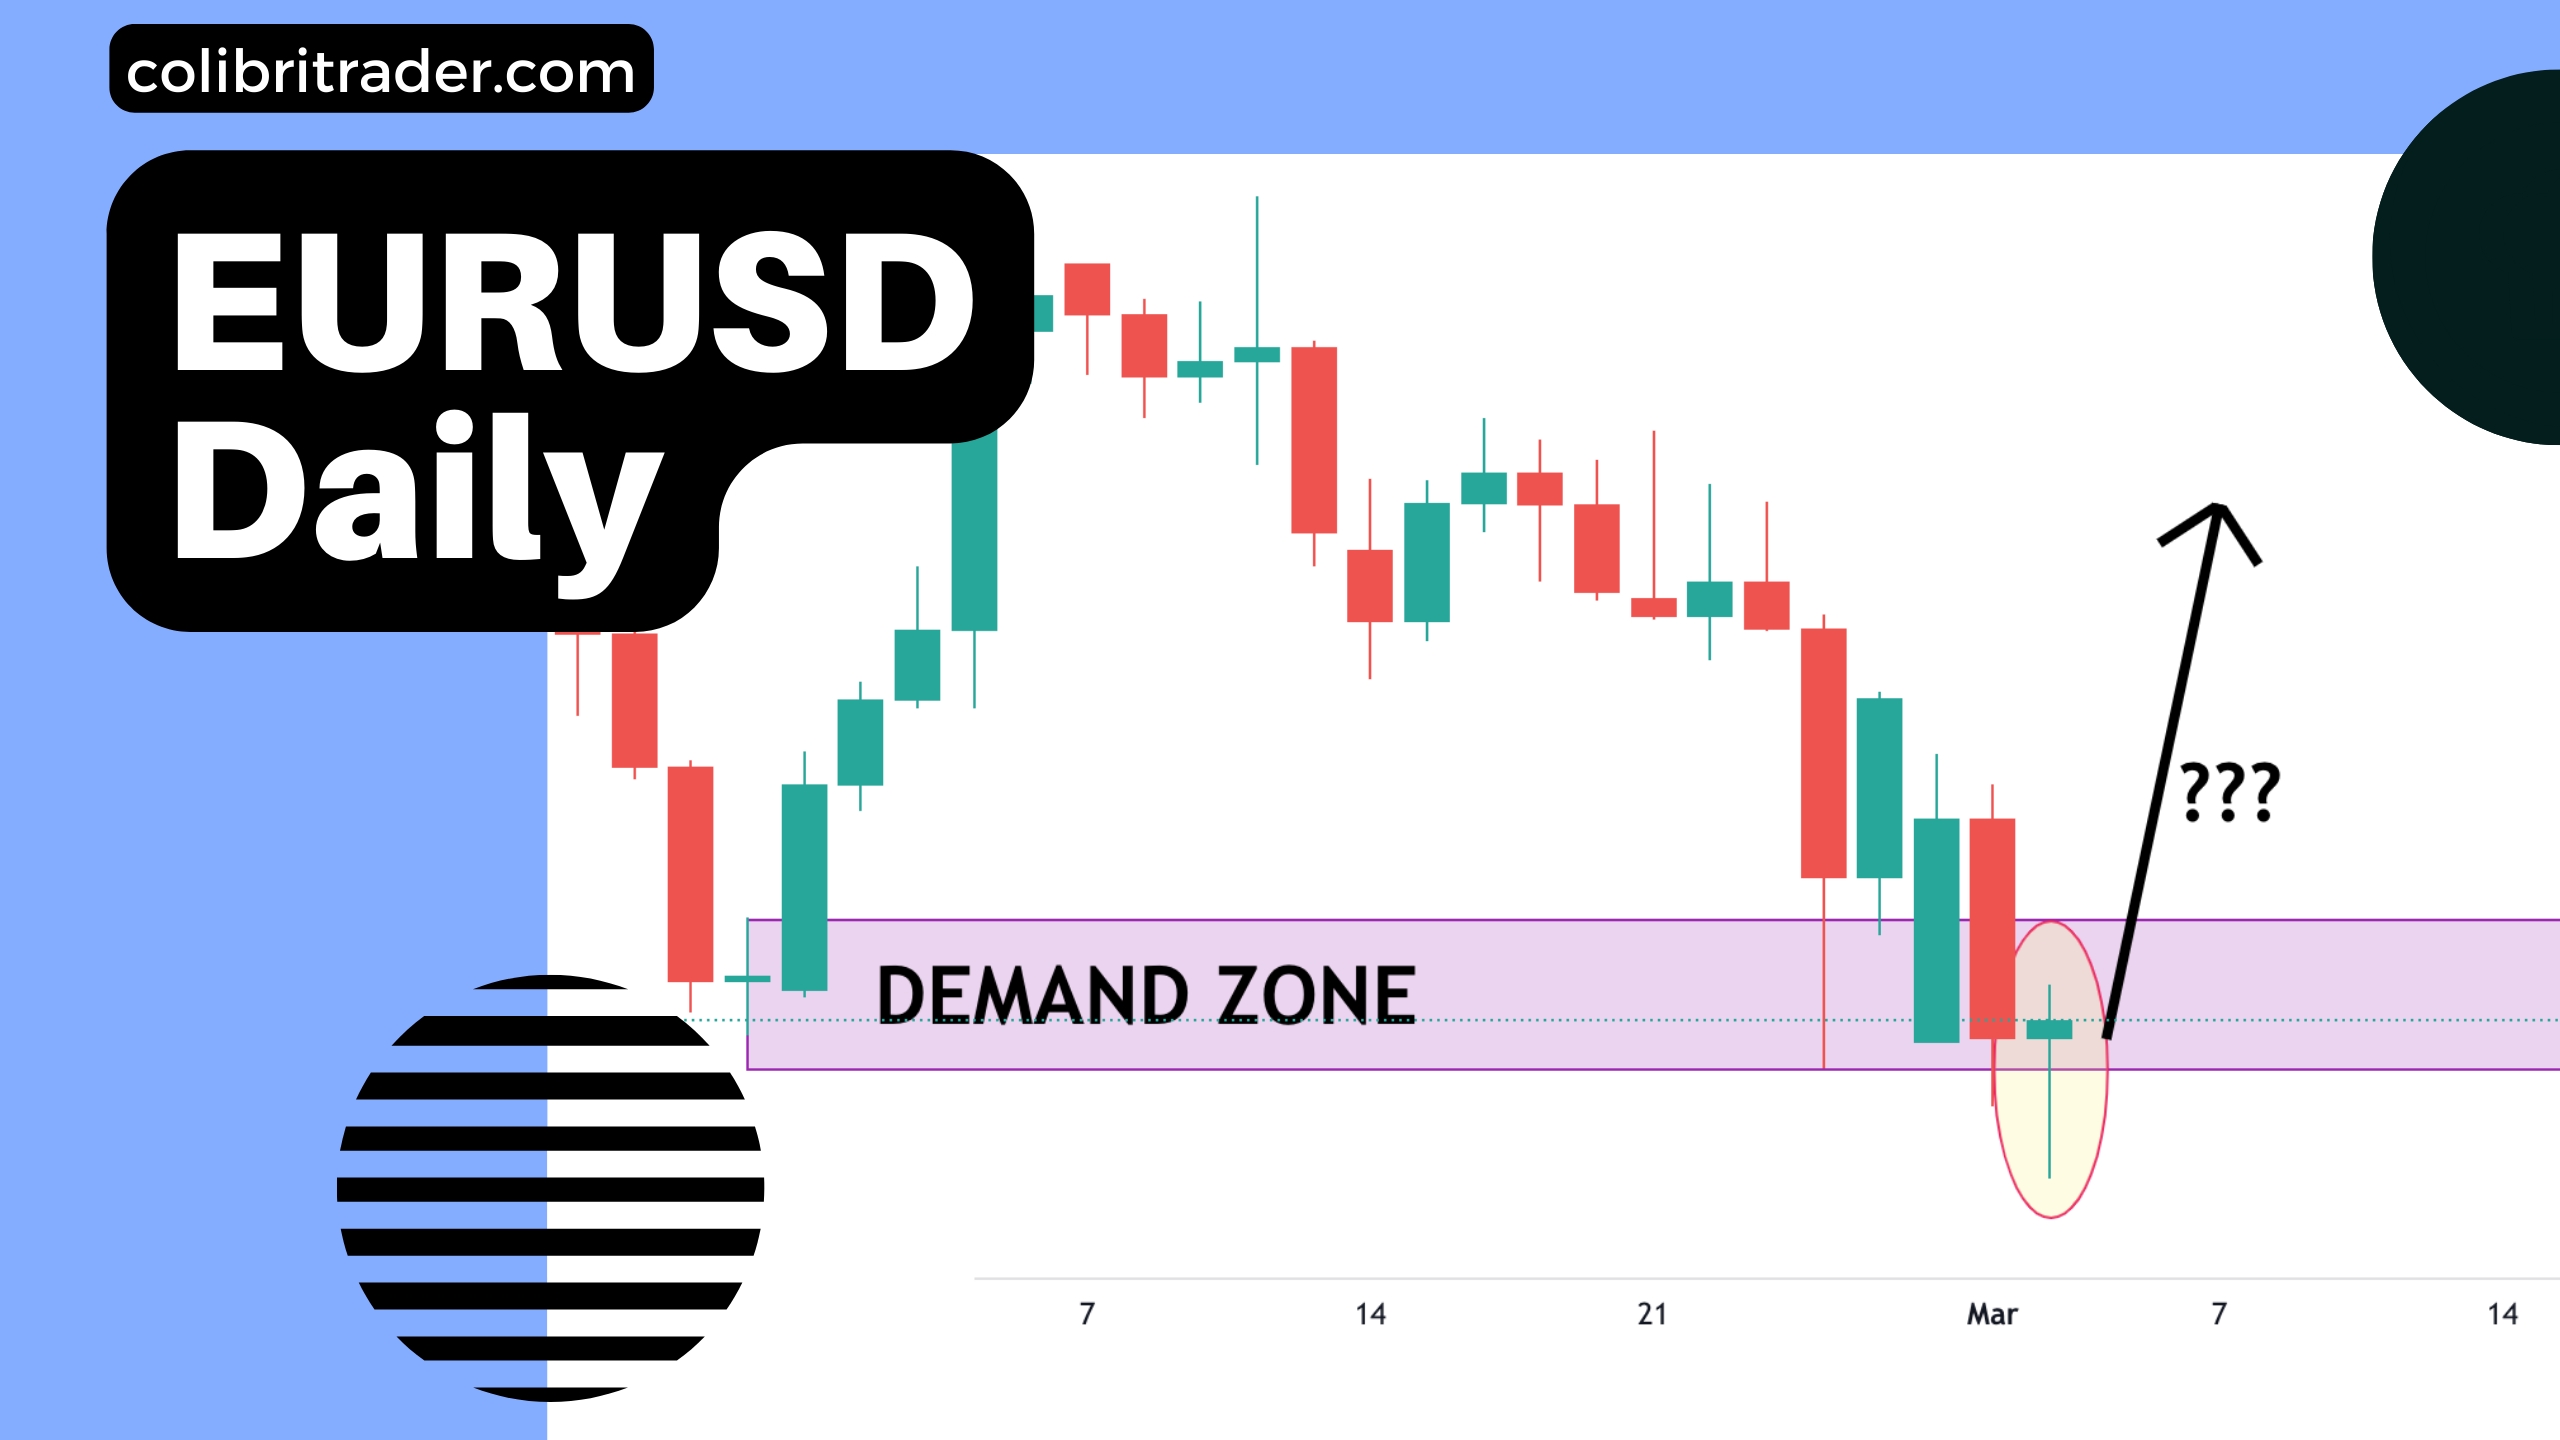
EURUSD Trading Analysis 02.03.2022
I have also been looking for the price to reach the zone that it has reached today.
Remember my article on EURUSD from the 16th of February?
If you want to re-read it- here it is 🙂
Price has reached the supply zone and has also formed a pin bar.
This is a clear indication that the sellers are losing control and buyers are stepping in.
Tomorrow, I will be looking for more clear indication from the 4H chart.
Another pin bar or a bullish engulfing pattern would be great.
Let’s wait for that to come first, though!
Happy trading,
Colibri Trader
P.S.
Did you read my article on Supply and Demand Zones (The Ultimate Guide). If not, you can do it now. It will teach you how to use those zones properly