


Day Trader Setup: Hardware, Charts and Risk Rules
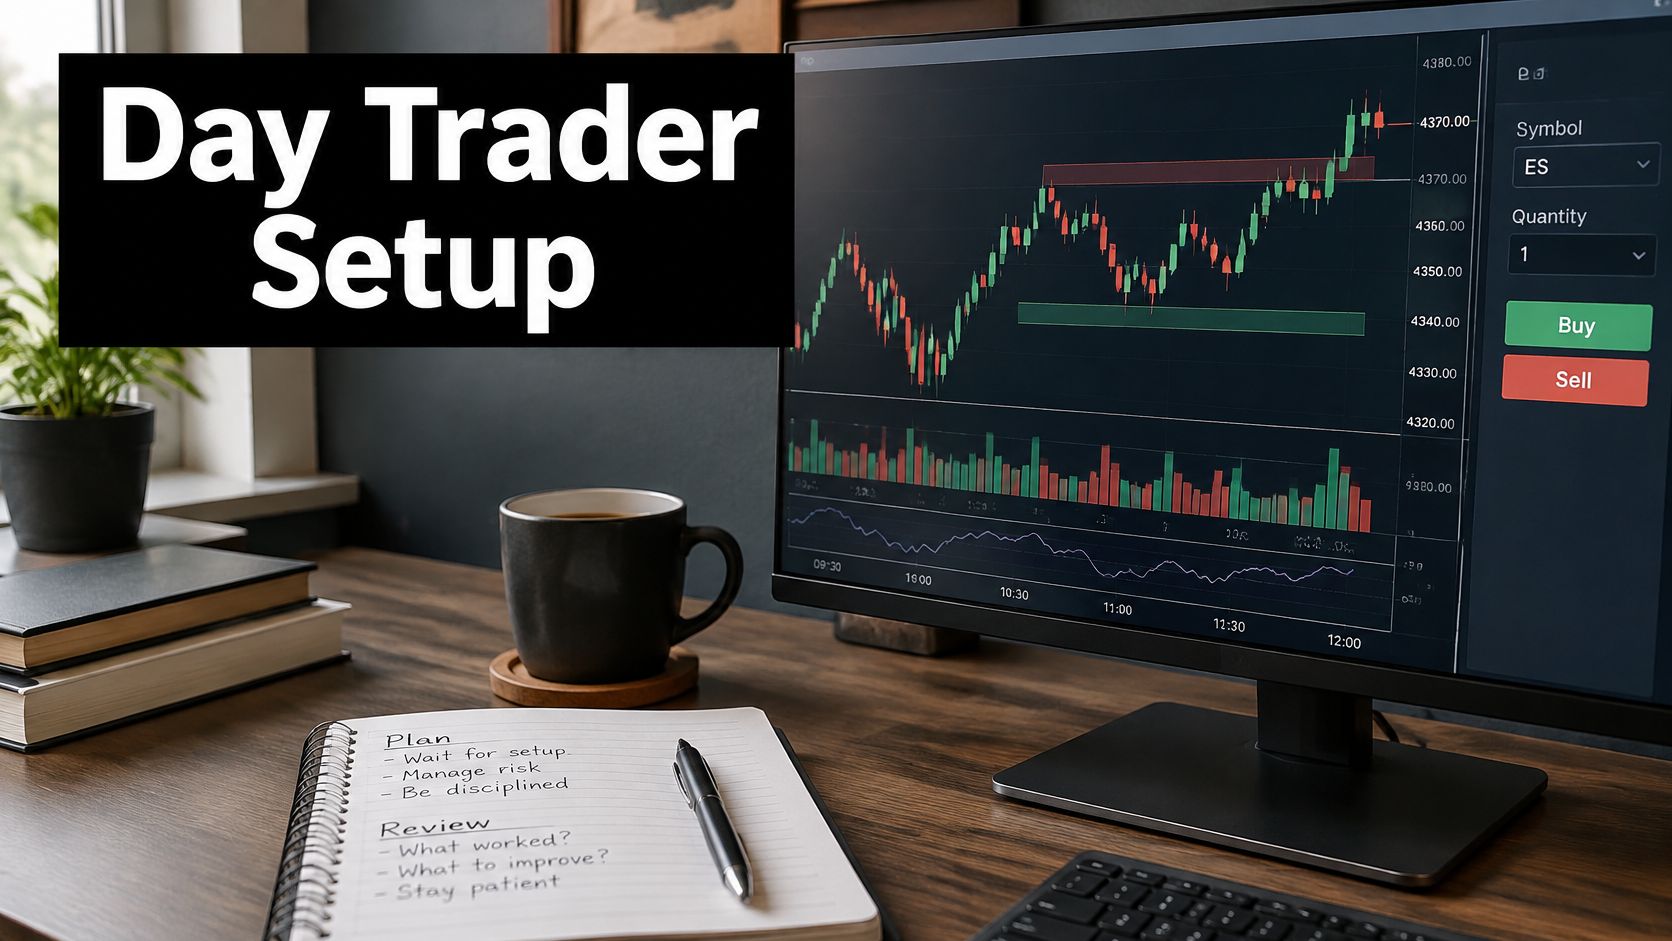
You've got a laptop open, three browser tabs comparing monitors, and a broker account half funded. The chart looks clean enough, but you don't know how many day trades you're allowed, how much you can lose on one idea, or what a month of data and platform fees does to a small account. So you hesitate, then you chase a move anyway.
That's the wrong order. A workable day trader setup starts with the rules that can lock your account and the math that can empty it. Hardware comes after that. Charts come after that. If the first two don't work on paper, extra screens only help you lose money with a better view.
I would build it in that order every time. Set the legal and risk limits first, buy only the gear that serves those limits, then paper test the full routine before you risk live size.
Pattern Day Trader Rules and Margin Limits
Four day trades in five business days can change what your broker allows you to do next. In the United States, the Investor.gov margin bulletin explains that a trader is generally classified as a pattern day trader after executing 4 or more day trades within 5 business days, provided those day trades represent more than 6% of the trader's total trades in the same margin account during that period. A day trade means buying and selling, or selling and buying, the same security on the same day in a margin account.
That definition matters because beginners often count calendar days or forget that opening and closing the same position intraday is the trigger. Learn the full vocabulary in our guide to day trading terms before you assume a quick exit doesn't count. If you're outside the United States, don't import this framework wholesale. Check your own regulator and broker terms, because account types and trading rules differ by jurisdiction.

The Equity Floor You Must Maintain
Once you're classified, you must maintain at least $25,000 in account equity before continuing day trading activity, and that figure must be maintained rather than funded once and allowed to slip. If equity falls below it, your broker must restrict further day trading until you correct the deficiency. Treat that as a hard floor in your setup, not a marketing headline on a broker page.
Buying power adds a second trap. The framework permits day trading buying power of up to 4 times the trader's maintenance margin excess from the previous day. Exceed that limit and you can trigger a margin call. If you don't meet it within 5 business days, the account may be restricted to cash available trading for 90 days.
Practical rule: Buying power is permission to borrow, not money you own. Size trades from equity and your stop, never from the largest order the platform will accept.
Futures, FOREX, CFDs and spot currency trading have large potential rewards but also large potential risk, so switching markets to dodge one rule doesn't remove that risk. It just changes the rulebook you need to understand.
A Three Step Morning Check
Run this before the open, every session, and write the answers down.
- Confirm account type. Are you in cash or margin today, and has anything changed since yesterday?
- Count the rolling window. How many day trades have you made in the last five business days?
- Check buying power. What's available, what's your planned position size, and how much room does that leave if price gaps?
If any answer is unclear, don't place the first trade. Call the broker or sit out. A missed morning costs nothing. A restricted account can cost you a quarter.
Risk Limits, Position Size and Break-Even Math
Start with the loss you can afford, not the profit you want. This table sets an example risk budget using 0.5% and 1% risk per trade and a 3% daily loss cap. These are planning examples for your worksheet, not guarantees about what any account will earn or lose.
| Account Size | Risk per Trade at 0.5% | Risk per Trade at 1% | Daily Loss Cap at 3% |
|---|---|---|---|
| $5,000 | $25 | $50 | $150 |
| $10,000 | $50 | $100 | $300 |
| $25,000 | $125 | $250 | $750 |
Read it from left to right. Say you have a $10,000 account risking 0.5%. You can lose $50 on one trade. Your stop distance then decides your size. If entry to stop is $0.50 per share in this example, $50 divided by $0.50 gives 100 shares. If the stop is $0.25 away, the same risk allows 200 shares. The share count changes. The dollar risk doesn't.
That's the core of position sizing in trading. You don't pick a round lot because it feels serious. You divide planned dollar risk by distance to invalidation, then round down so spread and slippage don't push you past budget.
What Break Even Really Means
The SEC day trading tips emphasize that day traders face costs beyond commissions, including computers, training, and other firm expenses, and should calculate how much they must earn before trading becomes profitable. That warning also covers positions that can produce losses exceeding your initial investment and margin calls requiring additional funds on short notice. Build those realities into the sheet before you trade.
List every monthly fixed cost first. Data, platform, training, internet upgrades, journal software, accounting help. Then list per trade costs. Commission, spread, expected slippage, and any financing charge. Don't hide training or hardware in a separate personal budget just to make trading look profitable.
A setup that only breaks even before costs doesn't break even.
Here's a worked example. Say your fixed costs are $300 for the month and you plan 40 trades. That adds $7.50 per trade before you enter. Add a hypothetical $6 round trip in commissions and spread, and each trade must earn about $13.50 on average just to cover costs. Only expectancy above that line adds profit, and taxes still sit outside this example.
If that hurdle looks high for your account, the answer isn't more trades. More trades multiply per trade costs and usually lower selection quality. Cut fixed costs, trade less often, stay in simulation longer, or accept that the account is for learning with tiny size.
The Daily Stop Is Non Negotiable
Once you hit the 3% daily cap in this example framework, the session ends. No recovery trade. No smaller revenge trade. No switching symbols to pretend it's a new day.
Keep an emergency liquidity rule outside the trading account. Don't use rent money, emergency savings, or borrowed personal funds. If a margin call would force you to raid essentials, your setup is already too large, regardless of what the chart shows.
Hardware and Software Checklist You Actually Need
You can start on one screen. A single reliable computer, one clear monitor, wired internet with a backup connection, real time data for your market, and a journal will run a disciplined price action routine. Extra screens help you watch more symbols, but they don't improve a weak entry rule.
I would buy reliability before screen count. Spend first on the machine and connection that won't freeze with a position open. Our overview of computer monitors for trading helps if you're weighing a second display later, but it isn't a day one requirement.
| Component | Minimum to Start | Why It Matters |
|---|---|---|
| Computer | One computer with at least 16 GB of RAM | Laggy charts delay entries |
| Monitor | One 24 inch monitor | Chart and order ticket visible together |
| Internet | Wired connection plus phone hotspot | A dropped connection leaves an open position unmanaged |
| Trading platform | Direct order entry with stop and limit orders | Fill speed and stop control decide results |
| Market data | Real-time quotes for your market | Delayed data produces false signals |
| Trade journal | Spreadsheet logging every trade | Patterns in your results show up only with records |
What Can Wait
A second monitor, a hardware trading keyboard, and a faster computer are optional upgrades. Let results justify them. If you can't explain which bottleneck an upgrade removes, you're decorating a desk, not improving execution.
The journal can't wait. Use a simple spreadsheet with date, symbol, entry, exit, stop, size, result, and whether you followed the plan. Add a screenshot link if you like, but don't skip the plan column. Losses that followed the plan teach you about the method. Losses that broke the plan teach you about discipline. Mixing them makes both lessons useless.
Test the platform before money is involved. Place a small paper order, move the stop, cancel a pending order, and close the position from the positions window. Each action should fill, update, or cancel within a few seconds in normal conditions. If you have to hunt for the cancel button in a test, you'll hunt for it under pressure too.
Inventory what you already own against the table. Most beginners need one purchase, usually proper data or a backup connection, not a full workstation. Buy that one item, test it for a week, then reassess.
Chart Layout and Platform Settings Step by Step
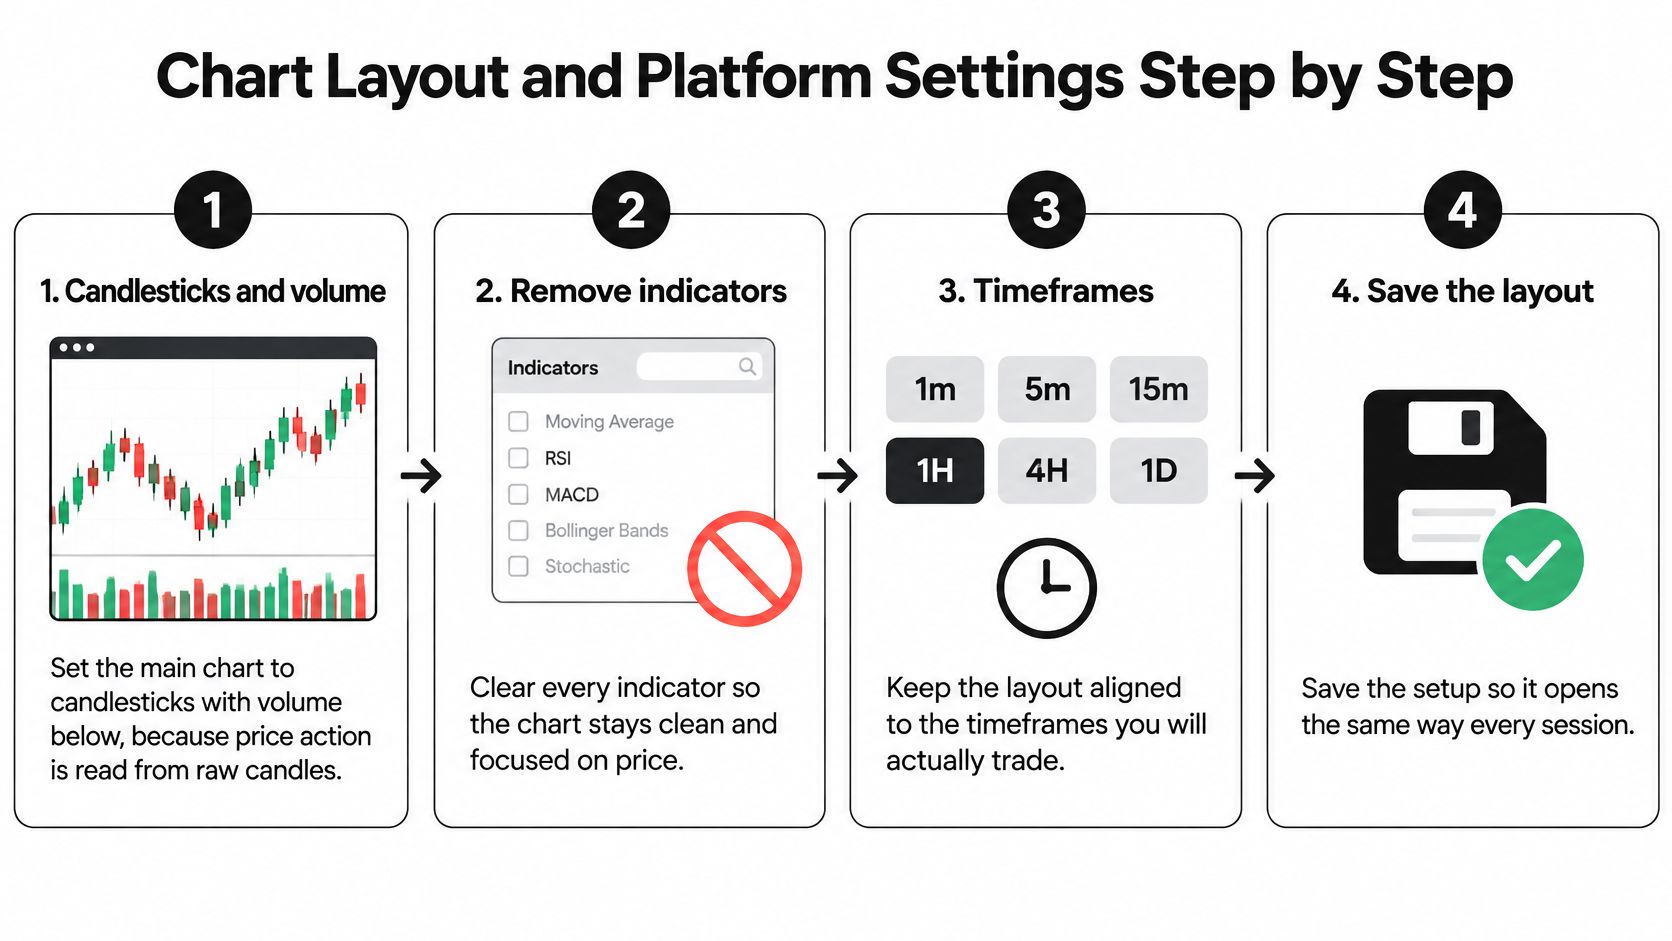
Configure the screen in the order you'll use it during a session. The goal is a clean price action layout you can read in seconds, with order defaults that can't surprise you.
Build the Clean Chart
- Set candlesticks with volume below. Price action is read from raw candles, and volume sits underneath where it informs without covering price. The common slip is shrinking the price pane so far that candle bodies become unreadable.
- Remove every indicator and overlay. Extra lines give you a second opinion you must reconcile at the exact moment you should be checking your zone and stop. If an indicator stays, write down what decision it changes. Most can't pass that test.
- Draw zones, not single lines. Mark support and resistance as shaded bands on the daily and 5 minute charts. Reactions happen across a band where buyers and sellers previously acted, so a hairline often marks a level price never precisely respected.
- Build a short watchlist. Keep five to ten liquid symbols you know well. Scanning a whole market at the open produces late entries on unfamiliar spreads and halt patterns you haven't studied.
Set Orders and Alerts
- Fix the default order size and hotkeys. Set the default to your smallest planned size so one click can't send an oversized lot you forgot to change. Test every hotkey in simulation, especially flatten and cancel all.
- Mute minor alerts. Keep only price alerts at marked zones. News pings, chat sounds, and indicator crosses pull attention away from the one event that matters, which is price reaching a level you planned to act on.
- Save and export the template. Store a backup outside the platform folder. Updates and reinstalls happen, and rebuilding zones, colors, and hotkeys from memory before the open invites mistakes.
Five second check: Glance at the screen and read the last three candles, the nearest zone, and your working orders without clicking anything. If you can't, the layout is too busy.
Color choices deserve one practical note. Use muted candle colors and one bright color reserved for stops or active orders. When everything is bright, nothing stands out. Your stop line should be the easiest element to find because it's the line that defines whether the idea is still valid.
Do this setup once, then leave it alone during market hours. Rearranging windows mid session usually means you're avoiding a decision the plan already made. Change layouts after the close, note why in the journal, and test the change the next morning before the open.
Timeframes That Match Your Trading Style
Use three charts with three different jobs. The daily chart sets direction and major zones. The 15 minute chart shows intraday structure. The 5 minute chart times the entry and stop. When each timeframe has one job, you stop asking a small chart to overrule a big one.
| Timeframe | Role in the Setup | Typical Hold |
|---|---|---|
| Daily | Trend and major support or resistance zones | 1 to 5 days |
| 15-minute | Intraday structure and key levels | 1 to 3 hours |
| 5-minute | Entry trigger and stop placement | 15 to 60 minutes |
| 1-minute | Fast scalp entries with high noise | Under 15 minutes |
Pick one entry timeframe and check the higher timeframe before every trade. A 5 minute long signal pressing straight into daily resistance isn't a bargain. It's a trade with limited room and a crowd of sellers already marked on your own chart. Skip it, or wait for price to clear and retest that level.
One Example From Top Down
Say the daily chart shows a demand zone around a prior low where price reversed strongly before. You shade that band and set an alert. During the session, the 15 minute chart shows price stalling inside the band instead of slicing through it, with smaller lower wicks and no strong bearish close below the zone.
Then the 5 minute chart prints a bullish engulfing candle inside the zone. That candle is the trigger, not the reason for the trade. The reason is location on the daily chart plus structure on the 15 minute chart. Your stop sits just below the zone low, where the idea is proven wrong, and position size comes from that distance.
Notice what didn't happen. You didn't drop to the 1 minute chart to squeeze out a slightly better price. For most beginners, that chart adds noise, raises trade count, and makes spread and slippage a larger share of every move. Reserve it for experienced scalpers who already know their costs and can execute without hesitation.
Write both timeframes into your plan in plain language. For example, entry timeframe is 5 minute, higher timeframe check is daily and 15 minute. If that sentence isn't written before the first live session, you'll timeframe hop after the first loss and call it analysis.
Session Workflow and Go-Live Test
A session should run the same way whether the first trade wins or loses. The founder's advice is to plan your trades and trade your plan, and that only works if the plan exists before the opening bell gives you something to chase.
The workflow below walks one hypothetical trade from preparation to review. Keep the sequence, even when you change symbols or markets.
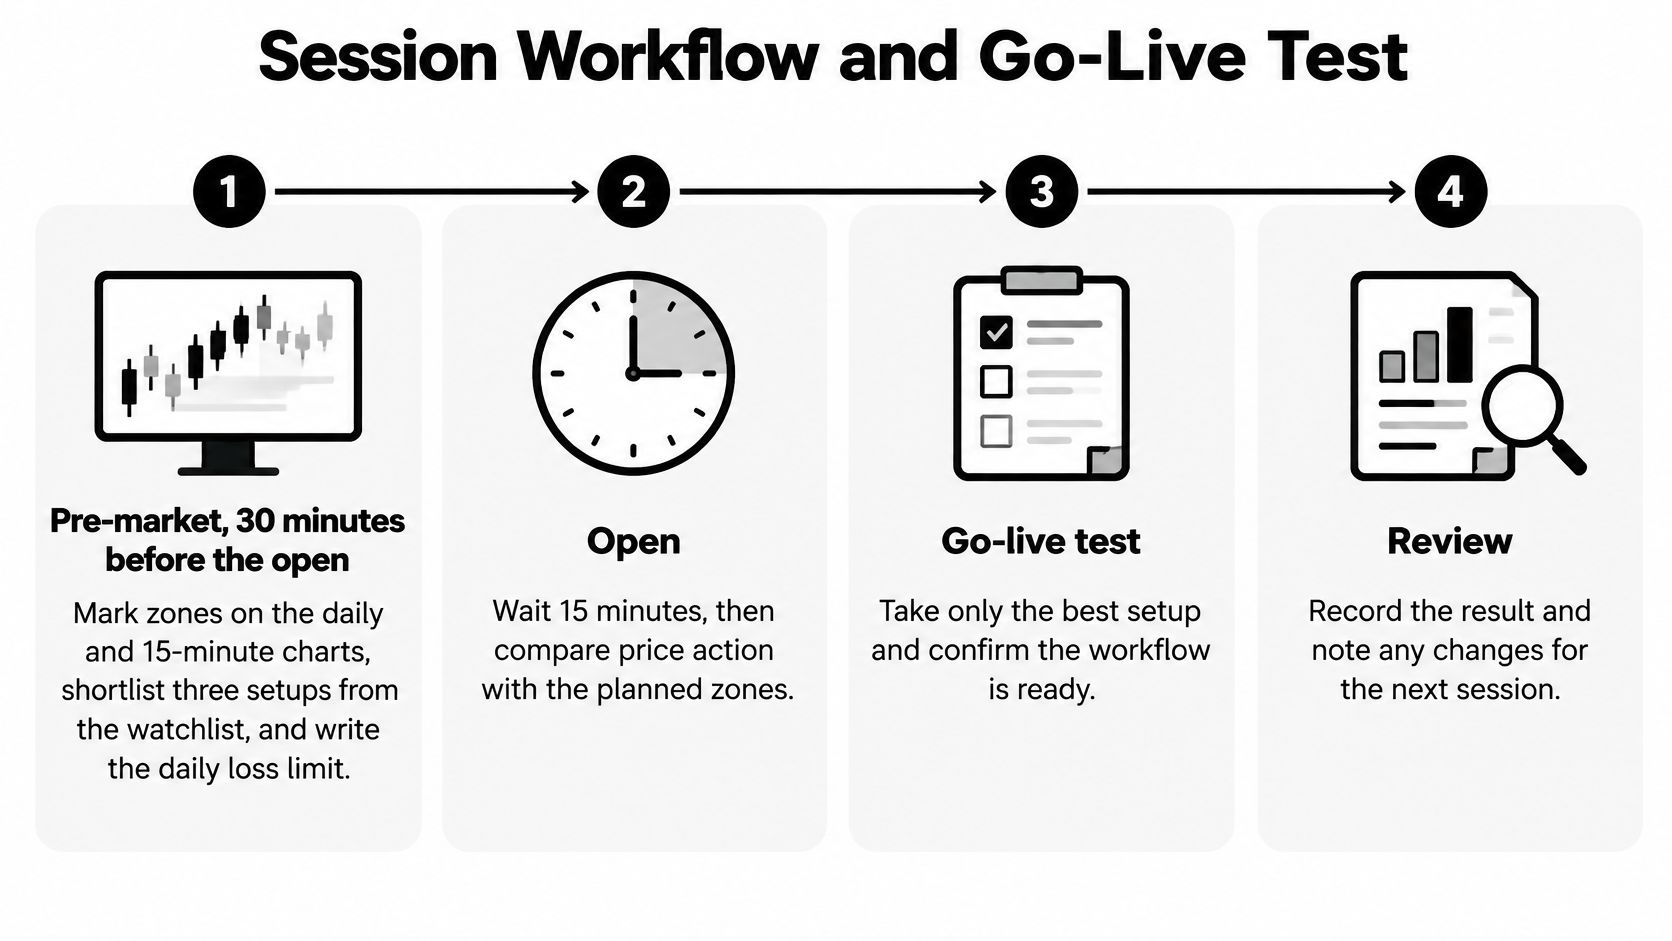
Run the Session in Order
1. Pre market, 30 minutes before the open. Mark zones on the daily and 15 minute charts, shortlist three setups from your watchlist, and write today's daily loss limit where you can see it. If a symbol has no clear zone and invalidation, it doesn't make the shortlist.
2. Open. Wait 15 minutes. Let opening orders clear and spreads settle, then watch how price reacts at a marked zone. Chasing the first vertical candle usually means your stop must sit so far away that size becomes either tiny or reckless.
3. Entry. Say a 5 minute bullish engulfing candle closes inside your zone. You enter on the next candle at 48.60 in this example, with the zone low at 48.20 and your stop at 48.10, which is 0.10 below the zone low. Risk is 0.50 per share.
With a hypothetical $10,000 account at 0.5% risk, your budget is $50, so size is 100 shares. Your target at the nearest resistance is 49.35, giving 0.75 of potential reward against 0.50 of risk, or 1.5 times the risk. If that reward doesn't justify the trade after costs, pass before entry, not after.
4. Management. Once price moves 0.50 in your favour in this example, move the stop to break even if that's your written rule. Exit if the zone breaks on a closing basis, even if the stop hasn't been tagged by a wick. Don't widen the stop to give it room. That phrase usually means the original idea failed and hope took over sizing.
5. Close. Log the trade immediately, including whether you followed the plan. Stop for the day when your daily cap is reached, and also stop when your shortlist is done. A finished plan is a valid reason to close the platform.
This short walkthrough shows the entry and management sequence in motion before you test it yourself.
The Go Live Test
Paper trade, or trade the smallest size your broker allows, for at least 20 trading days. You're testing the routine, not hunting a hot streak. Before any increase in live size, confirm four things.
- Orders worked as intended. Entries, stop moves, cancels, and exits all behaved the way you expected.
- The journal is complete. Every trade is logged with size, stop, result, and a plan compliance note.
- The daily cap held. You never broke the loss limit to chase a recovery.
- The morning check happened. Account type, rolling day trade count, and buying power were reviewed each session.
Scale only after two consecutive weeks pass all four checks. If one check fails, fix that process and restart the count. A profitable week with a broken cap isn't a pass. It means luck covered a structural flaw that will resurface at larger size.
The founder's closing advice is to plan your trades, trade your plan, be humble and always give back. Humility in a setup looks like small size, written limits, and proof from your own journal.
If you want structured training around this routine, the Day Trading Programme is a full length programme that teaches day trading and is open only to colibritrader.com subscribers. Use any programme the same way you'd use this workflow. Learn the method, test it on paper, measure costs, then decide whether live size is earned.
Build your day trader setup around clean price action, written risk limits, and a journal you keep, then prove the routine on paper before you scale. At Colibri Trader you'll find practical, indicator free training on supply and demand, position sizing, and disciplined day trading that fits the workflow above. Visit today, take the free Trading Potential Quiz, and start with the next small step your plan requires.