
Day Trading Terms Explained: Glossary with Examples
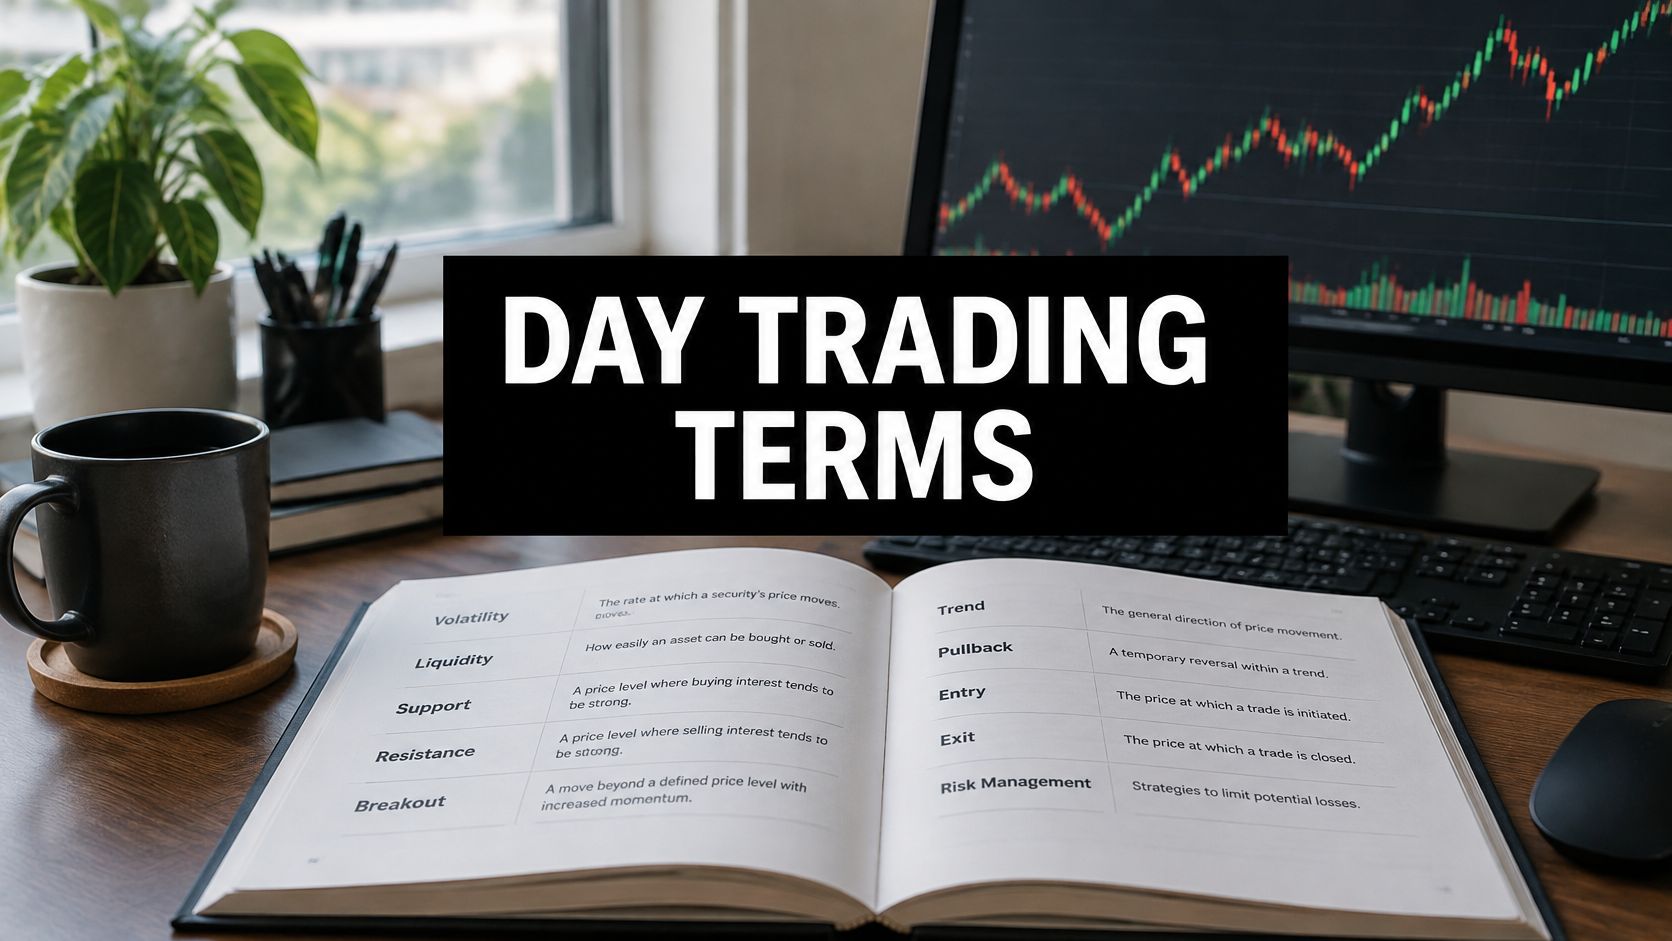
You're two minutes into the open. The quote shows a bid, an ask, and a last price that matches neither. The platform says one balance is available, settled cash says another, and your cursor is sitting on buy. The words on that ticket decide whether the next order fills, rests, or gets rejected.
Day trading terms aren't dictionary labels. Each one changes the next order you can send: the price you'll accept, the size the account will allow, and the exit that may not print where you drew it. Brokers, regulators, and charting platforms don't always use the same word for the same event. This guide uses the standard meaning, then shows what that meaning does to the trade in front of you.
Core Day Trading Terms at a Glance
Use this page as a lookup, not a lecture you have to read straight through. Every term in the table is defined in full in the section named in its last column, so you can jump to the definition that changes the order you're about to place.
Day trading means opening and closing a position inside the same session. The vocabulary falls into six groups: market and price, order book and shorting, orders and execution, account and regulation, chart setup, and risk and performance. One word can carry a different meaning in a rulebook, on a broker ticket, and inside charting software. This guide sticks to the standard meaning and flags the platform difference where it changes the next click.
| Term | Category | Defined in |
|---|---|---|
| Bid | Market and price | Section 2 |
| Ask | Market and price | Section 2 |
| Spread | Market and price | Section 2 |
| Volume and relative volume | Market and price | Section 2 |
| Liquidity | Market and price | Section 2 |
| Short sale | Order book and shorting | Section 3 |
| Trading halt | Order book and shorting | Section 3 |
| Limit order | Orders and execution | Section 4 |
| Stop order | Orders and execution | Section 4 |
| Slippage | Orders and execution | Section 4 |
| Buying power | Account and regulation | Section 5 |
| Margin call | Account and regulation | Section 5 |
| Pattern day trader | Account and regulation | Section 5 |
| Support and resistance | Chart setup | Section 6 |
| Breakout | Chart setup | Section 6 |
| Risk-to-reward ratio | Risk and performance | Section 7 |
Scan the category column, then open the section that defines the term you're unsure about. In 2025, day trading was the preferred investment strategy of 46% of respondents in an independent sample of 853,138 U.S. retail stock investors, published by Tyson Tips. A shared vocabulary is what keeps that crowd from sending the wrong ticket.
Market and Price Terms Every Day Trader Uses
The quote is a negotiation, not a single number. Bid is the highest price a buyer is offering right now. Ask is the lowest price a seller will accept. Spread is ask minus bid, and you pay it when you buy at the ask and later sell at the bid.
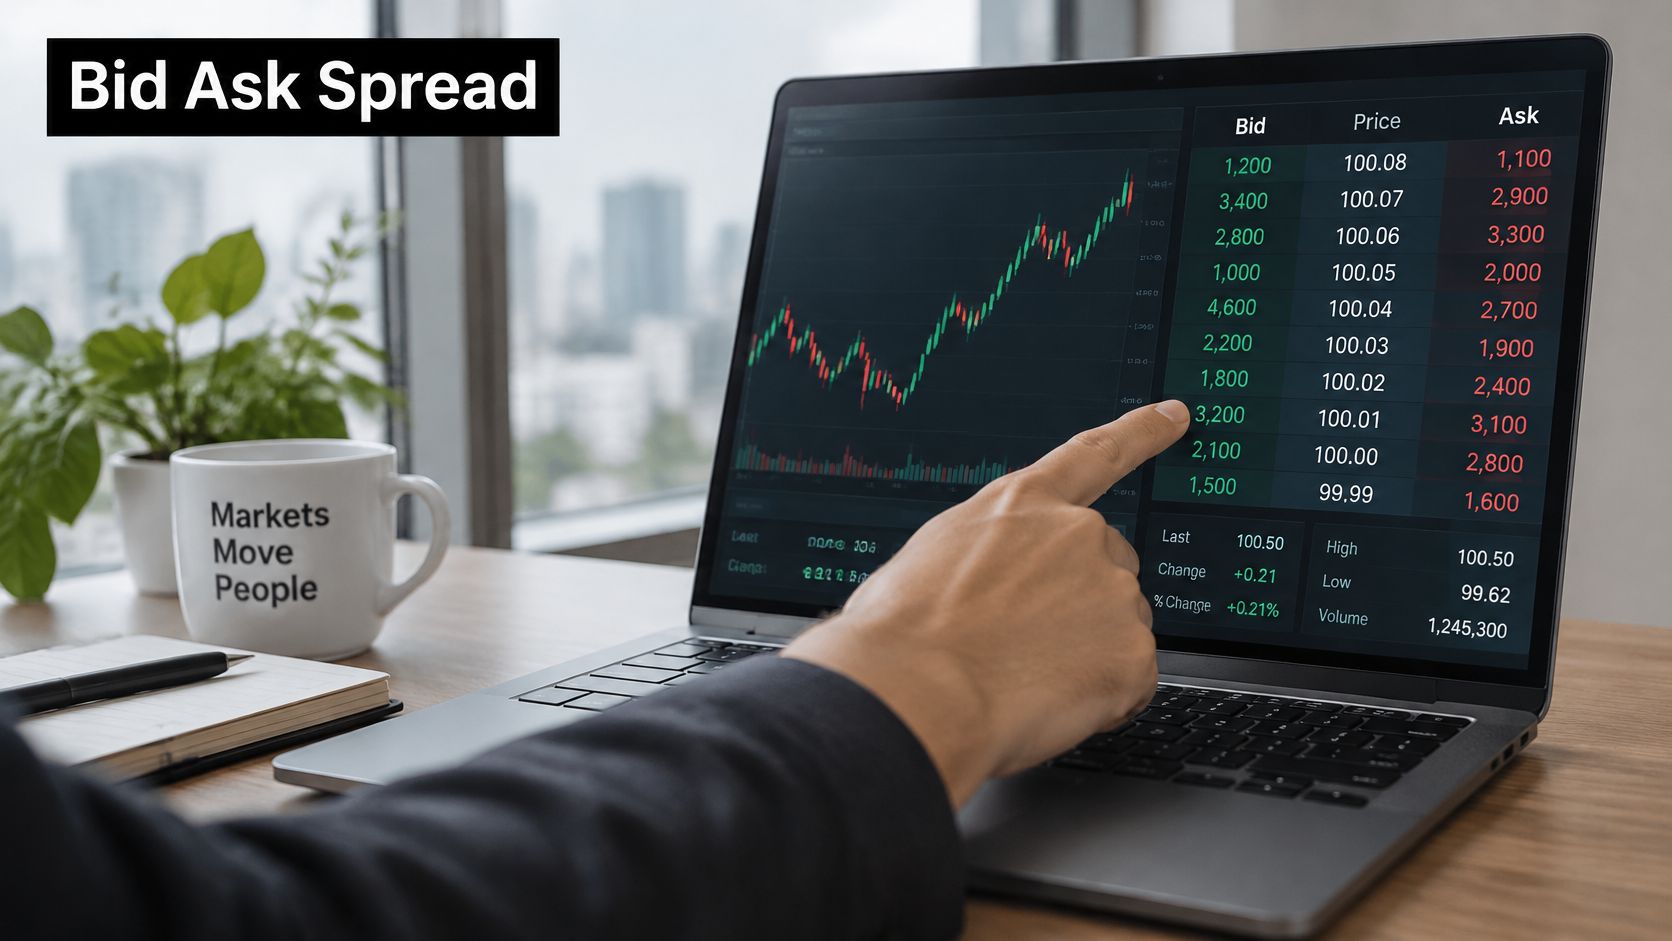
Say the bid is 50.00 and the ask is 50.02. The spread is 0.02, which is 0.04 percent of price. The same 0.02 on a 2.00 stock is 1 percent. On the cheap name, the spread can eat the whole planned move before commissions. A deeper walk-through of what the bid-ask spread does to your fill is worth reading before you size a low-priced name.
Last price is the most recent trade. It can print outside the current bid-ask range after a fast print or a stale quote. Don't use last as your entry price. Use the side you will hit.
Volume, float and how far price can run
Volume is the number of shares traded in a period. Relative volume (RVOL) compares today's volume with the average for the same time of day. An RVOL of 2x or higher is a common filter for names that are active, not just listed.
Liquidity is your ability to enter and exit a size without shoving the price. Thin liquidity widens the spread and leaves your order as the new bid or ask. Float is the shares available to trade. A low-float stock can jump on modest buying because there aren't many shares to absorb it.
Gap up and gap down compare the open with the prior close. Average true range (ATR) is a volatility gauge you can use to set a target that matches how far the stock usually travels, instead of a round number you like.
Practical rule: Convert the spread to a percent of price before you decide the stock is "cheap." A two-cent spread is noise at 50 and a real cost at 2.
Premarket and after-hours quotes use the same words and carry more risk. Spreads are wider, volume is thinner, and a print that looks like a breakout can vanish when the regular session opens. Treat those prices as a hint, not as the level you'll get at 9:30.
Order Book, Short Selling and Halt Terms
The single best bid and ask hide the rest of the crowd. Level 2 is a live list of resting bid and ask sizes at each price, so you can see depth beyond that top line. The same stacked-size idea shows up in other markets, and understanding crypto market depth from TradingList is a clear parallel if you also watch crypto books.
Time and sales is the tape of executed trades, with price, size, and time. A level that looks heavy on the book but never prints on the tape isn't support. It's a poster. Queue position is where your order sits among other orders at the same price. If you're last in a long queue, a touch of your limit may not fill you at all.
What a short actually commits you to
A short sale is selling shares you don't own, borrowed through the broker, with the aim of buying them back lower. Buying those shares back the same day is a round trip. Locate and borrow means the broker has to find shares before you can short. Hard-to-borrow names can carry a fee or be unavailable, which kills the trade before you click.
A short squeeze is a sharp rise that forces short sellers to buy back, and those buybacks add to the move. Say you short 25 shares at 12.00 and cover at 13.50. That's a loss of 37.50 dollars before borrow fees, on a stock that only moved 1.50.
A trading halt is an exchange pause after extreme volatility or news. The stock can reopen far from the last price. A stop that looked tight can fill well away from its trigger because the market skipped the prices in between. That's the halt risk every later order type has to live with.
Order Types and Execution Terms Explained
Every order picks a side of one trade-off: price control versus fill certainty. You decide that before you click, not after the print disappoints you.
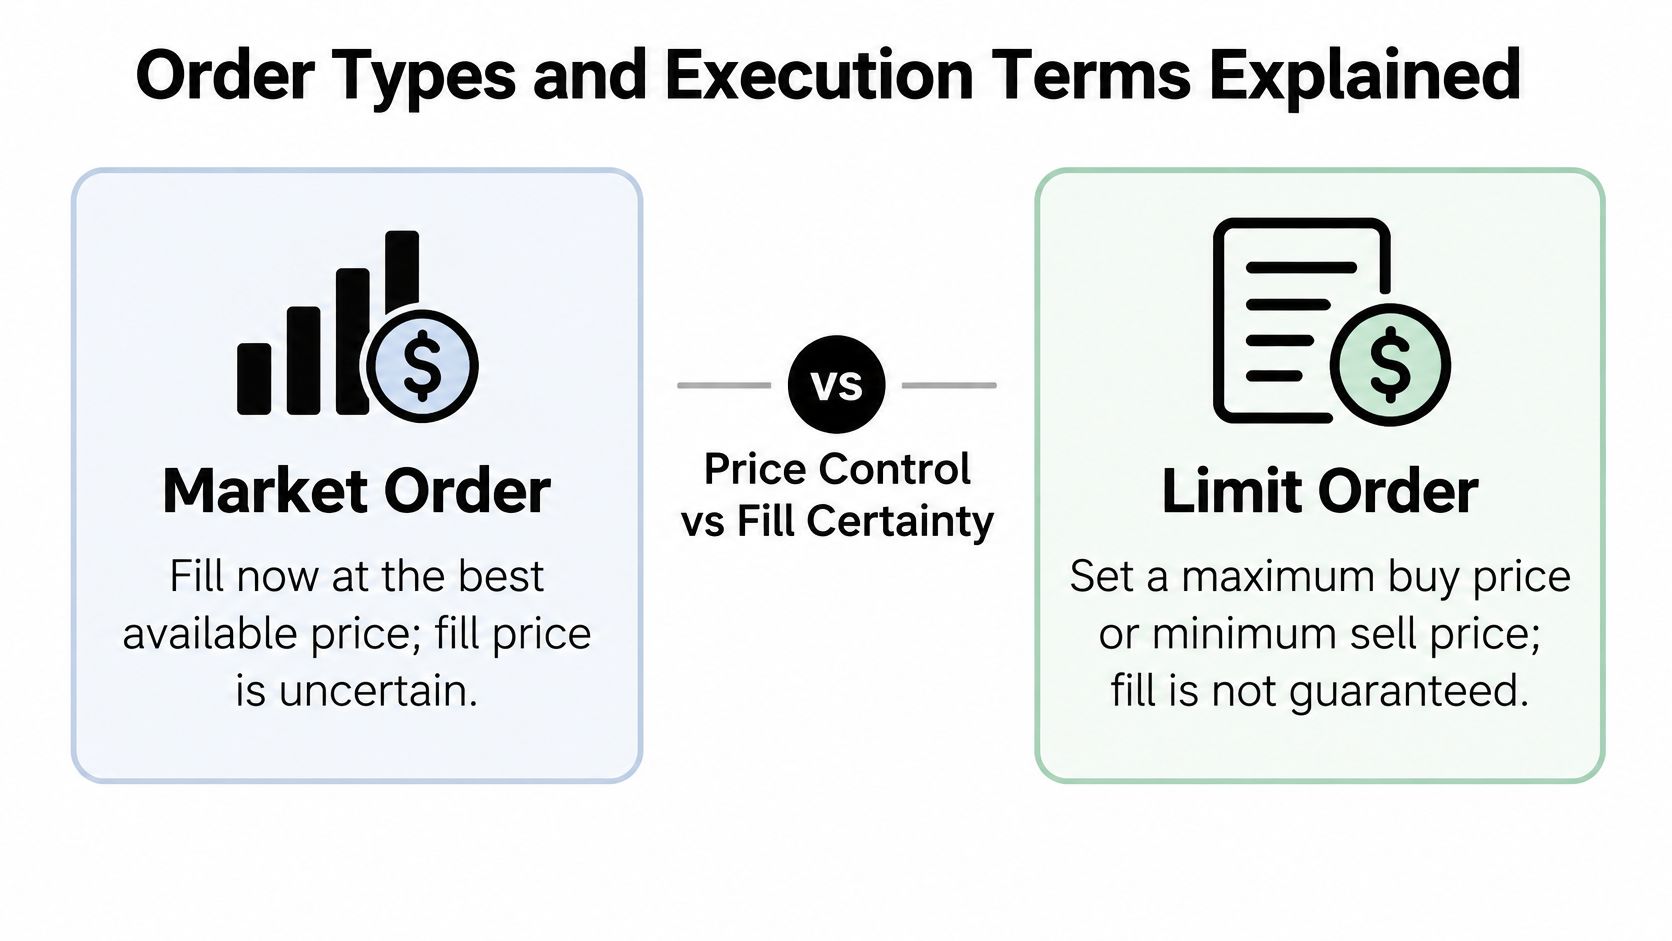
A market order says fill now at the best available price. You get the trade. You don't get a guaranteed price. A limit order sets the worst price you'll accept, a maximum for a buyer and a minimum for a seller, and it can sit until it fills, you cancel it, or it expires. If you want the mechanics in plain language, read what a limit order actually controls.
The CME Group glossary puts the same split in regulatory language: a limit order specifies the worst acceptable execution price, while a stop order activates at its stop price and then becomes a market order. Buy stops sit above the market. Sell stops sit below it. A stop-limit order becomes a limit after the trigger, so a fast move through that limit can leave you with no fill and no exit.
One quote, four different tickets
Say the stock is 20.00 bid and 20.05 ask.
- Market buy: You pay about 20.05, the price that's offered now.
- Limit buy at 20.02: You may never own the shares if sellers won't come down.
- Sell stop at 19.80: In a gap, the fill can print at 19.74, not at 19.80.
- Stop-limit: You might not get out at all if price runs through the limit.
Slippage is the gap between the price you expected and the price you got. Partial fills mean only some of the shares trade, so your risk is smaller than planned and your exit math has to shrink with it.
| Order type | Price control | Fill certainty | Main risk |
|---|---|---|---|
| Market order | None, fills at best available price | High, fills now | Slippage in fast or thin markets |
| Limit order | Full, sets the worst acceptable price | Low, may not fill | Missed trade when price moves away |
| Stop order | Partial, triggers then becomes market | High after trigger | Fill can be far from the stop price in a gap |
| Stop-limit order | Full after trigger, sets a limit | Low in fast moves | No exit if market moves through the limit |
Time in force tells the broker how long to keep working the order. Day dies at the close. Good-till-canceled can live across sessions. Immediate-or-cancel takes what's available and drops the rest. Fill-or-kill wants the whole size now or nothing.
A bracket sends the entry with a stop and a target. One-cancels-other (OCO) cancels the leftover order when one side fills, so you don't get stopped and targeted on the same shares. If capital for that ticket is still moving between chains, it helps to explore cross-chain bridging mechanics from Mayan before the session, so the funds arrive before the order needs them.
Stops prioritize getting you out after the trigger. They do not promise the exit price, especially in a gap or a halt.
Account, Margin and Regulatory Terms Explained
In U.S. securities markets, "day trading" is a regulatory status, not only a short holding period. The SEC's day trading publication defines a day trade as purchasing and selling, or selling and purchasing, the same security on the same day in a margin account. The rules apply to margin accounts and equity securities. A cash account, and markets under other regulators, don't follow this same test. A plain explanation of how margin trading is defined helps if the account type itself is still fuzzy.
The pattern day trader test
A pattern day trader is a customer who executes four or more day trades within five business days, when those day trades are more than 6% of the customer's total trades in that margin account during the period. That 4-in-5-days and greater-than-6% test is what turns on the higher requirement. The same SEC publication states that a pattern day trader generally must maintain at least $25,000 in equity, in cash or eligible securities, and may generally use buying power of up to four times the maintenance-margin excess from the previous business day. If equity falls below that minimum, day trading is restricted until the deficiency is corrected.
Buying power is the dollar amount of positions the account can open under that multiple. It is not the cash sitting in the account. Exceed it, and you can create a deficit even when the screen looked green at the open.
Settlement, the call, and the next order
A separate SEC day-trading note spells out the consequence of exceeding that buying power. The customer typically has five business days to meet the margin call. Buying power is restricted while the call is open. Miss it, and the account can be limited to cash-available trading for 90 days. A profitable strategy can still get shut down by excessive exposure or by trade count.
U.S. equity trades generally settle on T+1, the next business day, as FINRA's note on frequent intraday trading explains. Buy on Monday and sell the same day, and the cash from that sale settles Tuesday. Until then, "available funds," "settled cash," and "buying power" can all show different numbers on the same ticket. Reusing unsettled proceeds too fast is how a cash account picks up a violation.
FINRA has sought comment on whether the day-trading requirements remain effective, and a later proposal would replace the traditional pattern-day-trader framework, including the equity minimum and the day-trading buying-power calculation, with new intraday margin standards. Your broker can already be stricter than the written minimum. Rules also differ by country. Founders comparing regimes can read regulatory guidance for financial services founders from Glentorion before assuming a U.S. margin label travels.
If the equity is under the minimum, the next day trade is the problem, not the chart. Fix the balance before you look for a setup.
Chart and Price Action Setup Terms
Support and resistance are prices where buying or selling has repeatedly turned the market. Supply and demand zones are the broader areas around those turns, not a single perfect line. Levels are approximate. A break of a few cents can still be the same zone.
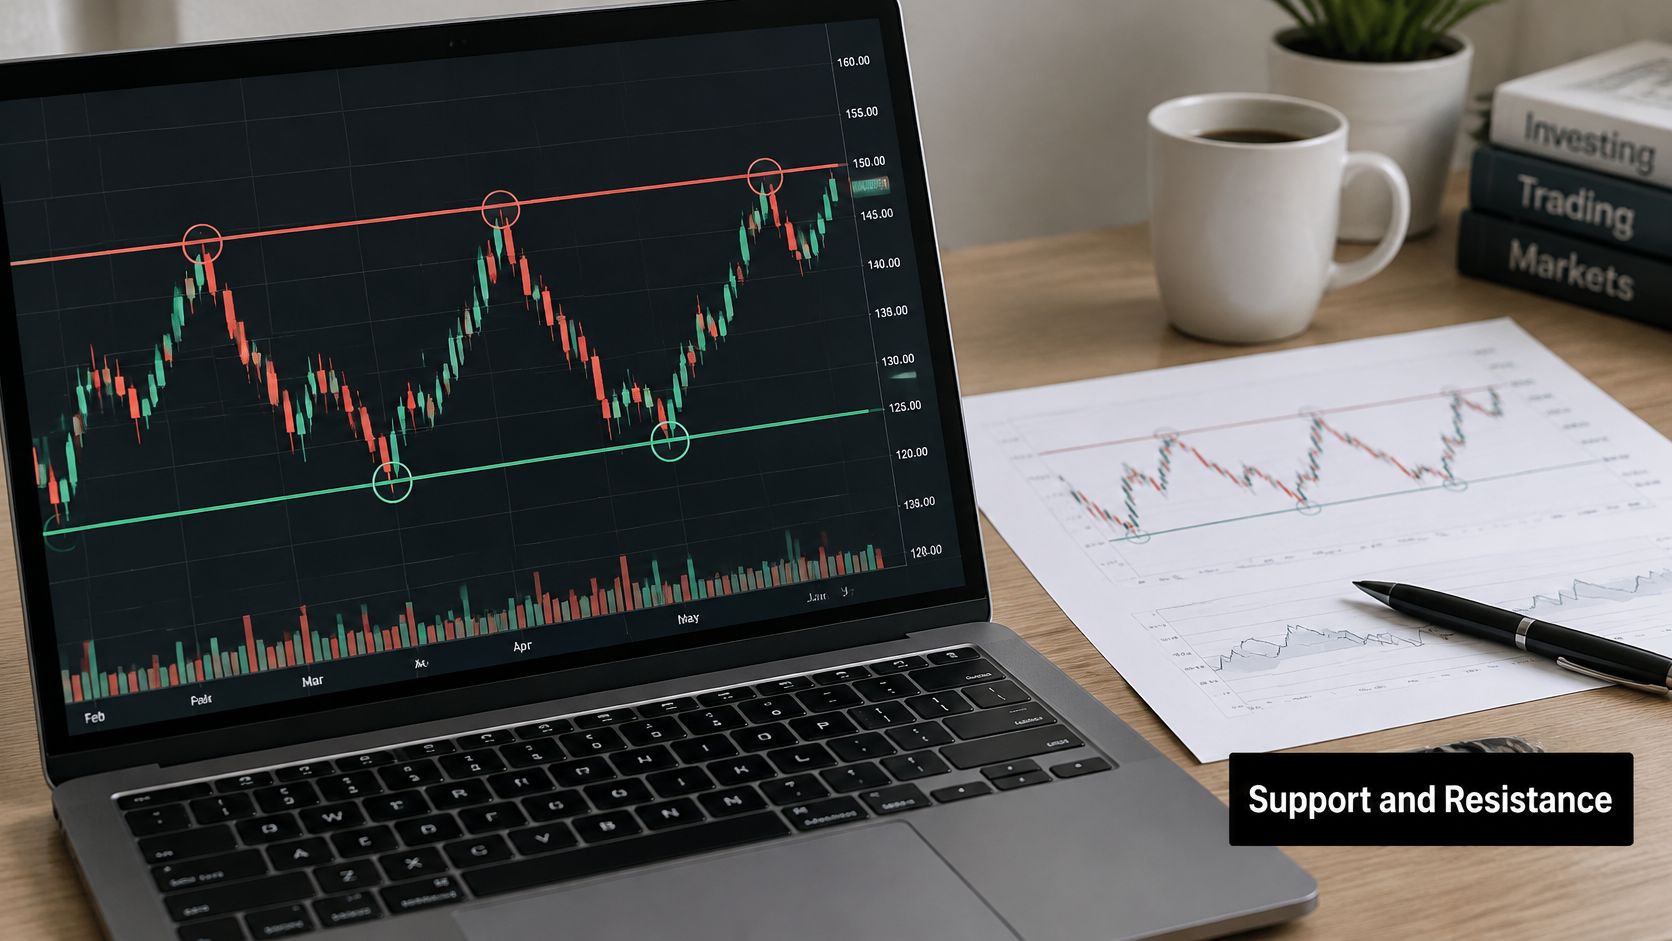
Walk one chart. A stock tests 10.00 as resistance three times and can't hold above it. Price then goes sideways. That sideways stretch is consolidation, or a range. While it's rising into the level with higher highs and higher lows, the background is an uptrend. An inside bar is a candle whose entire high-to-low range sits inside the prior candle. It's a pause, not a signal by itself.
The fourth push clears 10.00 and volume runs at twice the average for that time of day. That push through a defended level, with participation, is a breakout. Price comes back to 10.00 and holds. The old ceiling acting as a floor is the pullback, or retest. If price had poked above 10.00 and slipped straight back into the range, that failed push would be a false breakout, often called a fakeout.
Candle, close, and the point that kills the idea
A bullish engulfing candle is a green body that fully covers the prior red body. The shape matters far less than the location. The same candle in the middle of a range is noise. At support, after a selloff, it's a reason to define a trade. A reversal is a change in trend direction. A continuation is the trend resuming after a pause, which is what the retest of 10.00 is trying to be.
Read the chart in this order:
- Mark the level where price has already turned.
- Check volume against the usual pace for that time of day.
- Wait for the candle to close beyond the level, not just a wick through it.
- Write the invalidation point, the price that proves the idea wrong, before you enter.
A close is the filter that keeps a one-tick poke from becoming a trade. If you want to see that sequence on a live-style chart, this walk-through shows the level, the push, and the retest in motion.
The invalidation point is what you hand to the order ticket. Without it, support and resistance are drawings. With it, you know the price that should take you out.
Risk and Performance Terms With Worked Math
A pretty ratio doesn't pay the bills. The win rate you need just to break even falls as the reward side grows, and the table is the number to check before you call a setup "good."
| Risk-to-reward ratio | Breakeven win rate | Example on 100 dollars risked |
|---|---|---|
| 1:1 | 50% | Win 100 dollars, lose 100 dollars |
| 1:2 | 33.3% | Win 200 dollars, lose 100 dollars |
| 1:3 | 25% | Win 300 dollars, lose 100 dollars |
| 1:4 | 20% | Win 400 dollars, lose 100 dollars |
Risk-to-reward is potential gain divided by potential loss. Breakeven win rate is 1 divided by (1 plus the reward multiple). A 1:2 plan needs about one winner in three. A high ratio does not rescue a hit rate that sits under that line.
From a percent to a share count
Risk per trade is the share of account equity you can lose on one idea. One percent is a common cap. Stop distance is the gap from entry to that invalidation price, per share.
Say the account is 10,000 dollars and you risk 1 percent. That's 100 dollars. The stop is 0.50 below entry. Position size is 100 divided by 0.50, which is 200 shares. If the fill is worse than the planned stop, the dollar risk is no longer 100. A 0.05 miss on a 0.50 stop adds 10 percent to the loss, so the same 200 shares can lose 110 dollars. Size from the stop you can get, not the stop you drew.
Expectancy, R, and the day you stop
Expectancy is (win rate times average win) minus (loss rate times average loss). It tells you the average dollar result per trade if the sample holds. An R-multiple states that result in units of the initial risk. A winner that makes twice the amount you risked is +2R. A full stop is -1R. Logging in R keeps a 200-share trade and a 50-share trade on the same scale.
Maximum drawdown is the fall from an equity peak to the later trough. Profit factor is gross profit divided by gross loss. Above 1, the winners' dollars beat the losers' dollars. A daily loss limit is a cap that ends your session, so one bad morning can't become four revenge trades.
Judge the setup against the breakeven win rate in the table, not against how clean the level looks. A 1:4 idea with a thin hit rate still loses money.
Pitfalls and Pre-Session Checklist
Run these checks before the open. Each one blocks a specific misread, and none of them require a new definition.
- Confirm the account and the status. Open the broker dashboard and read account type plus pattern-day-trader status. Available funds, settled cash, and buying power are different fields. Trading the largest of the three is how traders get rejected mid-morning.
- Test the status the way the rule does. Pattern-day-trader treatment depends on the margin account, equity versus the minimum, and the share of trades that were day trades. Counting round trips alone can leave you surprised.
- Price the friction. Read bid, ask, spread, and relative volume, and turn the spread into a percent of price. Then look at Level 2 at your price. A tall volume bar doesn't mean your size can get out.
- Name the priority. Write whether this entry needs price or a fill. A stop is not a guaranteed exit. A gap can fill well through the trigger, and a stop-limit can leave you in the trade.
- Mark the kill price. Draw support, resistance, and the invalidation point. A breakout needs volume and a retest, not one close a penny through the level.
- Size from risk, then check the ratio. Position size comes from risk per trade and stop distance. Compare risk-to-reward with the breakeven win rate. A 1:4 plan with a 15% win rate loses money because breakeven for that ratio is 20%.
- Set the daily loss limit before the first trade, and stop when you hit it. Don't trade with money you can't afford to lose.
- Log the R-multiple and the terms you used. Review that log weekly for the same misread, such as market orders in wide spreads or stops placed inside the noise.
Our Day Trading Programme is a full-length programme that teaches day trading and is open only to colibritrader.com subscribers. The past performance of any trading system or methodology is not necessarily indicative of future results.
Colibri Trader teaches day trading through straightforward price action, so the words on your ticket match the level, the order, and the risk on the next trade. If you want that taught as a full subscriber programme rather than a pile of definitions, start with Colibri Trader. Bring one live setup and check it against the table, the breakeven rate, and the checklist before you send the order.