


Define Price Level in Trading: How to Spot Key Levels
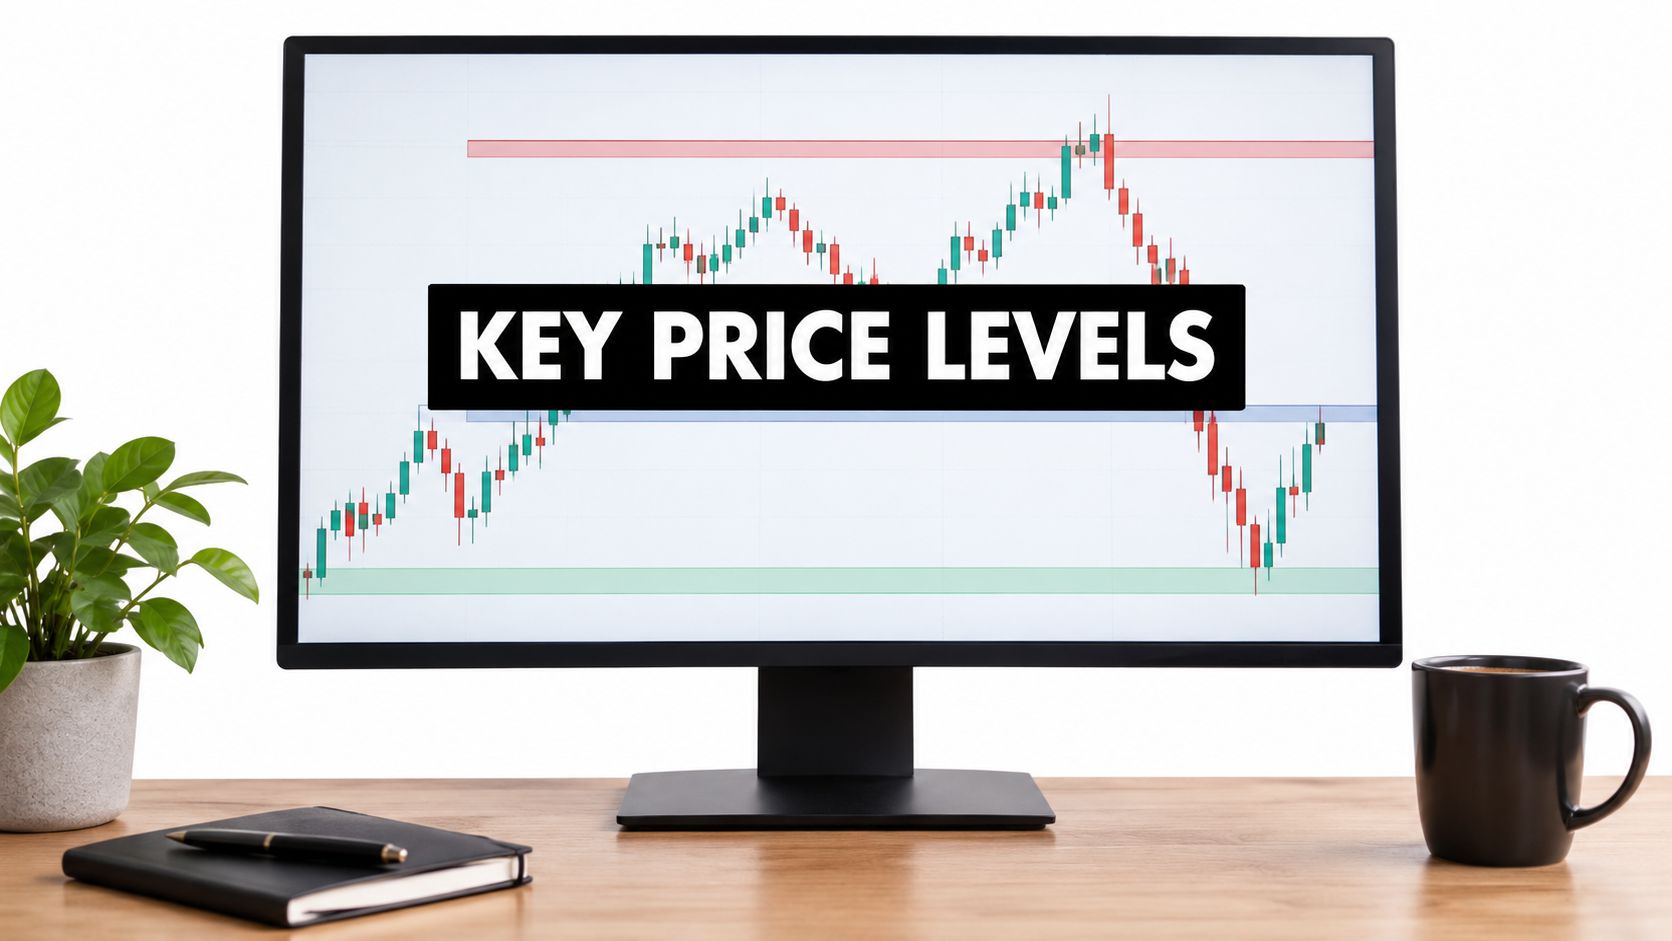
In price action, a price level is a price area where the market has repeatedly stopped, reversed or paused, and it's marked on the chart as support, resistance, or a supply or demand zone. If you've watched price bounce from the same place twice, then wondered whether you should draw a line there, trust it, or ignore it, that's exactly the problem a clear method solves.
You don't need more indicators. You need to know what you're marking, why other traders care about it, and how to tell a level worth trading from background noise.
What a Price Level Means in Price Action
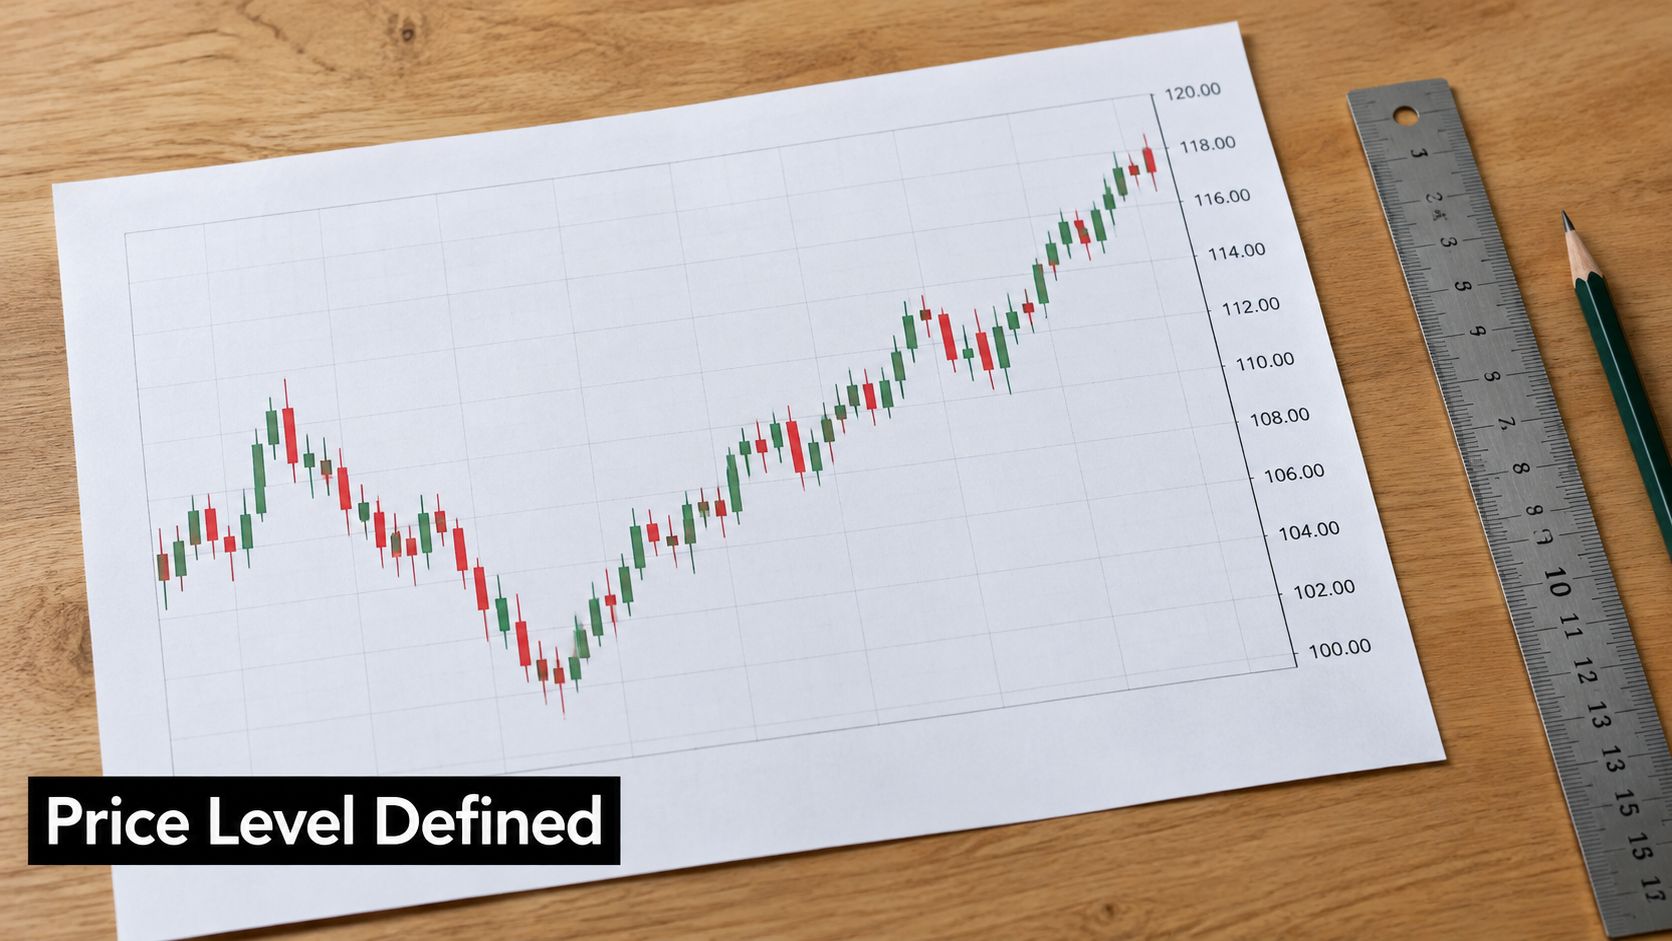
In price action, a price level is a price area where the market has repeatedly stopped, reversed or paused, so it works as a record of where buyers or sellers acted before. Think of it as a shelf a ball keeps bouncing off. The more often it bounces, the more people watch that shelf, and the more it matters when price returns.
The Five Terms You'll Mark
| Term | What It Marks | Typical Width | Example |
|---|---|---|---|
| Support line | Price floor where buying has repeatedly halted declines | Single price | Daily swing low that held three times |
| Resistance line | Price ceiling where selling has repeatedly halted rises | Single price | Daily swing high that capped rallies twice |
| Demand zone | Broad area where buyers have overwhelmed sellers | Price band | Base area before a sharp rally |
| Supply zone | Broad area where sellers have overwhelmed buyers | Price band | Red zone on the DAX where price jumped back down |
| Round number | Whole-number price where orders tend to cluster | Single price | EURUSD at 1.1000 |
Support and resistance are usually thin lines at one price. Demand zones and supply zones are broader bands because buying and selling rarely happen at one exact tick. If you want to place this chart work in a wider context, it's useful to compare fundamental and technical analysis before deciding how much weight to give each approach.
Treat a level as a zone of past order activity, not as a magic exact price. That one shift prevents most beginner mistakes with entries and stops.
Economists use the same phrase differently. In economics, a price level is the average level of prices for a defined basket of goods and services at a particular time, usually represented by an index rather than a currency amount, and the U.S. Bureau of Labor Statistics CPI history gives the example of an index rising from 100 to 125, meaning the measured basket costs 25% more than in the base period. A lower inflation rate means prices are rising more slowly, not that they've returned to earlier levels. From here on, price level means the trading meaning only.
Why Price Levels Shape Where Traders Act
A level matters because orders accumulated there. Buy orders often rest below a support area, and sell orders often sit above a resistance area. When price returns, some participants defend the same area, others close losing trades there, and new traders react to the same visible turning point.
That repeated behaviour is why price often reacts in the same place. The line doesn't cause the reaction. It records decisions lots of participants made before.

Three Practical Uses
- Reference points: Levels give you logical places to plan entries, stops and targets instead of choosing numbers from thin air.
- Invalidation: A level shows where your trade idea is wrong, so you can define risk before you enter.
- Direction memory: Levels show where the market last changed direction, which helps you read who's in control now.
Supply and demand describe the broader version of the same idea. A demand zone is concentrated in buyers, and a supply zone is concentrated in sellers. In the DAX example used to teach the supply and demand principle in trading, a red supply zone repeatedly sends price jumping back down. That tells you sellers aren't defending one tick. They're active across a band.
Watch how a level is built from swing points before you try to trade one.
When a Level Flips Role
When support breaks decisively and price later retests it from below, that old floor often acts as resistance. Broken resistance can flip the other way and act as support on a retest. Traders who bought at the old support may sell to exit near breakeven, and traders who missed the break may sell the retest, so the same area stays active for a new reason.
Support and resistance and supply and demand are close cousins. The main difference is width and the reasoning behind the band, not a completely different market force.
How to Mark a Price Level on Your Chart
Work from the big picture down. If you start on a tiny chart, you'll mark every small pause and end up with a chart you can't read.
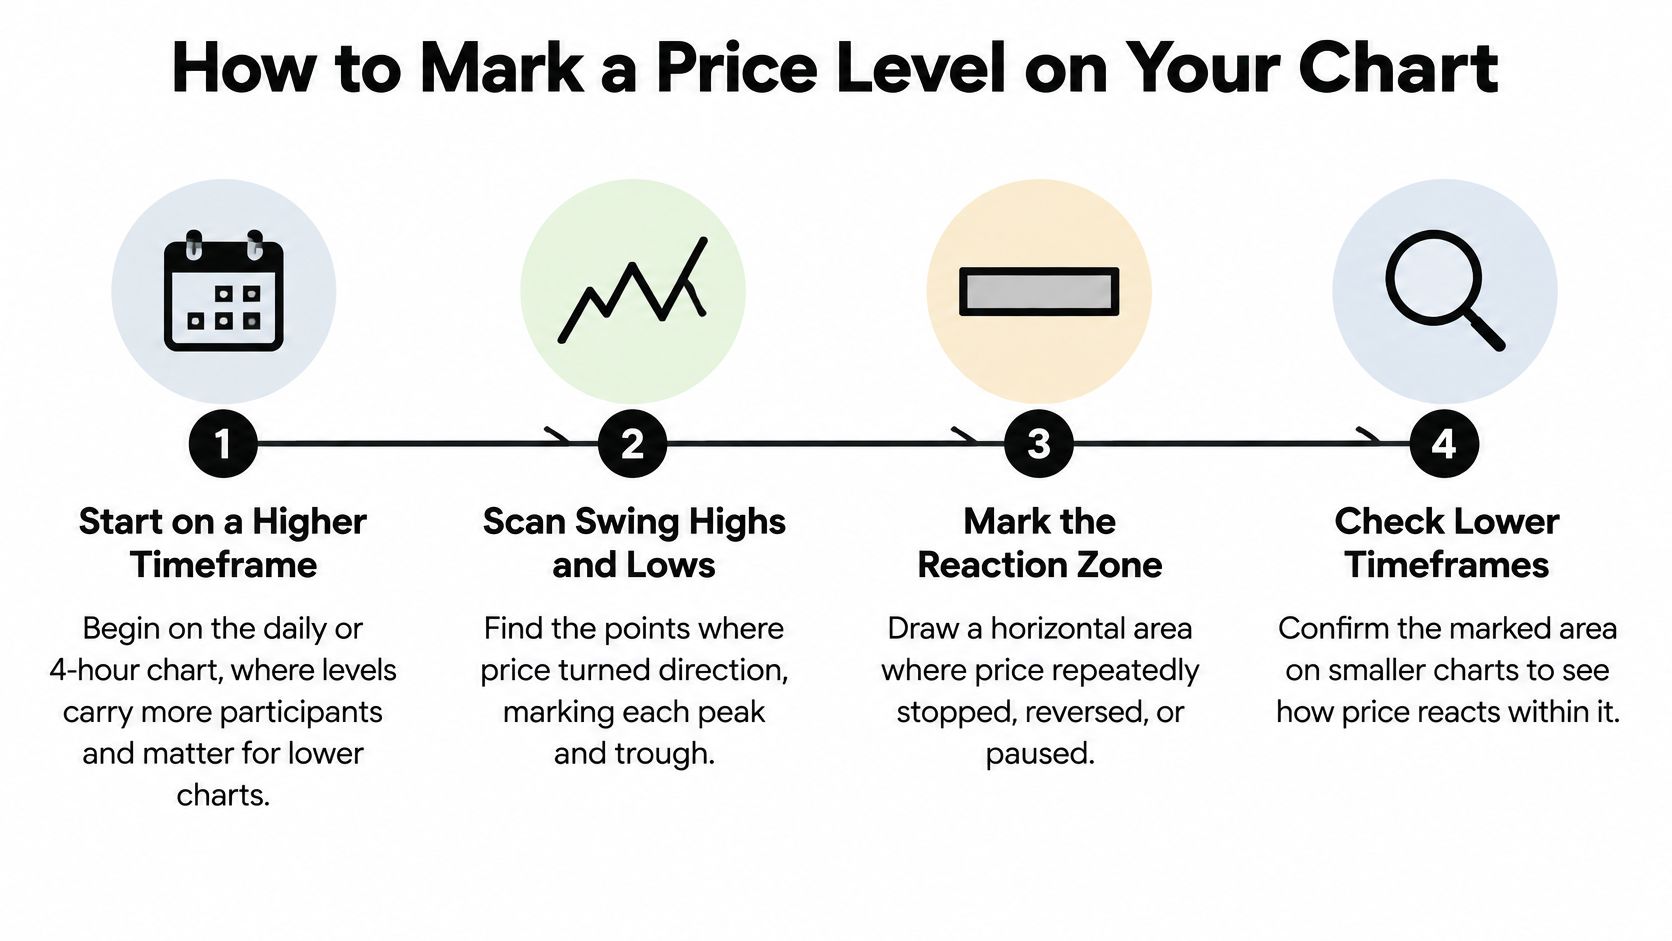
A Seven Step Marking Routine
- Start higher: Open the daily or 4-hour chart first. Levels there involve more participants, so they usually matter when you drop to a lower chart. Reading them alongside market structure analysis for swing points helps you separate a real turn from a minor pause.
- Scan swing highs and lows: Find points where price turned sharply and moved away. Mark each clear peak and trough before you draw anything.
- Require repetition: Look for at least two swings at similar prices, then draw a horizontal line through them. Choose wicks or bodies as your reference and stay consistent, because switching mid-chart creates false precision.
- Draw zones from the base: For supply or demand, find the last consolidation before a sharp move away. Draw the box from the body range of that base to the wick extreme, so the band covers where orders likely sat.
- Add round numbers lightly: Mark prices such as 1.1000 or 150.00 with a lighter line. Many orders cluster there, but a round number alone isn't as strong as a round number that also has repeated reactions.
- Confirm on your entry timeframe: Move down and check whether price still reacts around each level there. Keep levels that matter at both scales and demote the ones that disappear.
- Label and prune: Write the origin date and number of reactions beside each level. Delete levels that haven't been tested for months or no longer produce a reaction, so your chart stays usable.
The Visibility Check
Step back and look at the clean chart before you draw. A real level should be visible without the line because price clearly turned there more than once.
Practical rule: If you have to squint, stretch a line sideways, or force it to touch a wick, it probably isn't a level worth keeping.
Don't mark every swing. You're building a short map of places where you'll make decisions, not a history of every move price ever made. Three or four clear levels near current price will guide you better than twenty faint ones spread across the screen.
Telling Strong Price Levels From Weak Ones
No single clue makes a level strong. Score it across several criteria, then keep only the highest scoring levels on your chart.
| Criterion | Stronger Level | Weaker Level | Why It Matters |
|---|---|---|---|
| Number of reactions | Price turned at the level three or more times | Turned once or twice | Repeated reactions show ongoing interest |
| Timeframe | Visible on the daily or weekly chart | Only on the 5-minute chart | Higher timeframes involve more participants |
| Reaction strength | Sharp move away with large candles | Slow drift with small candles | A fast departure suggests aggressive orders |
| Recency | Tested within recent months | Last touched a year ago | Old orders may no longer be present |
| Zone width | Tight band, a small fraction of the daily range | Wide band covering most of a day's range | Wide zones give vague entries and stops |
| Clean break | Not yet broken, or broken and retested and held | Broken and passed through without a retest | Broken levels can flip their role |
How to Read the Score
Say one level has been tested four times on the daily chart and each test produced a large rejection candle. Another was touched once on a 15-minute chart and price drifted away slowly. The daily level deserves far more attention, even before you look for an entry signal.
Number of reactions shows whether participants keep returning. Timeframe matters because a daily swing reflects more orders than a brief pause on a small chart. Reaction strength matters because a sharp departure suggests one side acted aggressively rather than running out of momentum.
Recency is a filter many beginners skip. Orders from a level last touched a year ago may have been cancelled, filled or moved. It can still react, but you shouldn't assume the same interest is waiting.
Keep zone width narrow enough to act on, ideally a small fraction of the average daily range. A wide zone makes your entry vague and forces a distant stop, which damages your reward to risk before the trade starts. Adding other evidence at the same price, the idea behind confluence in trading decisions, can help, but it doesn't rescue a sloppy wide zone.
A clean break needs care. A broken level isn't automatically invalid, and it isn't automatically a flipped level either. Wait for a retest and a hold from the other side before you treat it as support becoming resistance, or the reverse.
Score each candidate with a clear eye, keep the three or four best, and ignore the rest until price gives you a reason to redraw.
Price Level Examples From Colibri Trader Methodology
A good example is a small story with three beats: where orders clustered before, how price behaved when it returned, and the point where the idea stops being valid. A level works like a busy doorway: the useful information is where traffic kept pausing and turning; one painted stripe is too precise.
A Supply Zone on an Index
Take an index chart where rallies keep stalling inside the same broad band. Sellers appear there again and again, and each visit ends with a quick push down. The repeated fast departure is what gives the zone weight. The colour of the box is only a label.
A single line would be less useful here because price does not stop at one exact tick each time. The band captures the whole area where sellers step in. On your chart, check the width first, then count how many visits ended with a fast exit rather than a slow drift. If price pushes through, closes beyond the band, and holds there on a retest, treat the old supply idea as finished until a new reaction proves otherwise.
The BOSS Pattern on a Currency Pair
BOSS is short for Bullish On Strong Support. The pattern is a bullish engulfing candle forming on a strong support level, ideally on the level or slightly below it. Location comes first, and the candle only confirms what the level already suggests.
On a EURUSD chart, mark a demand zone where earlier declines stopped and buyers forced price upward. When price returns, an inside bar may pause inside the zone before an engulfing candle closes upward. The entry logic is the meeting of two pieces of evidence: buyers acted there before, and they are acting there again now.
Where the candle forms matters more than its name. A perfect engulfing candle in the middle of nowhere carries far less information than an ordinary rejection at a major level.
That idea is invalidated by a decisive close below the demand zone with no quick recovery. Mark the zone before the candle forms, then ask whether the reaction started inside it or far away from it.
An Illustrative Daily Support Trade
Say a currency pair has a support line tested three times on the daily chart, with each test producing a clear bounce. You draw it as a narrow zone, wait for price to return, and look for a confirming bullish candle inside the band. Your stop sits just below the zone, and your target sits at the next resistance level above.
This is an illustration of structure rather than a forecast. If price slices through the zone and closes below it, the support idea is wrong and you exit rather than hoping. Your check is simple: was the level respected before, did price confirm this time, and is there enough room to the next level to justify the stop distance?
Across all three examples, the level does the planning work. The candle only tells you when participants are acting there again.
Pitfalls and Pre-Trade Confirmation Checklist
The most common mistake is marking levels after the move to justify a trade you already want to take. You see price bounce, draw a line at the low, and suddenly the chart looks obvious. That backward process teaches you nothing about whether you'd have spotted the level in advance.
Mark levels before price reaches them and record them in a journal or screenshot. Then you can judge whether price reacted where you expected. This habit is central to how we teach naked charts in The Price Action Method, a course that teaches trading with Price Action using naked charts.
Pitfalls With a One Line Fix
- Too many levels: Keep only the top three or four near current price, so every line on your chart has a purpose.
- Treating a level as exact: Use a zone with a small margin, because wicks often overshoot before price turns.
- Ignoring trend context: Give support less weight in a strong downtrend than in an uptrend, since repeated tests in a falling market can signal weakening buyers.
- Trading every touch: Wait for a confirming candle, such as a BOSS-style engulfing pattern on support, instead of buying the first tick into the zone.
- Using one timeframe only: Check the daily chart for the level and your entry chart for the reaction, so you're not trading a minor pause against a major level.
- Forgetting broken levels: Keep a broken level on watch until it's tested from the other side, because it may flip role.
None of these fixes requires a new indicator. They require fewer lines, drawn earlier, with a clear reason for each one.
Your Pre-Trade Checklist
Run through these six items before you enter. If any item fails, wait rather than force the trade.
- Higher timeframe level: The level is marked on the daily or 4-hour chart, not only on your entry chart.
- Strength score: It scores well on most criteria, including reactions, recency and a tight width.
- Confirmation: Price reacts at the level with a confirming candle, rather than drifting through it.
- Stop placement: Your stop sits beyond the zone, not on the exact line where a normal wick can remove you.
- Target placement: Your target sits at the next opposite level, with enough room to justify the risk.
- Defined risk: You know your position size and maximum loss before entry, not after price moves against you.
A level tells you where to pay attention. Confirmation tells you when to act. Confusing those two jobs is how traders enter early and blame the level.
A Two Week Practice Drill
Pick one currency pair or one index and stick with it for two weeks. Mark your levels at the start of each week, then log every time price reaches one, what candle formed, whether the level held, and how far price moved to the next level.
At the end of the two weeks, compare your log with the strength criteria. You'll usually find that your best reactions came from recent, higher timeframe levels with sharp prior departures, and your worst came from lines you added in the moment. That personal evidence teaches you faster than memorizing definitions.
If you want guided reading while you practise, the first two chapters of The Ultimate Price Action Trading Guide are sent free to anyone who enters their email address. Use the chapters alongside your log, and test each idea on your one chosen market before you add another.
To build this level marking routine into a complete naked chart method, explore the courses and free chapters at Colibri Trader and start with the material on support, resistance and supply and demand. Mark one market for two weeks, score every level before price arrives, and let your own log show you which levels deserve your capital.