


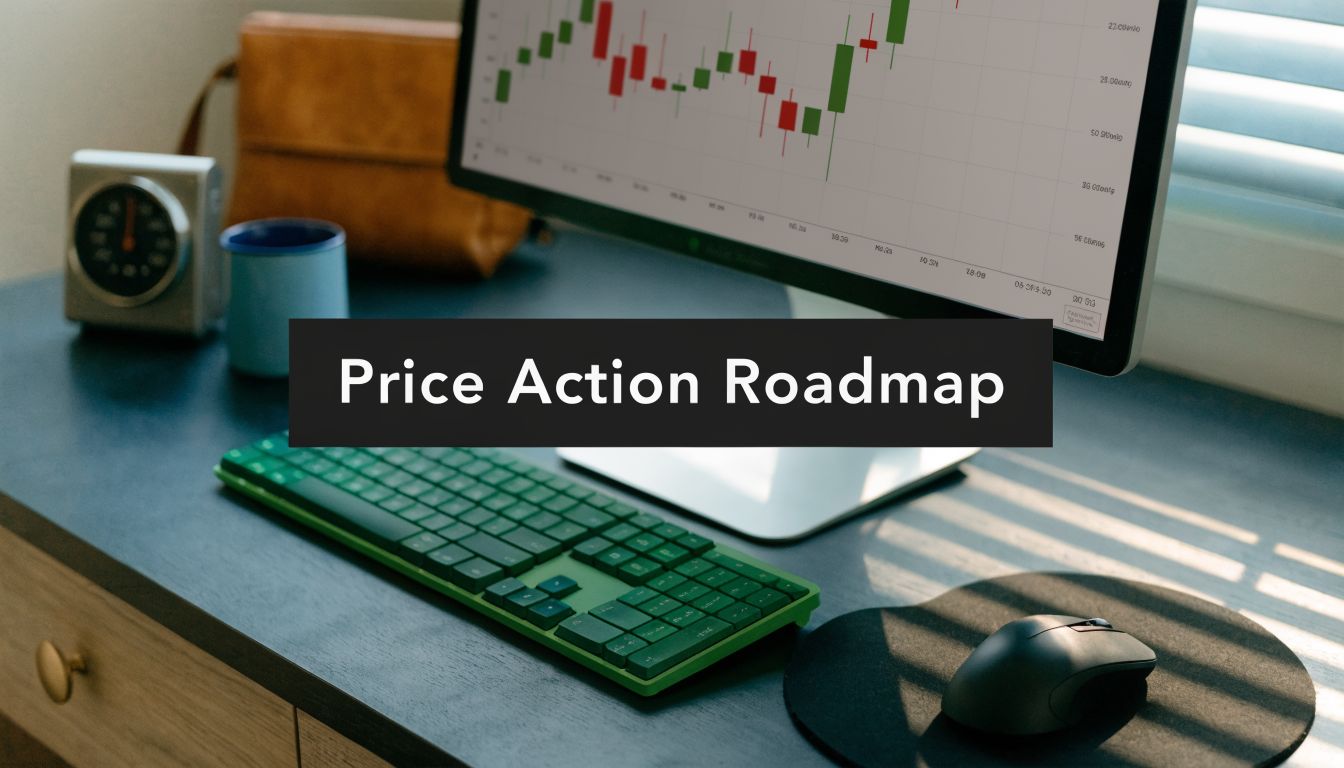
Best Way to Learn Trading: A Price Action Roadmap
You’re probably in one of two places right now. You’ve either started trading and already feel buried under indicators, YouTube strategies, and conflicting opinions, or you haven’t started because the whole thing looks more confusing than it should.
That confusion isn’t your fault. Most beginners get pushed toward setups before they understand what price is doing, why levels matter, or what buyers and sellers are telling them on the chart. The result is predictable. They keep changing indicators, keep second-guessing entries, and call it “learning” when they’re really just collecting noise.
The best way to learn trading is simpler than commonly perceived. Start with price action, build one repeatable process, practice it long enough to gather real evidence, and treat risk management as part of the strategy, not as an afterthought.
Beyond the Hype a Realistic Path to Trading Mastery
New traders usually begin with the wrong question. They ask, “Which indicator works best?” That question sends them straight into the mess.
Most trading education leans hard on technical indicators and advanced tactics, while beginners still struggle with the basics of how price moves and why levels matter. That gap is described well in this discussion of how people learn trading and where they get stuck. The problem isn’t a lack of information. It’s that the information often arrives in the wrong order.
Why the usual path fails
If you start with indicators, you borrow someone else’s interpretation before you can read the chart for yourself. That makes you dependent. The moment conditions change, you freeze.
Price action fixes that because it puts your attention on the raw material of trading:
- Price movement
- Market structure
- Reaction at key levels
- Momentum and rejection
- Context, not just signals
A trader who understands price can adapt. A trader who only understands indicators usually can’t.
Most beginners don’t need more tools. They need fewer tools and better observation.
What a realistic learning path looks like
A good learning path isn’t exciting. That’s one reason people avoid it. It involves repetition, note-taking, chart review, and a lot of screen time spent doing simple things well.
Here’s the sequence that works:
- Learn how to read a chart
- Study support, resistance, and structure
- Practice one or two price action setups
- Log every trade
- Review mistakes without ego
- Go live only after your process holds up in practice
That’s slower than chasing a “holy grail” strategy. It’s also how skill gets built.
If you want a starting point that helps you assess where you are before you begin, taking the Trading Potential Quiz on Colibri Trader can help you identify whether your main issue is knowledge, discipline, risk control, or consistency. That matters, because a trader with a chart-reading problem needs a different fix than a trader with an impulse problem.
Building Your Foundation on Price Action Not Indicators
If you can’t read a chart, you can’t trade with confidence. Everything else sits on top of that skill.
Reading and interpreting charts is the foundational skill technical traders need before they build any system. The common chart types are line, bar, and candlestick, and chart analysis reflects the push and pull of supply and demand, as explained in Charles Schwab’s guide to reading stock charts and trading patterns.

Read the chart like a story
A clean chart tells a story. Price pushes up, stalls, pulls back, tests a level, rejects, breaks, or fails. That’s not random decoration. It’s evidence of buyers and sellers making decisions.
When you look at a chart, ask:
- Who’s in control right now? Buyers or sellers?
- Where did price react before?
- Did price leave that area quickly or drift away slowly?
- Is the market compressing, expanding, or rejecting?
Those questions matter more than stacking another oscillator at the bottom of the screen.
What support and resistance really mean
Beginners often draw support and resistance as neat lines and stop there. That misses the point. These levels matter because traders remember them. They mark areas where one side previously took control.
A useful way to think about them:
| Concept | What it means on the chart | What it means psychologically |
|---|---|---|
| Support | Price stopped falling and bounced | Buyers saw value or sellers lost control |
| Resistance | Price stopped rising and turned down | Sellers stepped in or buyers hesitated |
| Breakout | Price pushes beyond a level | One side overpowered the other |
| Retest | Price comes back to the broken area | Traders test whether the break is real |
Don’t treat these as exact numbers. Treat them as zones where decisions get made.
Supply and demand are where the fight happens
Supply and demand zones are just a sharper way of thinking about reaction areas. If price leaves an area with force, pay attention. That tells you orders were concentrated there.
What matters is not that a rectangle exists on the chart. What matters is how price behaves when it returns.
Practical rule: Strong moves away from a zone matter more than pretty drawings.
If you want a structured explanation of these concepts, this guide on price action meaning is a useful reference for learning how to read the market without leaning on indicator clutter.
Candlestick patterns are clues, not commands
A pin bar, engulfing candle, or rejection wick doesn’t mean “buy” or “sell” by itself. It only matters in context.
A rejection candle at a major level after an extended move can be useful. The same candle in the middle of a messy range is often meaningless.
That’s how seasoned traders think. Not, “I saw a pattern.” But, “I saw a pattern at a level that matters, in a market structure that supports the idea.”
For traders who want a more structured way to learn these basics, the free first two chapters of Colibri Trader’s Amazon bestseller on price action can serve as a focused study tool. That’s a better use of time than bouncing between random videos that all define the same setup differently.
Structured Practice in a Risk-Free Environment
Demo trading gets dismissed too often, usually by people who use it badly. A demo account isn’t there to make fake money. It’s there to build habits you can repeat under pressure later.
That changes how you use it. You’re not trying to feel good. You’re trying to collect evidence.

What demo trading is actually for
A proper demo phase helps you answer a few hard questions:
- Can you follow rules without improvising?
- Can you identify your setup consistently?
- Can you hold a trade according to plan?
- Can you take losses without changing your method?
If the answer is no, going live won’t solve it. It will just make the lesson more expensive.
Research on trade sample size makes this point painfully clear. Convergence to a desired 70% win rate appears after about 1,000 trades, and getting within 1% of expected results with 95% confidence requires about 9,603 trades, according to Option Alpha’s article on probability theory and trade sample size. That’s why traders need thousands of repetitions before they trust a strategy.
A simple workflow that builds skill
Most beginners need a process they can follow every day. Keep it plain.
Pick one market and one timeframe
Don’t jump between everything. Stay focused long enough to notice repeated behavior.Define one setup
For example, a pullback into a key level with clear rejection and structure support.Take screenshots before and after
You need a visual record. Memory gets selective.Write down the reason for entry
If you can’t explain the trade in one or two sentences, you probably didn’t have one.Log the exit and outcome
Not just profit or loss. Record whether you followed the plan.Review at the end of the week
Look for patterns in mistakes, not just in wins.
What your trade journal should include
You don’t need a complex spreadsheet at first. You need useful fields.
| Field | Why it matters |
|---|---|
| Market and timeframe | Helps you see where your setup works best |
| Entry reason | Forces clarity before the trade |
| Stop placement | Shows whether your risk was based on structure |
| Target logic | Keeps exits consistent |
| Outcome in R | Makes results comparable |
| Rule-following note | Distinguishes bad trading from normal losses |
Using R is important because it standardizes performance. A strategy only becomes meaningful when you can compare trades on the same risk basis.
Manual backtesting speeds up learning
Manual backtesting is one of the fastest ways to train your eyes. Scroll back on the chart, hide the right edge, and mark where you would enter, where the stop would go, and where the target would sit.
That process teaches pattern recognition far faster than waiting for one live setup a day. It also exposes a common beginner problem. Many traders think they have a setup, but once they test it over many charts, they realize they were only remembering the clean examples.
For traders who need a place to start with paper practice, this guide to a demo trading account is a practical entry point.
If you don’t track your trades, you’re not practicing. You’re just participating.
Mastering Risk and Your Own Psychology
Most traders think their main problem is entries. It usually isn’t.
They enter too big. They move stops. They take trades that don’t fit the plan. They revenge trade after a loss. Then they blame the setup. That’s why risk management and psychology aren’t side topics. They decide whether your method survives contact with the market.

Risk-reward matters more than ego
A lot of beginners chase a high win rate because losing feels bad. That instinct wrecks accounts.
Profitability correlates more strongly with risk-reward ratio than with win rate. TraderLion notes that trend-following systems produced strong growth with win rates of only 25% to 50% because winners were much larger than losers, and it cites 2:1 as a practical benchmark for risk-reward in its guide to trading strategies for beginners.
That one idea should reset how you think. A trader can be wrong often and still make progress if losses are controlled and winners are allowed room.
What good risk control looks like in practice
Use structure to define risk. If your stop doesn’t sit behind a level that invalidates the trade idea, it’s just a random line.
A solid pre-trade checklist often includes:
- Location first. Is price at an area that matters?
- Invalidation point. Where is the idea wrong?
- Target realism. Is there enough room for the trade to justify the risk?
- Position size. Can you take the loss without emotional damage?
Many traders get exposed at this point. Their chart analysis might be decent, but their size is too large for their emotional control.
The psychological traps that keep repeating
These are the usual ones:
- FOMO. You chase because price moved without you.
- Revenge trading. You try to get back what the last trade took.
- Analysis paralysis. You see too much and do too little.
- Outcome obsession. You judge every trade by money, not execution.
Each one pushes you away from process and toward impulse.
One practical fix is to reduce decision points. Trade one setup. Trade at specific times. Limit the number of charts you watch. If overthinking is a recurring issue, this resource on how to stop overthinking can help you recognize the thought loops that bleed into trading decisions.
Here’s a useful explanation to revisit when mindset starts interfering with execution:
Discipline is built before the trade
Successful traders prioritize discipline before entering a position. Waiting until a trade is live is too late. Discipline must be built into the rules established before any market entry.
A few habits help:
| Habit | What it prevents |
|---|---|
| Predefined stop placement | Emotional widening of risk |
| Written trade criteria | Impulsive entries |
| Post-trade review | Repeating the same mistake blindly |
| Screen breaks after losses | Revenge behavior |
Mentorship can help here because psychology is hard to self-diagnose. A trader often doesn’t notice the exact behavior that keeps wrecking execution until someone else points it out clearly.
Building and Refining Your Personal Trading Plan
At some point, notes and scattered rules stop being enough. You need a written trading plan.
Without one, every session becomes a fresh debate with yourself. That’s exhausting, and it creates inconsistency. A trading plan turns loose ideas into an operating manual.

What belongs in a real trading plan
Your first plan doesn’t need to be impressive. It needs to be clear.
Include these pieces:
Markets you trade
Pick the instruments you understand and can follow consistently.Timeframes you use
Define where you find context and where you execute.Entry criteria
Write the exact conditions that must be present before you enter.Stop-loss rules
State where the trade is invalidated.Exit approach
Decide whether you use fixed targets, structure-based exits, or a mix.Risk rules
Define the maximum loss you’ll accept per trade and what happens after a losing streak.Review routine
Decide when and how you’ll evaluate performance.
If you want a template to work from, this guide on what is a trading plan is a practical reference.
Your edge has to be measurable
A trading plan isn’t just rules. It’s your attempt to define an edge in observable terms.
Statistical trading relies on historical data rather than intuition, and expectancy is one of the key metrics used to judge whether a trader has an edge. It’s calculated by dividing total R-value earned by the number of trades. A positive expectancy means the method has a statistical edge over time, as explained in TrendSpider’s article on statistical trading basics.
That matters because many traders think they have an edge when they really just had a good week.
A trading plan should tell you what to do on ordinary days, not just when the chart looks perfect.
Let the plan evolve, but not daily
A good plan changes slowly. It should improve through review, not mood.
Use this filter before making any change:
| Question | If the answer is no |
|---|---|
| Do I have enough logged trades to justify the change? | Keep testing the current rules |
| Is the change based on repeated evidence? | Don’t alter the plan yet |
| Will this make execution simpler or clearer? | It’s probably noise |
| Can I define the new rule in plain language? | It isn’t ready |
That’s where structured education helps. A beginner may need a basic framework first. A trader who already sees clean levels may want deeper work on supply and demand or intraday execution. The right next step depends on the weakness revealed by your journal, not on what looks exciting.
Your Journey from Learner to Consistent Trader
Trading gets much easier once you stop searching for a shortcut. The best way to learn trading isn’t hidden. It’s just less glamorous than the internet makes you think.
You learn by reading price before you read indicators. You practice in a controlled environment until your process starts to hold up. You manage risk like a professional and stop treating psychology as something separate from performance. Then you put the whole thing into a written plan and refine it through evidence.
That’s how traders build consistency. Not by winning every trade. Not by memorizing patterns in isolation. Not by changing strategy every week.
Consistency comes from doing the same sensible things over and over. If staying steady is hard for you, this guide on Pretty Progress for consistency is worth reading because the challenge is usually behavioral before it’s technical.
Most traders fail because they keep resetting the process. They never stay with one method long enough to learn what it does, where it breaks, and how they behave under pressure. The trader who keeps records, reviews objectively, and protects capital has a real path forward.
You do not need a perfect system. You need a process you can trust and execute.
If you want a structured next step, start with Colibri Trader. Take the Trading Potential Quiz, study the free price action material, and use that to build a roadmap that matches your actual level instead of guessing what to learn next.