

Daily High and Low in Price Action Trading

You've marked yesterday's high, price is approaching it again, and you're deciding whether to sell the touch or buy the breakout. The candle looks convincing until you notice how far price has already traveled and how much room a sensible stop would need.
Before choosing a direction, read the distance. The daily high and low tell you where trading occurred, but the space between them helps you judge whether the next trade is worth taking at all.
Read One Session High and Low
Start with a completed daily bar you can mark on your chart. In the illustrative session described alongside NYSE historical market data, a stock opens at $100, trades as high as $104, falls as low as $98, and closes at $101; its range is $6, or 6% of the opening price. NYSE historical closing-price files record the open, high, low, last price, and total volume for listed securities as of the 4:00 p.m. market close.
The daily high is the highest price traded during the chosen session. The daily low is the lowest, and the intraday range is the high minus the low. Neither extreme tells you what happened first.
That distinction matters when you're looking at a finished candle. Buyers could have recovered from the low before pushing toward the high, or sellers could have knocked price down after an early rally. The completed bar compresses both possible journeys into the same fields.
What each part of the daily bar records
Use these fields as a reading sequence, not a collection of signals.
| Field | What it records | What it does not tell you |
|---|---|---|
| Open | First traded price of the session | The day's direction |
| Daily high | Highest price traded | That buyers are still in control |
| Daily low | Lowest price traded | That sellers have finished |
| Close | Last price of the chosen session; use the regular-session close for US cash equities | The path between high and low |
| Range | High minus low; divide by the open to express it relative to the opening price | A buy or sell by itself |
| Volume | Shares or contracts traded with the bar | Which extreme printed first |
Volume adds participation context, but it doesn't restore the missing sequence. To establish that sequence, open an intraday chart with the same session settings and inspect how price moved.
Mark the references before the pattern
Check whether your platform includes extended-hours trading. A chart showing only the regular session can produce different extremes from a chart that includes overnight or extended-hours prints. Neither is automatically wrong, but mixing them makes your decisions inconsistent.
For traders applying this reading process to digital assets, The Coin Course's guide to spotting crypto price action setups is a useful companion for thinking about setups rather than isolated candle shapes.
Write yesterday's high, yesterday's low, and today's developing range on the chart before hunting for a pattern. Label today's values as developing because they can still change. Yesterday's completed extremes are references; today's moving extremes describe the session you're trading.
Size Down When the Range Widens
Your stop gets hit, then price moves in the direction you expected. That doesn't automatically mean the stop was wrong or that you should give the next trade unlimited room. You may have read direction reasonably well while underestimating the conditions needed to execute the trade.
Volatility isn't the same as tradability. An Economic Modelling study covering small-, mid-, and large-cap stocks associates a higher high-low range with greater price uncertainty and lower ex-ante liquidity, and finds that conventional realized volatility can miss those liquidity effects.
On an expanded day, traders may face thinner order books, faster repricing, wider spreads, and more slippage. A stop tucked immediately beyond an extreme can sit inside ordinary trading noise rather than beyond meaningful invalidation.
Range width and the trading decision
Compare the current range with the recent typical range for the same instrument and session definition. When today's session is young, use the previous completed session for background and compare today's progress with a similar point in recent sessions.
| Range versus recent sessions | What it often means | Stop and size | New entry |
|---|---|---|---|
| Narrow, compressed | Potential compression, not a quiet safe day | Tight stops remain vulnerable to expansion | Wait for a break and retest |
| Near the recent typical range | Ordinary uncertainty | Stop beyond invalidation with a spread allowance; planned size if risk permits | Allowed if location and candle agree |
| Wide, expanded | Higher uncertainty, often weaker liquidity | Wider structural stop, smaller size, budget for slippage | Often skip; don't chase the extreme |
| Wick only beyond the prior extreme | Possible sweep or noise | Don't treat the wick as confirmation | Require a close or a clear rejection |
Compression doesn't guarantee an explosive move. It means you shouldn't mistake a small completed range for proof that the next movement will stay small.
Calculate size from executable risk
Find the price that invalidates your idea first. Then measure the distance from your intended entry to that stop, allowing for execution costs without counting the spread twice if your platform already includes it.
For shares, the basic relationship is:
Position size = planned money at risk ÷ estimated loss per share at the stop
For futures or forex, convert the price distance into money using the contract's tick value or the position's pip value. Our guide to position sizing in trading explains how that relationship connects the chart to account risk.
A forex stop only a spread-width below the low offers little protection from routine quote movement. Check which quoted price triggers your order, not just where the candle appears.
Execution rule: If the valid stop gets farther away, reduce the position. Don't move the stop closer simply to preserve the size you wanted.
A smaller position limits planned exposure, but it can't guarantee the exit price during a gap or fast move. When execution becomes too uncertain, skipping is a valid decision.
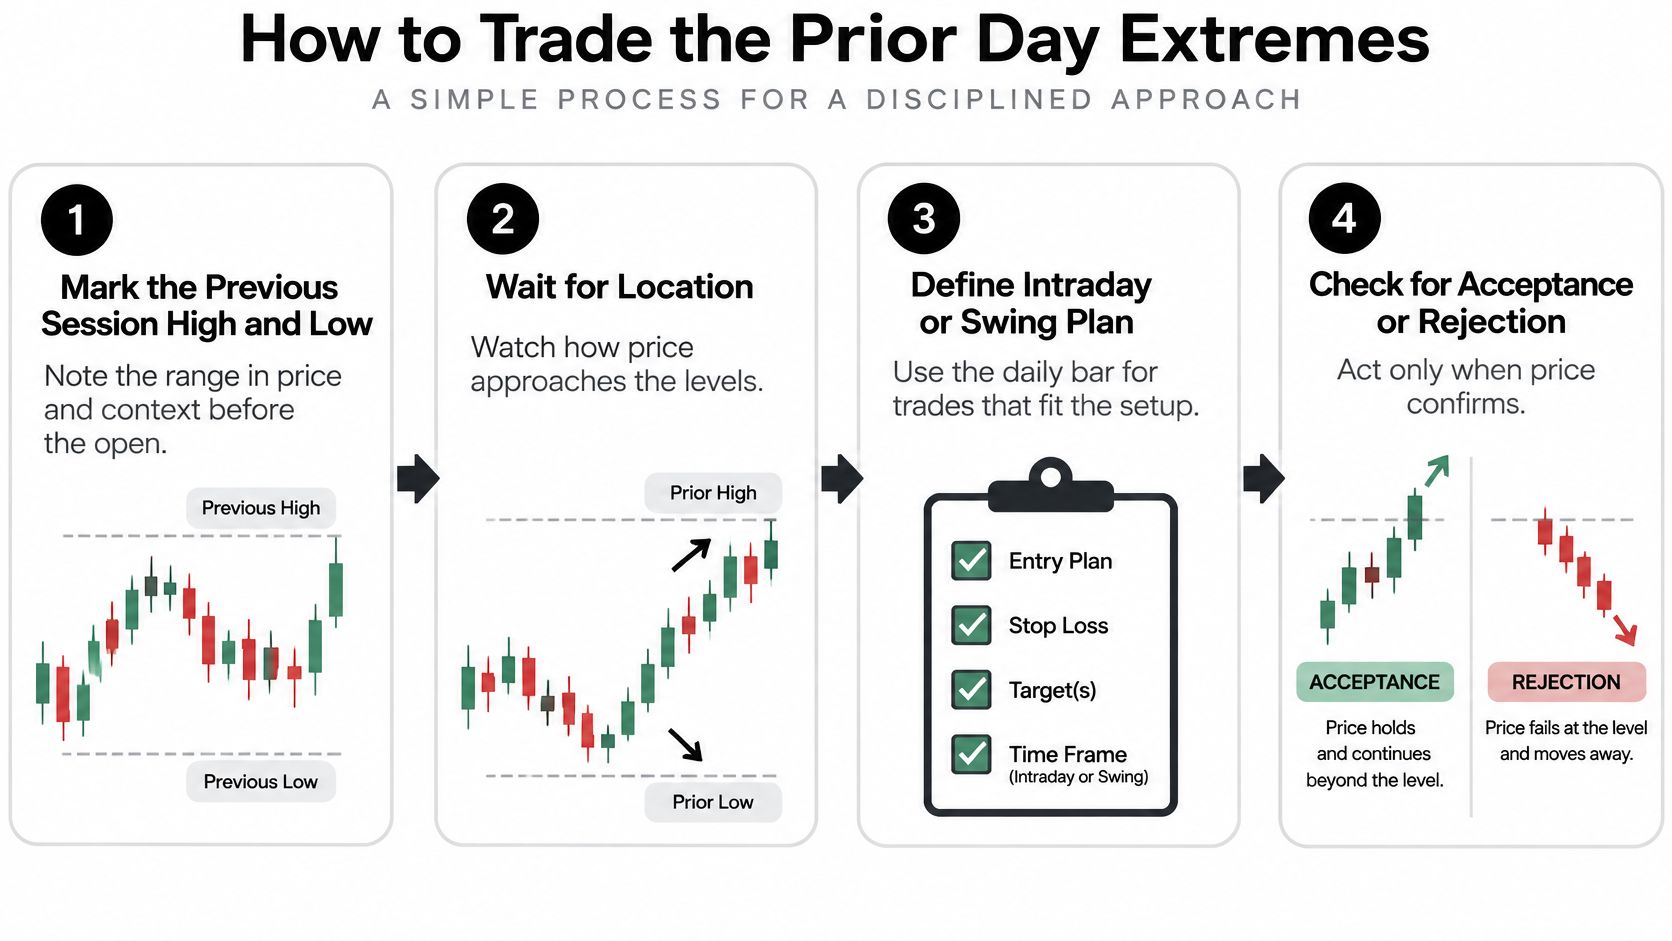
How to Trade the Prior Day Extremes
Prepare the references before the session, then let price reach them. This procedure works for intraday decisions and for swing trades that use a completed daily bar, provided the entry and invalidation belong to the same timeframe.
Prepare location before entry
Mark the previous session's high and low. Record the range in price terms and relative to its opening price. Keep the session boundary consistent so you're comparing like with like.
Add today's open and note how far price has already traveled toward either reference. A level approached after a long directional drive presents a different entry problem from a level tested shortly after an orderly pullback.
Check the surrounding structure. A prior-day high inside a broader supply area isn't equivalent to a high with clear space above it. Use the next daily turning area to judge room for the trade; our explanation of support and resistance levels helps distinguish a meaningful zone from an isolated line.
Wait for price to reach the reference. Front-running because a candle looks bullish or bearish leaves you trading an approach, not a reaction at the location you selected.
Keep the decision sequence visible beside your chart.
Separate rejection from acceptance
For a reversal attempt, require rejection at the level. A pin bar or engulfing candle should form on or slightly through the extreme and finish away from it. The usual slip is spotting the candle first, then searching for a nearby level to justify it.
For continuation, wait for a close through the extreme and a retest that holds. Choose the confirmation timeframe before the approach. Buying the first tick through the high can leave you committed before you know whether buyers can maintain prices above it.
Place invalidation beyond the relevant structure. Allow room for the spread and expected execution conditions rather than placing the order on the exact extreme. Don't use a distant daily extreme when the actual intraday setup fails at a nearer retest low or high.
Set the first target at the next reachable obstacle. That may be the opposite side of the developing range for a reversal, or the next daily level for continuation. The common mistake is demanding a full-range move when an intervening turning area leaves little reward for the risk.
Reject an oversized signal candle or cut size. A convincing close can still produce an unattractive entry if its invalidation is too distant. Move a protective stop only after the structure supporting the trade changes, not because the latest flicker makes you uncomfortable.
For a swing trade, evaluate the daily close rather than reacting to every intraday probe. A close back inside the prior day's range can be a planned exit condition for a failed breakout. The entry still needs both location and a qualifying reaction, not a line alone.
Four Setups From Daily Extremes
Read each scenario from left to right: the surrounding location, the approach, the reaction, and the available exit. Candle names come after those observations.
Keep the chart and the written plan together while comparing these situations.
Rejection from demand
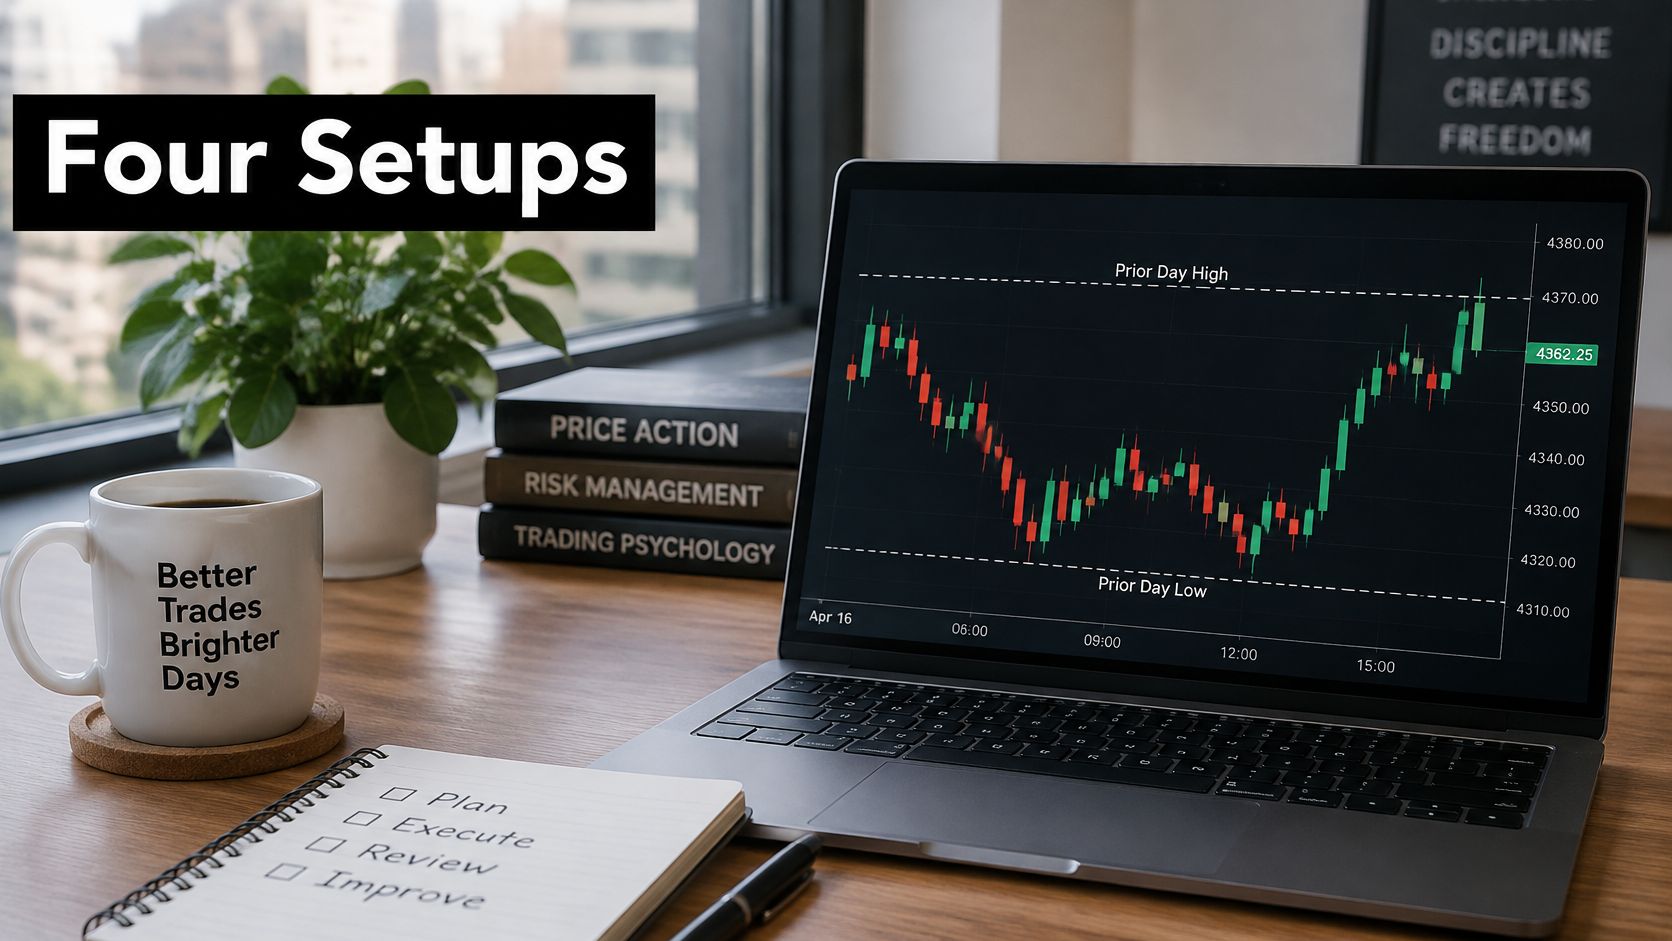
Say yesterday's low sits inside a clearly defined demand area. Today, sellers push slightly through it, but the candle closes back above the level and buyers follow through. A bullish engulfing candle or pin bar makes that rejection easy to identify; its name isn't the reason to enter.
The idea fails if sellers regain acceptance below the rejection low. Place the protective exit beyond that structure, and use the nearest opposing intraday area as the first target. Cancel the entry if price runs toward that target before you can enter without chasing.
Continuation above the high
Buyers have been holding successive pullbacks, and yesterday's high has no nearby daily supply directly above it. Price closes through the high, then pulls back without sustaining trade beneath the broken level.
The entry is the successful hold, not the initial surge. Invalidation sits beyond the retest structure, which may put the stop back inside the old range. The first target is the next daily resistance area; cancel if the retest turns into sustained trading below the breakout.
Watch the price-action explanation with those location and invalidation questions in mind.
A failed push above the extreme
Price spikes above yesterday's high but can't finish there. A bearish engulfing candle closes back inside the prior range, giving a breakout buyer an exit condition and a potential short seller a failure to assess.
A short is invalidated by renewed acceptance above the failed push. The first target is toward the middle of the range, with the low a further possibility only if the intervening structure permits it. Don't enter if the failure candle has already consumed the available downside.
A swing hold at an older low
A market pulls back over several sessions into a prior swing low that was also a daily low. Buyers reject the area, and the daily candle finishes away from the bottom.
Risk belongs beyond the rejected low, not at an arbitrary fixed pip distance. The first target is the nearest daily supply area. Continued acceptance beneath the zone cancels the hold thesis.
Match the level to the session you actually trade. A regular-session cash-equity high excludes extended-hours prints, while a forex daily high follows the broker's day boundary.
No indicator is required for these scenarios. You need a consistent extreme, a readable close, and evidence of rejection or acceptance.
Why the Range Is Not a Signal
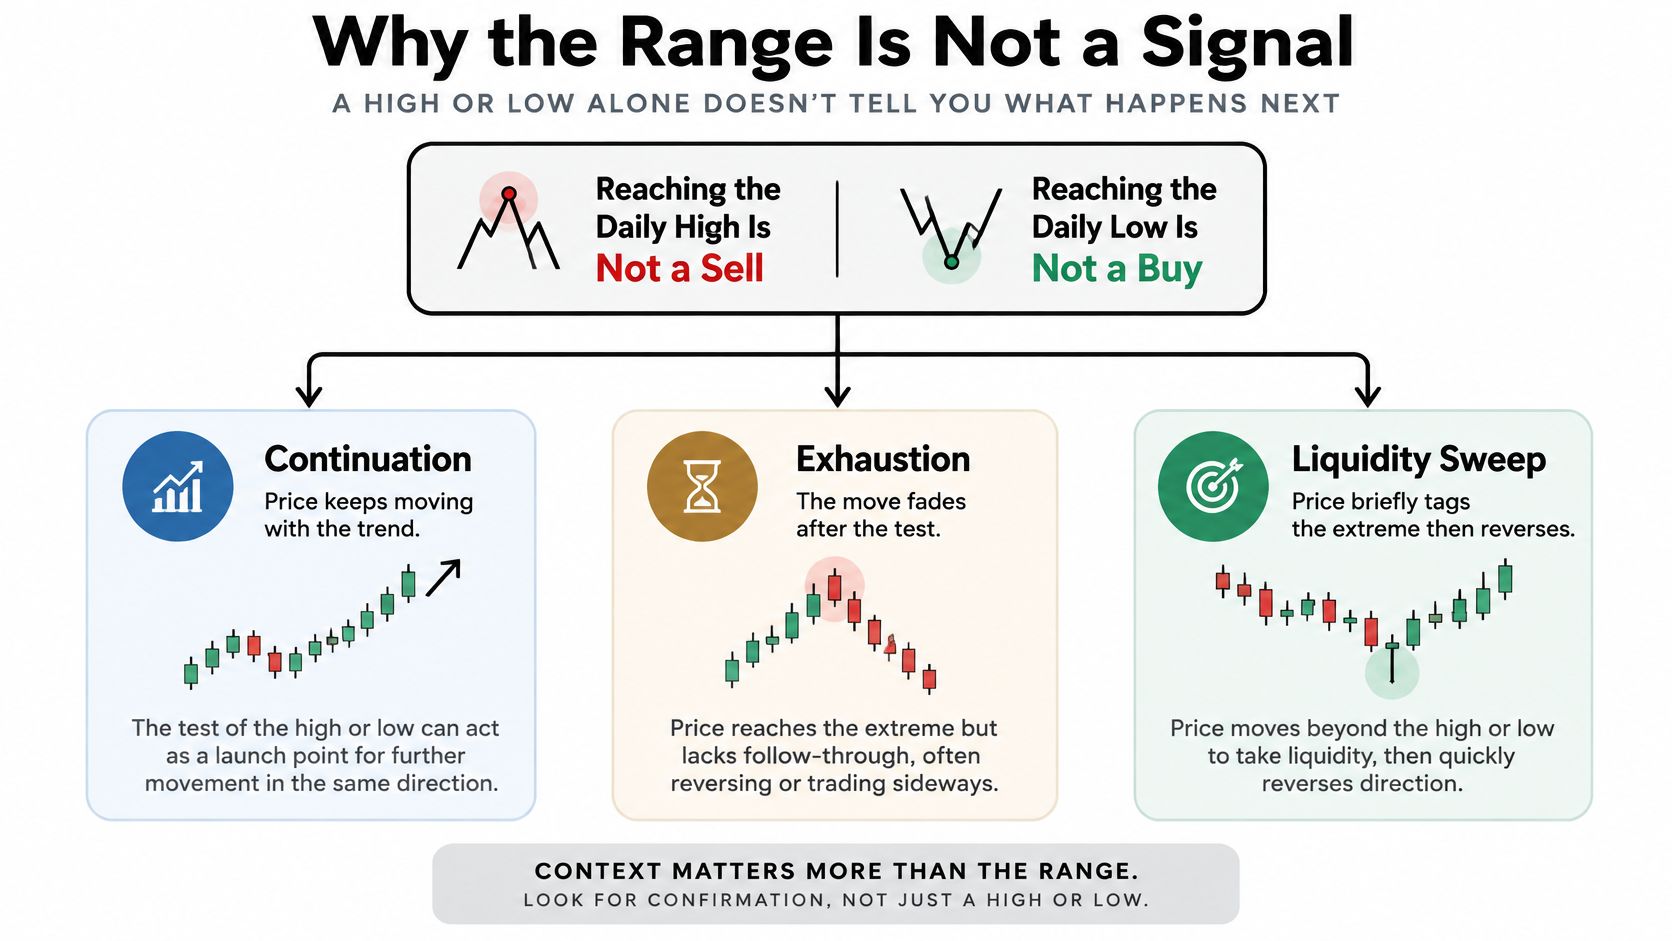
Reaching the daily high isn't a sell, and reaching the daily low isn't a buy. At an extreme, traders may continue the existing move, exhaust it, or briefly trade beyond a reference before returning inside. The location alone doesn't distinguish those outcomes.
The range is primarily a measure of price variability. The intraday-range study of Value at Risk and Expected Shortfall models five stock indices and five individual stocks, showing how session extremes can inform downside and tail-risk estimates rather than merely supply entry levels.
Ask what the bar actually contains
Start with where price traveled. Compare the open with each extreme and the final close. A bar that finishes near its high after recovering from the low describes a different balance of trading than a bar that gives back the rally and finishes near its middle.
Then ask how much risk that travel implies. A large excursion can disappear in a close-to-close comparison if price returns near its starting point. A trader who held through that excursion still faced the movement, even though the closing change looks modest.
Finally, establish when the extreme formed relative to your decision. A high visible before your entry is a usable reference; a high established later is information you didn't have. Don't review a historical trade using the finished daily bar as though its final boundaries were known throughout the session.
These are separate questions. A directional opinion can be reasonable while the entry remains poor because the available stop and target don't fit.
The possible outcomes at an extreme are easier to separate when they aren't all labeled reversals.
Drop the automatic interpretations
A high isn't automatically resistance, and a low isn't automatically support. Treat them as candidate decision areas until surrounding structure and the current reaction give you a reason to act.
A touch doesn't establish rejection. Nor does a brief break establish acceptance. Define the close, hold, or failure you need before price arrives, otherwise you'll keep changing the requirement to fit the direction you want.
Yesterday's references remain visible after the open, but they don't outrank broader supply or demand. Likewise, a buffer copied from another instrument doesn't account for different tick sizes, quote conventions, or execution conditions.
A useful level tells you where to pay attention. A complete trade plan tells you what must happen there and what would prove you wrong.
Before committing, finish this self-check:
- Range comparison: Is the session compressed, typical, or expanded against comparable recent trading?
- Close location: Are traders holding near an extreme or repeatedly returning toward the interior?
- Timing: Was the relevant extreme already established when the decision became available?
- Execution: Is the spread reasonable relative to the planned stop distance?
- Exposure: Has the position been reduced when a wider valid stop requires it?
If an answer is missing, leave the order unplaced. Uncertainty about the process isn't resolved by a more attractive candle.
Log Twenty Sessions Before You Size Up
Use a twenty-session practice drill before increasing exposure. That's a training assignment, not a claim that a short journal proves an edge. The purpose is to make your decisions inspectable instead of relying on how obvious a chart looks afterward.
Build a spreadsheet with the opening scan sequence: open, daily high, daily low, close, range, and volume. Add columns for the close's position within the range, the timing of the relevant extreme, your entry condition, planned stop, target, and estimated execution costs.
Record the decision before the outcome
Save a chart screenshot when the setup becomes actionable, then another after the session. Write whether a stop beyond the selected structure would have survived the actual spread and slippage, where that information is available. Mark unavailable execution information as missing rather than replacing it with an ideal fill.
Our guide to keeping a trading journal can help turn those entries into a repeatable review.
- Group comparable days: Separate narrow, typical, and wide sessions using the same classification rule throughout.
- Count outcomes consistently: Record touches that reversed, continued, or remained inconclusive under your predefined exit rules.
- Inspect stop-outs: Separate invalidated ideas from trades whose execution allowance was inadequate.
- Review sizing separately: Check whether reduced size kept planned exposure within your limit. Smaller size doesn't repair a bad entry or prevent a stop-out.
Trade the smallest practical position, or stay in simulation, until you can state location and risk before direction. If your records are incomplete, extend the drill rather than treating its completion as permission to increase size.
The gate is simple: raise exposure only after the range assessment, stop, and exit were planned and recorded first. An obvious-looking daily high or low isn't evidence that you're ready.
Colibri Trader offers price-action education, and our blog covers Price Action, Supply and Demand, Trading Analysis, and Trading Psychology to support this kind of chart review. Visit Colibri Trader to explore those lessons, or take our free Trading Potential Quiz for a custom report based on your unique strengths.