

Gold Price Analysis: The $4,000 Level Could Decide the Next Major Move
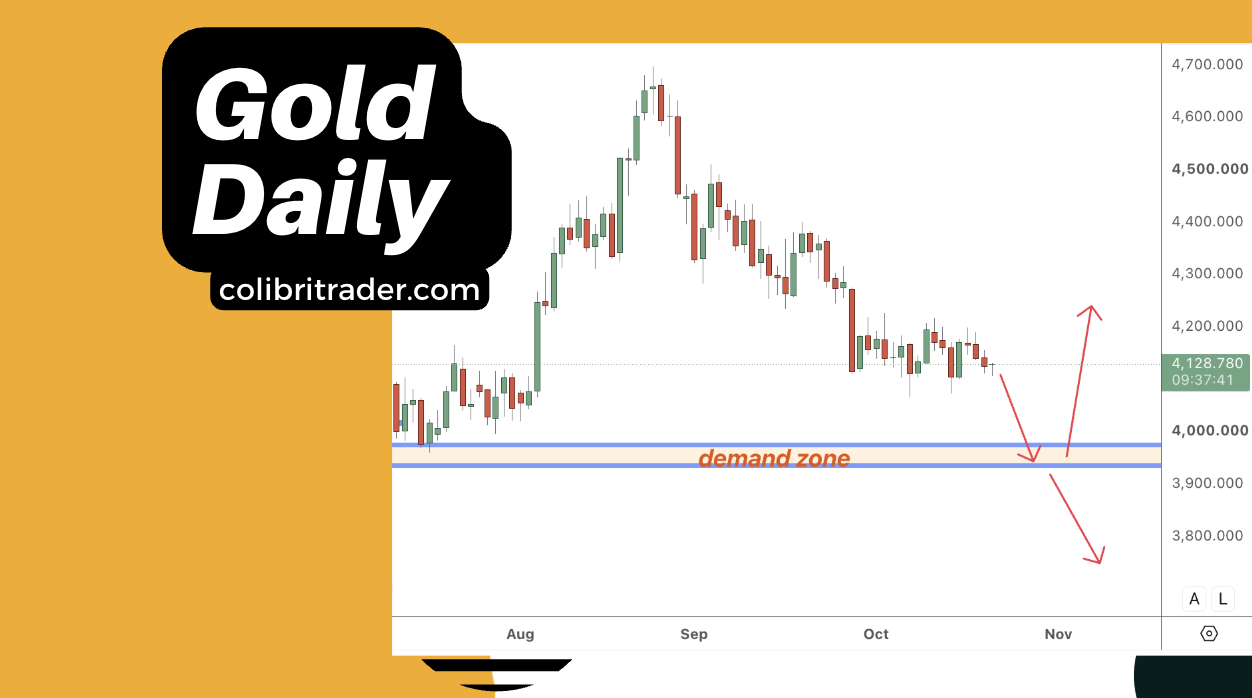
Gold has been under pressure following its impressive rally earlier this year.
After reaching highs near $4,650, the precious metal has entered a corrective phase, forming a series of lower highs and lower lows on the daily chart.
But something interesting is developing.
Gold is approaching a daily demand zone that could determine whether the next significant move is higher or lower.
And the level I’m watching particularly closely is $4,000.
I currently see two possible scenarios: a bullish reversal from demand or a bearish continuation following a confirmed breakdown.
The important part is that I’m not trying to predict which one will happen.
I’m waiting for price action to tell me.
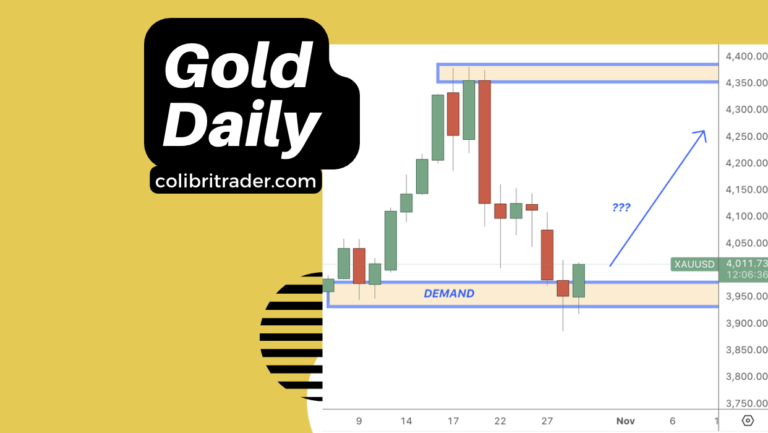
Gold Daily Chart: A Critical Demand Zone

Looking at the daily chart, we can see that Gold has been steadily losing momentum since its late-August peak.
The market has established a bearish structure, with sellers consistently stepping in at progressively lower levels.
At the time of this analysis, Gold is trading around $4,129, and my attention is focused on the demand zone between approximately $3,930 and $3,975.
This area is particularly interesting because it previously acted as a base before Gold began a strong upward move.
In supply and demand trading, these are the areas I pay attention to.
However, the presence of a demand zone does not automatically make it a buying opportunity.
A zone is simply an area of interest.
What price does when it returns to that area is far more important.
And this is where my two scenarios come into play.
Scenario 1: A Bullish Reversal From Daily Demand
The first possibility is that Gold continues declining toward the daily demand zone before attracting buyers.
If that happens, I’ll be watching for signs that selling pressure is weakening.
More specifically, I’m interested in two potential candlestick formations on the daily chart:
- Bullish engulfing: A strong bullish candle that engulfs the previous bearish candle’s body, suggesting buyers are beginning to regain control.
- Bullish pin bar: A candle with a pronounced lower wick and a close away from its lows, suggesting rejection of lower prices.
Neither formation guarantees a reversal.
But when they develop at a meaningful demand zone, they can provide additional context for a potential long opportunity.
Ideally, I’d like to see Gold test the zone, reject lower prices, and begin establishing a bullish structure.
Only then would I consider looking for a long entry.
A potential recovery toward $4,200 could become interesting, although that is not a fixed profit target.
The objective isn’t to buy because Gold looks cheap. It’s to buy when the market provides sufficient evidence that buyers are taking control.
Scenario 2: A Break Below $4,000 Could Trigger Further Selling
The second scenario is potentially even more interesting.
What happens if Gold fails to hold the demand zone?
The $4,000 level is not only a psychologically important round number. It also sits just above the daily demand zone I’m watching.
If Gold breaks decisively below $4,000 and subsequently moves through the lower boundary of demand, it could signal that sellers remain firmly in control.
But I want to make an important distinction.
A break below $4,000 is not, by itself, a reason for me to sell.
I would prefer to see a convincing daily close below the level, ideally followed by price action confirming that the former support area is now acting as resistance.
That would make me considerably more interested in a potential short opportunity.
And this is where the 4-hour chart becomes important.
My Trading Plan: Daily Chart First, 4H Confirmation Second
Rather than trying to anticipate Gold’s next move, I prefer to establish the broader context on the daily chart and then look for more precise opportunities on the 4-hour timeframe.
For a bearish setup, my process would be relatively straightforward.
Step 1: Wait for a decisive daily breakdown.
I want to see Gold break below $4,000 convincingly, with particular attention to whether price also breaks through the demand zone around $3,930–$3,975.
A temporary move below $4,000 followed by a strong recovery would not necessarily confirm bearish continuation.
Step 2: Look for a 4H rejection.
Following a confirmed daily breakdown, I would move to the 4-hour chart and watch for a potential retest of $4,000 or the broken demand area.
Ideally, I’d like to see a bearish engulfing formation or an inverted pin bar rejecting that level.
Such a development could suggest that former support is becoming resistance.
Step 3: Evaluate the asymmetric opportunity.
Even with daily and 4H confirmation, I still need to consider the potential reward relative to the risk.
Where would my stop-loss logically belong?
Is there sufficient room before the next meaningful demand area?
Does the potential payoff justify taking the risk?
If the answers aren’t convincing, I won’t take the trade.
The same principle applies to the bullish scenario. A bullish engulfing or pin bar at demand would be a reason to investigate a long opportunity, not an automatic instruction to buy.
Why I’m Not Trading Gold Right Now
This is perhaps the most important part of the analysis.
Gold is approaching an interesting technical area, but it hasn’t yet reached the demand zone.
And until it does, I’m not particularly interested in forcing a position.
I can see a possible bullish reversal.
I can also see the potential for a much deeper bearish move if support fails.
Both scenarios are perfectly reasonable.
But having a scenario is not the same as having a trading opportunity.
One of the biggest mistakes traders make is becoming attached to their analysis before price has confirmed anything.
They identify a demand zone and immediately decide the market must bounce.
Or they see a bearish trend and assume every support level must eventually break.
I prefer to approach the market differently.
I don’t need to know where Gold is going. I need to know what conditions would make a trade worth taking.
And those are two very different things.
Final Thoughts: Gold Is Approaching a Decision Point
For now, my attention remains on the $4,000 level and the daily demand zone immediately below it.
There are two scenarios I’m preparing for:
| Scenario | What I’m waiting for |
|---|---|
| Bullish reversal | Gold reaches daily demand and produces a convincing bullish engulfing or bullish pin bar |
| Bearish continuation | Gold breaks decisively below $4,000 and demand, followed by a bearish rejection on the 4H chart |
I have no intention of predicting which scenario will materialise.
If buyers defend the demand zone, I’ll investigate the possibility of a long trade.
If sellers break through it and the 4H chart confirms the rejection, I’ll investigate a short.
And if neither happens?
I’ll simply wait.
Because the objective of asymmetric trading is not to participate in every market movement.
It’s to identify situations where the potential payoff is sufficiently attractive relative to the risk being taken.
Sometimes the most valuable part of a trading analysis isn’t knowing what to trade. It’s knowing exactly what you’re waiting for.
Disclaimer: This article reflects my personal technical analysis and trading approach as of 21 October 2026. It is for educational purposes only and does not constitute financial advice. Trading involves substantial risk. Technical formations can fail, and no strategy guarantees future results. Do not place trades based solely on this analysis.