




Master Volume Price Action: Your 2026 Trading Guide
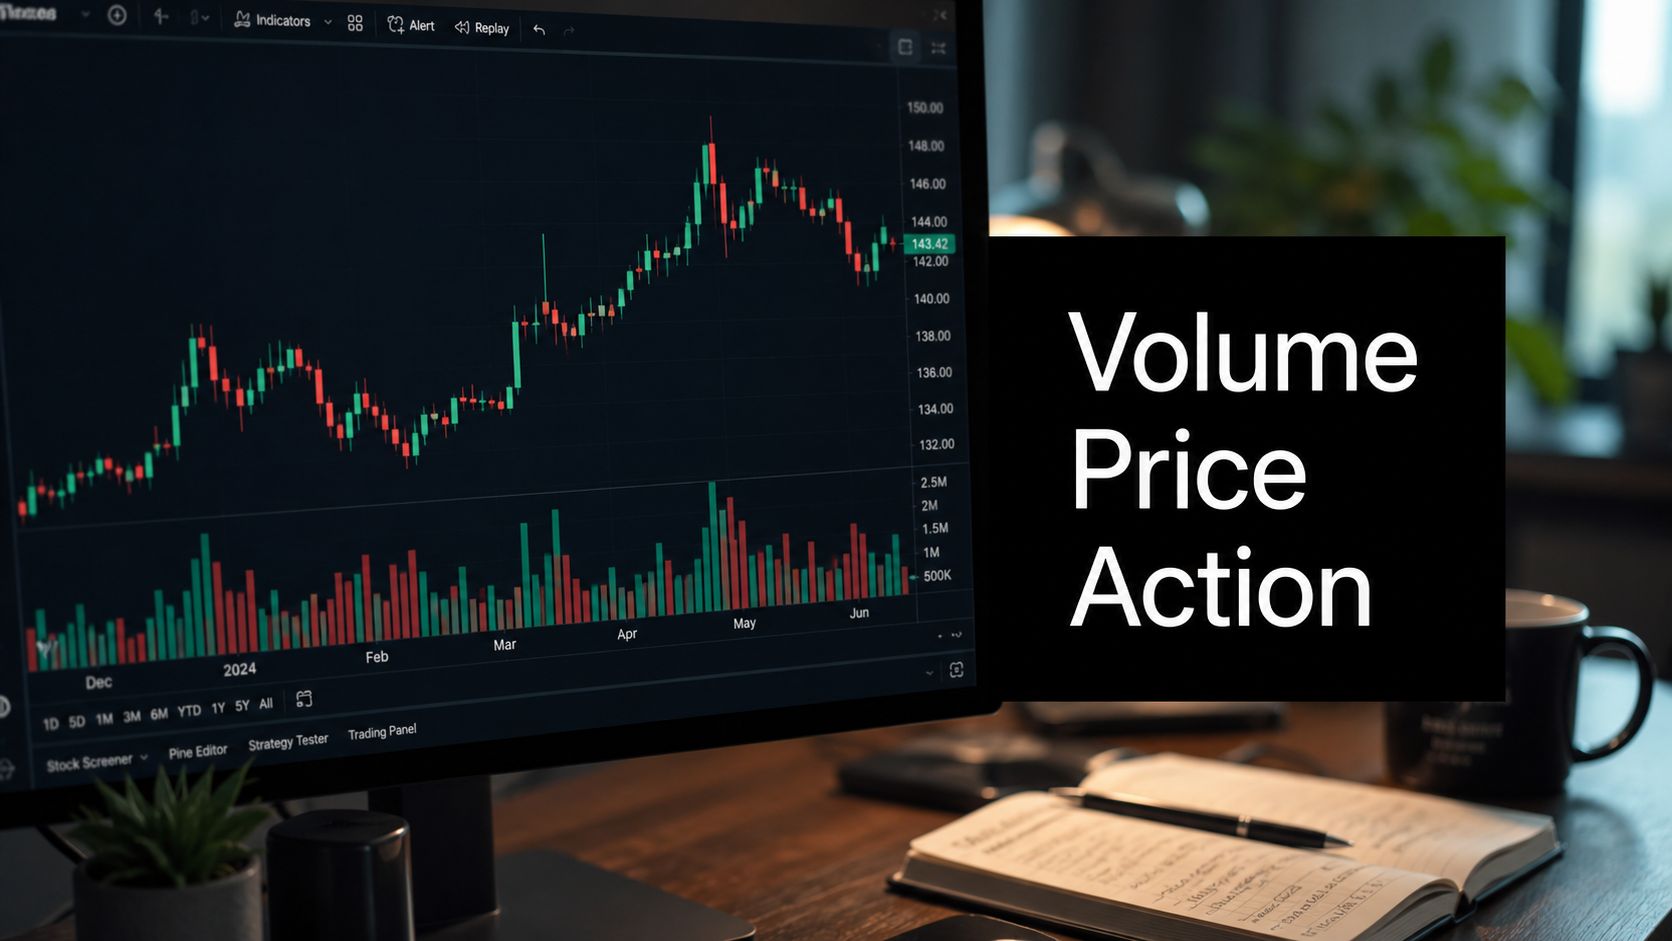
You mark out a clean level. Price coils beneath resistance. The breakout candle closes strong, and you click buy because the chart looks obvious. Then the next candle stalls, fades, and dumps back into the range. A setup that looked textbook turns into another avoidable loss.
That's where most traders get stuck. They learn candlesticks, support and resistance, maybe a few continuation patterns, but they don't read the participation behind the move. Price shows what happened. Volume shows how much commitment sat behind it.
That missing context matters more than most beginners realize. In U.S. equities, daily volume spikes exceeding 200% of the 10-day average precede significant price moves in 85% of cases. That's why experienced traders treat volume as fuel, not decoration. The move may start with price, but volume often tells you whether the market is ready to carry it forward.
The Missing Piece in Your Price Action Trading
A lot of bad trades come from good chart reading done in isolation.
A trader sees a bullish engulfing candle at support and assumes buyers have taken control. Another sees a tight base under resistance and buys the first push through the level. Both ideas can be valid. Both can also fail fast if the market isn't backing the move with real activity.
The problem usually isn't the pattern itself. It's the lack of confirmation.
When a breakout or reversal starts with strong participation, the move has pressure behind it. More traders are involved. More orders are being committed. In U.S. equities, daily volume spikes above 200% of the 10-day average have preceded significant price moves in 85% of cases. That relationship is why volume deserves a place beside every major price decision, not after it.
For a novice trader, this changes the question. Don't ask only, “Is price breaking out?” Ask, “Who is showing up on this breakout?”
What price alone misses
Price can push through a level for several reasons. Real demand is one. Stop runs are another. Thin participation can also let price drift into levels that look important on the chart but have no staying power.
That's why clean-looking setups still fail:
- Breakouts can trigger too early: Price breaches resistance, but buyers don't keep pressing.
- Reversal candles can trap you: One dramatic bar appears, yet the broader market doesn't support follow-through.
- Ranges can fake expansion: A market moves outside consolidation briefly, then snaps back once the short-term order flow clears.
Volume doesn't predict every move. It tells you whether the move deserves your attention.
If you trade price action without volume, you'll still catch some winners. But you'll also take too many trades where the market never confirmed your idea in the first place. Volume price action fixes that by adding the missing layer of conviction.
The Core Principle Confirming Market Conviction
Volume is the market's vote count.
If price rises and volume expands, more participants are agreeing with the move. If price rises while volume contracts, the move may still continue, but fewer traders are supporting it. That difference is often what separates a trend worth following from a move that's running on fumes.
The same principle works in reverse on selloffs. Heavy volume into downside pressure often means urgency. Light volume on a decline often means sellers aren't fully committed.

Four states that explain most charts
You don't need a complicated indicator stack to read volume price action well. Start with these four relationships.
| Price behavior | Volume behavior | What it usually suggests |
|---|---|---|
| Price up | Volume up | Healthy participation, stronger conviction behind the move |
| Price up | Volume down | Rising price with weaker support, momentum may be thinning |
| Price down | Volume up | Aggressive selling, distribution, or panic-driven pressure |
| Price down | Volume down | Selling lacks urgency, decline may be losing force |
This framework is simple, but it's practical. It keeps you from reacting to the candle alone.
Why volume at price matters
Time-based volume bars tell you when activity expanded. Volume-by-Price, often shortened to VBP, tells you where activity concentrated. It was developed by Paul Dysart in the 1930s and remains widely used to identify price levels where significant trading took place. The VBP formula is (Price Range × Volume) / Total Volume, dividing the price range into zones and showing a histogram of volume at those levels.
That matters because price doesn't move through every level equally. Some zones attract heavy business. Others don't. High-volume areas often act like magnets and decision points. Low-volume areas often move faster because the market spent less time doing business there.
Historical data tied to VBP use also shows that price breakouts accompanied by volume spikes succeed over 60% of the time, while low-volume breakouts fail approximately 70% of the time. That's why support and resistance get sharper when you study them through participation, not just candle shape.
If you also study market phases such as accumulation, manipulation, and distribution, this breakdown of accumulation manipulation distribution helps connect volume behavior to the intent behind a range.
Practical rule: A level matters more when the market has already done meaningful business there.
The mistake traders keep making
Many traders treat volume like a secondary filter they'll check after they already want the trade. That's backwards.
Use volume to qualify the setup before entry. A strong candle without participation is weaker than an average-looking candle that breaks a key level with decisive activity. The candle shows form. Volume shows commitment.
Key Volume Price Action Patterns You Must Know
Most traders don't need more patterns. They need a smaller set of patterns they can execute.
The best volume price action setups repeat because the underlying behavior repeats. Buyers chase strength. Sellers dump weak retests. Late participants panic near exhaustion. When you know what those behaviors look like on the chart, your trading gets cleaner.
The breakout that deserves attention
The first pattern to master is the confirmed breakout.
A breakout becomes far more credible when volume expands with it. A widely accepted benchmark is volume at least 1.5x to 2x the average daily volume to validate the move and show enough participation to sustain it, as outlined in TradingSim's guide to volume analysis.
What this means in practice:
- Price must clear a real level: Not random chop. Look for prior highs, range boundaries, or well-tested resistance.
- Volume must expand on the break: The candle alone isn't enough.
- The close matters: A breakout bar that closes near its high is usually more reliable than one that tags the level and retreats.
If volume stays soft, skip it more often than not. The market may still move, but the quality of the signal drops.
The low-volume pullback inside a trend
This is one of the cleanest continuation patterns and one of the least appreciated by newer traders.
Strong trends rarely move in a straight line. They thrust, pause, test, then continue. When price pulls back on lighter activity after a strong impulse, that usually tells you the opposing side isn't pressing with real force. In an uptrend, low-volume pullbacks often show profit-taking or temporary hesitation, not aggressive selling.
Look for this sequence:
- A strong directional move with broad participation.
- A controlled retracement into structure.
- Volume contracts during the pullback.
- Price stabilizes and buyers step back in.
That final turn often gives a better entry than chasing the original breakout.
The climactic reversal
Climactic volume is different from healthy trend volume.
In a mature move, a sudden surge in activity can signal exhaustion instead of confirmation. This often happens near major highs or lows where late traders pile in just as earlier participants start exiting into them. Price may stretch quickly, print a dramatic candle, and then fail to continue.
Watch for these clues:
- Extended price location: The move is already far from base support or resistance.
- Large spread candle: Price expands rapidly in one direction.
- Follow-through failure: The next bars can't continue despite the strong push.
That combination often marks a handoff, not a fresh trend leg.
When volume expands late in a move, don't assume strength. Ask who's trapped if price can't continue.
The sweep and reclaim pattern
Algorithmic markets love to run obvious stops.
Price pokes above resistance or below support, triggers breakout traders and stop orders, then reverses back through the level. Volume often jumps during the sweep, but the clue is where price closes afterward. If the market can't hold outside the level, the spike may have been a trap rather than genuine acceptance.
Understanding liquidity sweep trading becomes useful. A sweep isn't automatically tradable. It becomes interesting when the level is reclaimed and volume behavior supports the rejection.
Reading the Story of a Live Trade Setup
A good setup is a sequence, not a candle.
Most losing traders zoom in too fast. They see the trigger bar and ignore the context that gave the bar meaning. The better approach is to read the whole story. Where is price relative to structure? How did it get there? What did volume do on the way in, at the level, and immediately after?

Bullish example from range to expansion
Start with a market that has been trading sideways for several sessions. Resistance has been tested more than once, but price keeps getting pushed back. That tells you sellers are active there. It also tells you the level matters.
Now the character changes.
Price approaches resistance again, but this time the candles tighten instead of rejecting sharply. That usually means sellers aren't forcing the market lower with the same authority. Then the breakout bar appears and closes through the level with clear expansion in volume.
Here's the thought process:
- Context first: Price is pressing a known ceiling, not breaking out in empty space.
- Behavior into the level: The market stops rejecting aggressively.
- Trigger: A breakout bar closes through resistance with convincing participation.
- Decision: Entry makes sense only if the break holds into the next few bars.
A novice mistake is buying the instant the wick breaches resistance. A stronger approach is waiting for the close, then watching the retest. If price returns to the broken level and volume stays controlled, that often confirms the breakout is being accepted rather than rejected.
The stop belongs under the retest structure, not somewhere arbitrary. If the market accepted the breakout, it shouldn't need to trade significantly back inside the range.
For traders still learning how to build that read bar by bar, this guide on how to read price action is a useful companion because it trains you to read context before trigger.
Bearish example from failed breakout to reversal
Now flip the script.
Price is in an uptrend and pushes into a prior high. The breakout attempt looks strong at first. The candle extends beyond the old high, and volume expands. Many traders assume that confirms continuation.
Then the market gives you the more important clue. It can't stay above the level.
The next bar stalls. Another bar trades back under resistance. Instead of continuation, you get rejection. That changes the meaning of the prior volume burst. It may have been a final push that attracted breakout buyers just as stronger hands sold into them.
Here's how the read develops:
| Step | What price does | What it suggests |
|---|---|---|
| Approach | Trend pushes into prior high | Buyers still in control, but the level is obvious |
| Break | Price trades above the high | Stops and breakout entries likely trigger |
| Failure | Market falls back under the level | Acceptance above resistance is missing |
| Confirmation | Lower high forms with weak bounce | Buyers aren't reclaiming control |
At that point, the short idea becomes cleaner than the original long. The best entry often isn't the first collapse. It's the weak retest after the failed breakout, when price can't recover the level it just lost.
The strongest signal in a failed breakout isn't the poke above resistance. It's the inability to hold there.
What separates a chart reader from a trader
In both examples, the edge doesn't come from spotting a pattern name. It comes from judging whether the market accepted or rejected the move.
That's the heart of volume price action. You're not memorizing formations. You're reading commitment, hesitation, and failure in real time. Once you start thinking that way, your entries get later in the best possible sense. You stop racing the candle and start waiting for evidence.
Simple Rules for Entry Exit and Risk Management
A setup without rules turns into improvisation. Improvisation usually gets expensive.
Volume price action works best when you convert observation into repeatable decisions. You don't need dozens of rules. You need a small set you can execute the same way every time.

Entry rules that keep you out of trouble
Use volume to qualify, not justify.
- Breakout entry: Enter only after the breakout bar closes through the level and participation clearly supports the move.
- Retest entry: If the first break is too extended, wait for price to revisit the level. Enter only if the retest holds without aggressive opposing volume.
- Reversal entry: After a failed breakout or sweep, enter on the reclaim or breakdown of the failure structure, not on the first dramatic spike.
One practical way to stay consistent is to build a simple checklist in your platform or journal. Some traders use platform alerts, raw chart markup, or educational frameworks that incorporate volume confirmation around breakouts. Colibri Trader is one example of a price-action based training resource that teaches breakout confirmation with volume as part of the decision process.
Stop placement that matches the setup
Stops should sit where the trade idea is proven wrong.
If you buy a breakout, the stop usually belongs below the structure that confirms acceptance. If you buy a low-volume pullback, the stop usually sits below the pullback low or the support zone that should hold if buyers are still in control. If you short a failed breakout, the stop belongs above the failed high or above the reclaim level that should not be recovered.
Bad stop placement usually comes from one of two habits:
- Too tight: You place the stop inside normal noise and get clipped before the move develops.
- Too loose: You place the stop so far away that the original trade thesis no longer matters.
Exit rules that respect changing participation
Exits are easier when you keep them tied to market behavior.
Consider using this framework:
- Take something into the first obvious opposing level: Don't assume every trade becomes a home run.
- Reduce if the market stalls on heavy opposing volume: Strong counter-participation is information.
- Hold the remainder while structure and participation still support the trade: As long as the market keeps accepting higher prices in a long, or lower prices in a short, the trade can stay alive.
Execution note: Enter on confirmation, place the stop where the idea fails, and let opposing volume tell you when the auction is changing.
How to Avoid Common Volume Traps and False Signals
The market doesn't fail traders only with bad setups. It traps them with half-true signals.
Volume is powerful, but it isn't simple in every environment. A spike in activity doesn't always mean institutions are building a position. Sometimes it means news just hit. Sometimes it means liquidity was thin and algorithms pushed price through obvious levels to trigger stops.
News volume is not always clean volume
Scheduled events distort normal order flow.
A market can print extreme activity on a news candle and still leave no clean trade. The range expands too fast. Slippage worsens. Price may trade both sides of the level before deciding anything. In those moments, raw volume matters less than whether the market can hold the new area after the first burst settles.
That's why waiting is often the advanced decision. Let the first reaction finish. Then ask whether price is accepting above or below the event level.
Holiday drifts and thin sessions
Low-participation environments create another trap.
A slow grind higher can look bullish on price alone, but if the session lacks broad participation, the move often has poor follow-through. Thin conditions can exaggerate movement and make levels look cleaner than they really are. If you trade these sessions aggressively, you may be reading structure that only exists because fewer traders are involved.
HFT distortion around obvious levels
Many tutorials falter at this point. They explain volume profile as if high-volume nodes and low-volume nodes behave like permanent support and resistance.
That's not how modern markets always trade. As noted in TrendSpider's discussion of volume profile strategies and HFT-related distortion, high-frequency trading can distort volume profiles and trigger false liquidity sweeps around these zones. Retail traders see a familiar level, price tags it, volume flares, and they assume the market has confirmed the area. In reality, the move may be harvesting liquidity before reversing.
A better defensive read looks like this:
- Don't trust the first touch automatically: Watch whether price holds or snaps back.
- Treat spikes near obvious levels with suspicion: Especially if the move leaves long wicks and poor follow-through.
- Look for acceptance, not reaction alone: Reaction is easy to fake. Holding is harder to fake.
The trap isn't volume itself. It's assuming every burst of volume means conviction.
A Simple Workflow to Master Volume Price Action
Most traders try to master everything at once. That usually leads to random execution and messy journals.
A better path is narrower. Pick one setup and get skilled at reading it in context. The confirmed breakout is a good starting point because it teaches structure, participation, and patience in one pattern.
A practice routine that actually builds skill

Use this workflow:
- Study one pattern only: Choose the breakout, low-volume pullback, or failed breakout. Don't rotate constantly.
- Mark historical examples: Go back through charts and screenshot every instance you can find.
- Write the context beside each chart: Where was the key level, what did volume do, and did the market accept or reject the move?
- Paper trade the pattern live: Practice waiting for confirmation instead of predicting.
- Review losing samples harder than winning ones: Most improvement comes from understanding bad selection.
- Go live small: Real money changes behavior. Size down until execution stays stable.
Keep your notes simple. You're trying to answer one question repeatedly: did volume support the story price was telling, or did it contradict it?
Do that long enough and your chart reading becomes less emotional. You stop chasing candles. You start filtering them.
If you want a structured way to sharpen your price-action decision making, Colibri Trader offers training built around clear chart reading, discipline, and practical execution without burying traders under complicated analysis.