


Trading for Beginners: Your Ultimate Guide to Market Success
So, you're ready to jump into the world of trading. It's a challenging but incredibly rewarding field if you approach it the right way. Forget the "get rich quick" fantasies you see online. Real trading is about building a solid foundation of skill, discipline, and knowledge.
Let's cut through the noise and break down exactly what you need to do to get started on the right foot.
Your First Steps Into the World of Trading
Welcome to the markets. It can feel like a maze at first, but we can make it manageable by focusing on a few key actions before you ever risk a single dollar. Your first job isn't to make money; it's to learn. This isn't about binge-watching a few YouTube videos. It's about deeply understanding the core concepts that separate professional traders from gamblers.
One of the very first things to get straight is the difference between trading and investing. Investing is a long-term game. You buy assets like stocks and hold them for years, sometimes decades, aiming to build wealth as the market gradually appreciates.
Trading, what we're focused on here, is a much faster game. It’s all about capitalizing on shorter-term price swings. A trade might last for days, hours, or in some cases, just a few minutes. This guide is all about trading, specifically using a powerful method called price action.
Understanding Price Action
Price-action trading is my preferred method because it's pure. You make your trading decisions based on one thing: the price movement you see on a clean chart. You're not relying on a dozen lagging indicators or getting bogged down in complex financial reports. You learn to read the "language" of the market directly from the price itself.
It really boils down to three core components:
- Candlestick Patterns: These are visual gold. Each candle tells a story about the battle between buyers and sellers over a specific timeframe.
- Support and Resistance: Think of these as the floors and ceilings on your chart. They are key price levels where the market has historically turned around.
- Market Trends: Is the market moving up, down, or sideways? You'll learn to spot uptrends (a series of higher highs and higher lows) and downtrends (lower highs and lower lows) to trade with the market's momentum.
Mastering these elements means you're reacting to what the market is actually doing, not what a lagging indicator predicted it might do five minutes ago.
It's true that modern trading platforms have made getting into the market easier than ever. For example, Robinhood reported having over 13 million users back in 2020, a huge number of them new to trading. But this is a double-edged sword. As you can read on morganstanley.com, while access is great, it comes with a major warning: easy access doesn't mean easy profits. Too many new traders dive in without the right education, and that's a recipe for disaster.
The most important investment you can make is in yourself. Before you risk a single dollar in the markets, invest your time in learning a proven strategy and developing the discipline to follow it.
The screenshot below from Investopedia shows the different ways traders analyze the market. Price-action trading is a form of technical analysis, the most direct way to interpret market behavior.
This image underscores that successful trading isn't random; it's a skill built on a specific, repeatable methodology. To go even deeper, be sure to read our complete guide on how to start trading for beginners.
To bring it all together, here's a quick rundown of what you need to assemble your starting toolkit. Think of this as your essential checklist before you hit the ground running.
Your Beginner Trading Starter Kit
This table summarizes the essential components every new trader needs to build a solid foundation for their trading journey.
| Component | What It Is | Why It's Critical for Beginners |
|---|---|---|
| A Proven Strategy | A specific set of rules for identifying, entering, and exiting trades. Price action is a great example. | It removes guesswork and emotion, providing a consistent framework for making decisions. |
| A Reliable Broker | A company that provides a platform to access the financial markets and execute your trades. | You need a platform with fair pricing, reliable execution, and good charting tools. |
| A Detailed Trading Plan | Your personal business plan. It outlines your goals, risk management rules, and what markets you'll trade. | This is your roadmap. Trading without a plan is just gambling. |
| Risk Management Rules | Pre-defined rules for how much you'll risk per trade (e.g., 1% of your account) and where to place your stop-loss. | This is what keeps you in the game. It protects your capital from catastrophic losses. |
Getting these four pieces in place isn't just a suggestion—it's the bedrock of a sustainable trading career. Focus on building this kit first, and you'll be miles ahead of most beginners.
Setting Up Your Trading Command Center
Think of your trading platform as your digital command center. It’s where you'll spend your time scanning the markets, analyzing charts, and pulling the trigger on trades. Finding the right one isn’t about some mythical “best” platform out there. It's about finding the one that works for you and your price-action approach.
When you're new, the sheer number of brokers can feel paralyzing. My advice? Ignore the noise. Forget the sign-up bonuses and flashy gimmicks. Your focus should be razor-sharp on the core functionality that lets you read and trade price action effectively.
There are a few things that are simply non-negotiable. Here's what I insist on:
- High-Quality Charting Tools: This is your bread and butter. You'll be living on these charts, so they need to be clean, responsive, and easy to mark up. Can you draw support and resistance lines, trendlines, and zoom in on specific candlesticks without any frustrating lag? If not, move on.
- Low Commissions and Spreads: This is huge. Trading costs are a silent killer of new accounts. You want a broker with competitive commissions and tight spreads (the tiny gap between the bid and ask price). Every pip or penny you save on a trade goes straight to your bottom line.
- Reliable Order Execution: When you hit that buy or sell button, you need to trust that you’ll get filled at the price you see. A solid platform minimizes slippage—that awful moment when your order gets filled at a worse price. In a fast-moving market, good execution can be the difference between a small win and a frustrating loss.
Opening and Customizing Your Account
Once you've picked a broker that ticks these boxes, opening the account is usually pretty quick. You'll provide some ID, answer a few standard questions about your finances, and then wire over your initial capital.
With your account funded and live, your very first job is to set up your charting workspace. The goal here is a clean, distraction-free environment. For a pure price-action trader, this means stripping away the clutter. Less is absolutely more.
I recommend starting with just two essential tools on your charts:
- Volume: This simply shows you how much of something was traded in a given period. When you see a big price move—like a breakout above a key level—backed by a massive surge in volume, it adds a ton of conviction to that move. It’s like hearing the roar of the crowd confirming the big play.
- Moving Averages (MAs): A simple MA (like a 20-period or 50-period) is a great way to get a quick read on the prevailing trend. They smooth out the noisy price data, giving you a clearer picture of market direction and often act as dynamic areas of support or resistance.
Expert Tip: I always set up two chart profiles. The first is a completely "naked" chart—nothing but raw price candles. The second has my volume and MAs. This setup lets me instantly flip between a pure price-action view and one with a little extra context.
The Non-Negotiable Practice Round
Before a single dollar of your real money is at risk, you must spend time in a demo account. This is often called "paper trading," and it gives you a platform with live market data but virtual money. I can't stress this enough: this is the most critical step in this entire process.
This is your training ground. Use it to get comfortable with the platform, practice placing different order types (market, limit, stop-loss), and get a real feel for your strategy without the emotional pressure of financial risk.
And please, treat your paper trading seriously. Follow your trading plan just as you would with a live account. The goal isn't to rack up a high score with fake money; it's to build muscle memory with your tools and unwavering confidence in your process.
There's a sobering statistic that up to 90% of retail traders in some markets lose money. A huge reason for this is they rush into live trading, completely unprepared. Think of your demo account as your first and best line of defense against becoming one of them.
Learning To Read The Market's Language
To a newcomer, a chart like this just looks like a jumble of red and green bars. But to a seasoned price-action trader, it's telling a clear story. Every single bar, or candlestick, captures the minute-by-minute battle between buyers and sellers. Learning to read this story is the single most important skill you can develop.
Instead of cluttering your charts with lagging indicators, you'll be focusing on the price itself. This "naked chart" approach gives you a direct, unfiltered view of what the market is actually doing, right now.
Decoding The Story Of Candlesticks
Each candlestick gives you four key pieces of information for a set period: the open, high, low, and close price. The color is the first clue. Green (or white) usually means the price closed higher than it opened, showing buyer strength. Red (or black) means it closed lower, showing seller strength.
But the real magic is in the shape and position of these candles. Certain formations, or patterns, are powerful signals of where the price might be headed next.
Think of it like learning a new language. At first, you only see individual letters. With practice, you start to recognize words. Before you know it, you’re reading sentences and understanding the full story. It's the exact same journey when you learn to read a price chart. You go from seeing single candles to spotting powerful, repeatable patterns.
Some of the most foundational patterns you’ll see constantly include:
- Doji: This is a candle with a tiny body, where the open and close are almost the same. It screams indecision—neither buyers nor sellers have control.
- Engulfing Pattern: A very strong two-candle signal. A bullish engulfing candle’s body completely swallows the previous red candle, signaling a powerful shift to buying pressure. A bearish one does the opposite.
- Hammer: A classic reversal signal. It has a long lower wick and a small body at the top. It often shows up after a downtrend and tells you that buyers stepped in to fight off lower prices, potentially forming a bottom.
These are just a few of the basics. With experience, you'll start to see these formations not just as shapes, but as clear messages from the market.
Identifying Key Battlegrounds: Support and Resistance
While candlesticks tell you about the immediate fight, support and resistance levels show you where the major wars have been fought. These are the most critical areas on any chart because they are psychological price points where the market has a memory.
Support is a price level where a downtrend can be expected to pause due to a concentration of demand. Resistance is the opposite—a price level where an uptrend may pause due to a concentration of supply.
Finding these levels is straightforward. Just look back at the chart's history. Where has the price repeatedly turned around? A previous peak often becomes a future resistance level. A prior low can become a future support level.
For a beginner, drawing these simple horizontal lines on your chart is one of the most powerful things you can do. It creates a map of the market, showing you the high-probability zones where you should be hunting for trades.
Putting It All Together: A Real Chart Example
Let’s walk through a real-world scenario. You're watching a stock that's been in a downtrend for weeks. You’ve already marked a major support level from a few months ago where the price bounced hard.
As the price drops toward this level again, you're on high alert. You don't just blindly place a buy order because it's near support. Instead, you watch the candlestick story unfold. A big, scary red candle slams into your support level… but the very next candle is a massive bullish engulfing pattern.
That’s your cue. The support level held, and the candlestick pattern confirms that buyers have stormed back in with force. This combination—a key level and a bullish price action signal—gives you a high-probability reason to enter a trade.
Mastering these patterns is how you build a solid trading framework. For a deeper dive, our guide on the top 10 chart patterns every trader should know is an excellent resource to study next.
Markets have always moved in cycles. While the S&P 500 has returned about 10% annually since 1926, that number hides devastating downturns like the 57% collapse during the 2008 financial crisis. Understanding that volatility is just part of the game helps you interpret these chart signals with a much calmer, more objective mindset.
Executing Your First Trades with a Plan

Knowing how to read a chart is one thing; knowing precisely when to pull the trigger is another. This is where your analysis meets real-world action, and frankly, it's where most beginners trip up.
They see a great-looking pattern but hesitate, letting the opportunity slip away. Or worse, they jump in impulsively without a clear strategy. The only way to combat this is to take the guesswork completely out of the equation with a trading plan.
A trading plan isn’t some hundred-page beast of a document. Think of it as a simple, strict set of rules that defines every part of your trade before you even think about clicking the buy button. This is what separates methodical trading from pure gambling. It forces you to think with a clear head before your money—and your emotions—are on the line.
Your plan only needs three core pieces. If you can nail these down, you'll have a solid framework for every single trade you take.
Defining Your Entry and Exit Points
First, you need your entry criteria. This is the specific price-action signal that screams, "Now is the time to enter!" It's your green light, and it has to be a concrete, observable event on the chart, not just a gut feeling.
Next up are your exit criteria, which come in two flavors:
- Profit Target: Where are you cashing in your chips? This needs to be a logical price level, not just some random number you hope to hit.
- Stop-Loss: At what price will you admit you were wrong, cut your losses, and live to trade another day? This is your non-negotiable safety net.
Let's walk through a hypothetical trade on a stock, we'll call it XYZ, to see how this plays out in the real world.
A Practical Trade Walkthrough: XYZ Stock
- Analysis: You've been watching XYZ and have spotted a strong support level at $50.00, a price where buyers have stepped in multiple times before. The stock is currently sliding down toward this key level.
- Entry Signal: As the price touches $50.00, you don't just buy. You wait for proof. The next hourly candle closes as a powerful bullish engulfing pattern right off that support line. That's your signal.
- Profit Target: You scan the chart and see the next clear area of resistance is at $53.50, where the price has stalled out in the past. This becomes your profit target.
- Stop-Loss: To protect your capital, you set your stop-loss just below the support level and the low of that bullish candle, maybe at $49.40.
This structured approach turns a potentially gut-wrenching decision into a cool, logical process. You know your exact entry, your target for a win, and your exit for a loss before a single dollar is at risk.
Placing the Right Order Type
With your plan locked and loaded, the final piece is execution. Your trading platform gives you a few different ways to get in and out of a trade. Using the right one is critical.
| Order Type | When to Use It | Practical Example |
|---|---|---|
| Market Order | For instant execution at the current best price. Use it when getting in now is more important than the exact price. | You see that bullish engulfing pattern confirm and want to get into XYZ immediately before it takes off without you. |
| Limit Order | To buy below the current price or sell above it. It guarantees your price (or better) but not that the trade will actually happen. | You want to buy XYZ, but only if it dips back to $50.10. You set a buy limit order, and it only fills if the price drops to that level. |
| Stop Order | This becomes a market order once a specific price is hit. It's the go-to for stop-losses or for entering trades on breakouts. | You place a sell stop order at $49.40. If XYZ's price falls to that level, it automatically triggers a market order to sell and close your position. |
For most traders following a plan, a combination works best. You might use a market order to jump in when your signal appears, then immediately place a limit order at your profit target and a stop order at your stop-loss level.
By defining your entry, exits, and order types ahead of time, you systematically remove emotion from the driver's seat. Your job is no longer to guess or hope; your job is to execute the plan you built when you were calm and objective. This discipline is the true secret to staying in the game long-term.
This method transforms trading from a reactive, high-stress gamble into a proactive, structured business. It’s the foundational skill that allows you to manage risk and build the consistency all traders are chasing.
Mastering Risk and Money Management
You can have the best chart-reading skills in the world, but without rock-solid risk management, you’re on a fast track to blowing up your account. It’s not the glamorous side of trading, but it’s the absolute bedrock of long-term survival. Think of it as the firewall protecting your capital from the emotional whims of greed and fear.
It’s a hard truth, but most people who try trading fail. Study after study shows that somewhere between 70% to 90% of new retail traders lose money and quit, often within the first year. The culprit? Almost always, it's a catastrophic failure in risk management and a lack of discipline. Forgetting to use simple protective tools like a stop-loss is a classic rookie mistake. Understanding this reality from day one is your biggest advantage.
You beat the odds by treating trading as a business of probabilities, not certainties. And that all starts with one simple but incredibly powerful rule.
The Foundational 1% Rule
If there’s one rule to etch into your trading plan, it’s the 1% Rule. It’s beautifully simple: you will never, ever risk more than 1% of your total trading capital on a single trade.
Got a $10,000 account? Your maximum loss on any one trade is $100. Period. If your account grows to $12,000, your max risk per trade becomes $120. This single rule forces you to stay in the game, even after hitting an unavoidable string of losses. It makes any single trade psychologically insignificant, which is exactly where you need to be.
Your primary job as a trader is not to make a profit; it’s to protect the capital you already have. Profit is simply the byproduct of excellent risk management.
Thinking in percentages instead of raw dollar amounts is a game-changer because it scales with you. It keeps your risk consistent whether you're trading with $1,000 or $100,000. This discipline is what separates the pros from the amateurs.
To see why this is so critical, let's look at what happens when you get a bit too aggressive. The difference between risking 1% and 5% might not sound like much, but over a series of trades, the impact on your capital is massive.
Risk Management Scenarios
| Scenario | Risking 1% Per Trade ($100) | Risking 5% Per Trade ($500) |
|---|---|---|
| Account Start | $10,000 | $10,000 |
| After 1 Loss | $9,900 | $9,500 |
| After 3 Losses | $9,703 | $8,574 |
| After 5 Losses | $9,510 | $7,738 |
| Account Drawdown | -4.9% | -22.6% |
After just five consecutive losses—which is a completely normal occurrence in trading—the 1% risk taker is down less than 5% and can easily recover. The 5% risk taker, on the other hand, is already down nearly 23% and is in a deep psychological and financial hole. This is how accounts get wiped out.
Calculating Your Position Size
The 1% rule works hand-in-hand with your stop-loss to tell you your position size—how many shares or lots you can actually trade. You absolutely must do this calculation before you even think about hitting the buy button.
Here’s the simple, three-step process:
- Figure Out Your Max Risk in Dollars: Take your Account Size and multiply it by 1%. For a $10,000 account, that’s $100.
- Define Your Trade’s Risk Per Share: This is the distance between your entry price and your stop-loss. If you plan to buy at $50.00 and set your stop-loss at $49.40, your risk is $0.60 per share.
- Calculate Your Position Size: Divide your Max Risk by your Risk Per Share. In our example, that’s $100 / $0.60, which equals 166 shares.
So, you would buy 166 shares. If the trade goes against you and hits your stop, you lose around $100 (plus commissions), sticking perfectly to your risk plan. Getting this right is a non-negotiable skill. For a deeper dive, you can explore more about these 6 position sizing strategies to find what works best for you.
This image breaks down how different risk approaches can impact your trading journey.
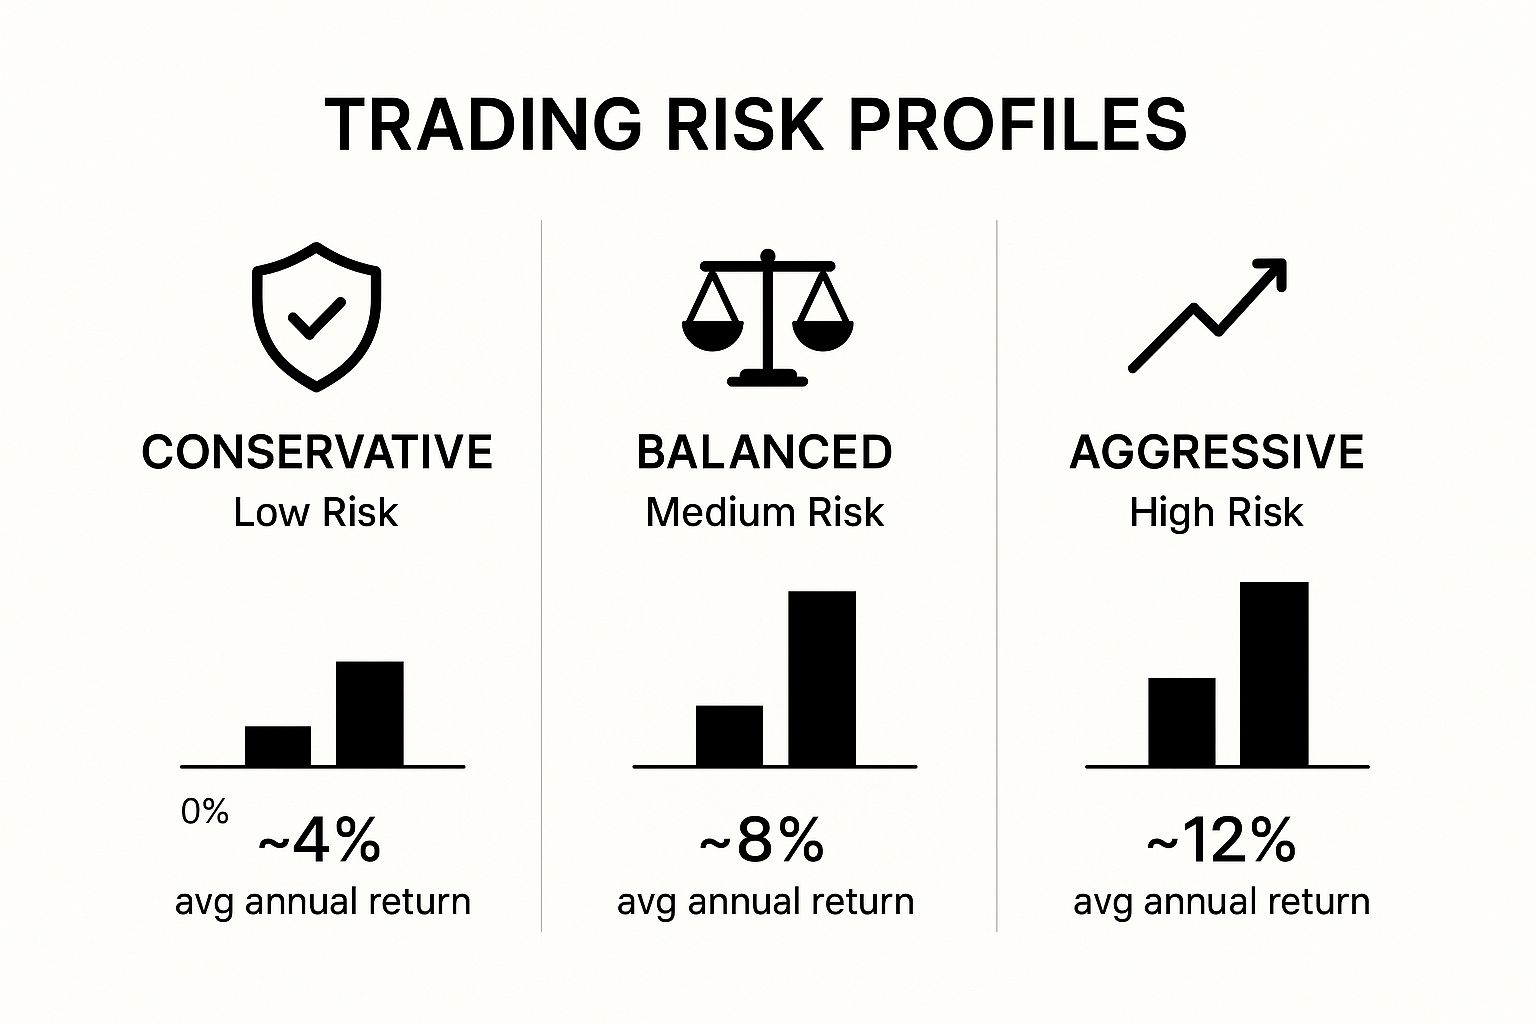
As you can see, an aggressive strategy might look tempting with its higher potential returns, but it brings wild volatility and stomach-churning drawdowns. A conservative strategy provides much more stability, aligning perfectly with the capital preservation mindset that every new trader must adopt.
Your Most Important Tool: The Trading Journal
Finally, the best traders are obsessive about tracking their performance. Your trading journal is your tool for brutal honesty, accountability, and systematic improvement. This is where you log every trade, noting not just the numbers but your mental state.
A journal doesn't need to be fancy; a simple spreadsheet is perfect. For every trade, you should track:
- Date: When you entered the trade.
- Asset: What did you trade? (e.g., AAPL, EUR/USD).
- Setup: The price-action reason for the trade (e.g., Bullish engulfing at support).
- Entry & Exit Price: Your exact entry and exit points.
- Position Size: How many shares or lots you traded.
- Profit/Loss: The final outcome in both dollars and percentage.
- Notes: Why did you take the trade? How did you feel? Were you patient? Anxious? Greedy?
Reviewing your journal weekly is where the real magic happens. You’ll start spotting patterns in your behavior that you would have otherwise missed. Maybe you’ll realize you lose money every time you trade out of boredom on a Tuesday afternoon. That insight alone is priceless and can save you thousands over your career.
Common Questions for New Traders
Once you start getting your hands dirty in the trading world, a few questions always seem to bubble up to the surface. These aren't the theoretical questions you read about in textbooks; they're the practical, "what-do-I-actually-do-now" kind of questions.
Let's dive in and tackle some of the most common ones I hear from new traders.
How Much Money Do I Need To Start Trading?
This is the big one, isn't it? The question on everyone's mind. But the answer isn't a simple dollar amount. Sure, a lot of brokers will let you open an account with just $100. But here's the hard truth: that's not nearly enough to trade effectively.
Starting out with too little capital—what we call being undercapitalized—is one of the fastest ways to blow up your account. It's a classic rookie mistake.
The real answer comes down to your ability to manage risk. We've talked about the 1% Rule, right? Well, if you have a tiny $200 account, risking 1% means you're only allowed to risk $2 on any single trade. That pretty much locks you out of most markets and makes it almost impossible to overcome the costs of spreads and commissions. You're set up to fail before you even start.
For most people, a more realistic starting point is somewhere in the $1,000 to $5,000 range. With that kind of capital, you can actually apply the 1% Rule without being handcuffed. On a $3,000 account, for example, you can risk $30 per trade. That gives you breathing room and much more flexibility to choose your trades and manage your position size properly.
The goal when you're starting out isn't to get rich quick. It's to survive, to master your process, and to protect your capital at all costs. Think of your starting capital as your tuition fee for learning the markets. Start with an amount you are genuinely prepared to lose.
Focus on executing your strategy flawlessly. As your skills sharpen, your account can grow naturally alongside them.
What Is The Best Market For Beginners?
There's no magic "best" market. The best market is the one that fits you—your personality, your daily schedule, and how much risk you're comfortable with. It's a personal decision.
Let's break down the big three from a beginner's perspective.
| Market | Key Features for Beginners | Considerations |
|---|---|---|
| Stocks | Easier to understand (you're buying a piece of a company), thousands of options, and a highly regulated environment. | You're tied to market hours (open/close), and building a diverse portfolio can require more capital. |
| Forex (FX) | Open 24/5, massive liquidity, and you can start with less capital thanks to leverage. | Leverage cuts both ways. It can amplify gains, but it can also magnify losses in a heartbeat. Requires strict risk control. |
| Crypto | Open 24/7, and the high volatility can create huge opportunities (and equally huge risks). | The volatility is extreme. It's a less regulated space, prone to wild, unpredictable price swings. |
From my experience, the Forex market is often a great starting point for new traders. Why? The 24/5 access means you can almost always find trading opportunities that fit your personal schedule. Plus, the ability to trade micro-lots makes it perfect for practicing solid risk management on a smaller account.
But, if you're more of a conservative, analytical type who prefers something tangible, maybe starting with a few well-known, high-volume stocks is a better fit. The key is to pick one market, truly learn its rhythm and personality, and master it before you even think about jumping into another. Don't try to be a jack-of-all-trades.
How Long Does It Take To Become Profitable?
Ah, the million-dollar question. I wish I could give you a specific timeline, but the honest answer is: it's different for everyone. Becoming a consistently profitable trader isn't a destination you arrive at in six months or a year. It's a journey of relentless learning and iron-clad discipline.
I've seen some traders find their groove in under a year, but for others, it takes several years of hard work. Profitability isn't a light switch that suddenly flicks on. It's the slow, gradual result of placing hundreds of trades, reviewing every single one, and mastering your own emotions.
Your progress really boils down to a few things:
- Time Commitment: How much screen time are you putting in? This isn't just about placing trades, but about studying charts, backtesting, and reviewing your performance.
- Psychological Strength: This is huge. Can you stick to your trading plan even when you're on a losing streak? Can you take profits at your target without getting greedy and letting a winner turn into a loser?
- Quality of Education: Are you learning a repeatable, proven strategy, or are you just chasing hot tips and random indicators you found online?
Think of trading mastery like learning to play the piano. You wouldn't expect to be concert-ready after a few lessons. It takes daily practice, learning from every wrong note, and a real passion for the craft. Trading is no different.
My best advice? Forget about the profits for now. Focus on the process. Celebrate when you execute your plan perfectly, even if the trade ends up as a loss. If you make being a disciplined trader your number one goal, profitability will eventually follow as a natural byproduct of your skill. It's a marathon, not a sprint.
Ready to stop guessing and start trading with a proven, price-action strategy? At Colibri Trader, we provide the no-nonsense guidance and action-based programs to help you master the markets. Take our free Trading Potential Quiz and see where you stand.