Simple Day Trading Strategy: Master Consistent Gains
The Psychology Behind Successful Simple Day Trading

Many new day traders assume complicated strategies are the ticket to market success. Experienced traders, however, often highlight the benefits of simplicity. This section delves into the psychology of consistently profitable day traders, contrasting their mindset with those who struggle. These observations, drawn from discussions with successful traders, explain why a straightforward approach can often outperform complex strategies in the ever-changing market.
Cognitive Biases and Trading Decisions
One reason traders create overly complex strategies is the impact of cognitive biases. These inherent mental shortcuts can skew our decision-making. For instance, confirmation bias can lead traders to favor information supporting their existing views, disregarding conflicting data. This might mean clinging to losing trades or entering new ones based on hope rather than sound analysis.
The fear of missing out (FOMO) also plays a role. FOMO pressures traders into impulsive actions, straying from their planned simple strategies. This emotional reactivity can severely hinder long-term profitability.
Maintaining Discipline in Day Trading
Successful day traders develop mental strategies to counteract these biases and maintain discipline. They adopt a process-oriented approach, emphasizing consistent execution over chasing unpredictable short-term gains. For those interested in optimizing their market analysis time, consider exploring speed reading techniques: Proven Speed Reading Secrets. This involves crafting a detailed trading plan with clear entry and exit rules, risk management parameters, and performance goals. Adhering to this plan, even amidst market fluctuations, is key to long-term success.
Information Overload and Analysis Paralysis
Today’s markets offer a wealth of information, which can feel overwhelming. This can result in analysis paralysis, where traders struggle to make decisions because they’re bogged down in data. A simple trading strategy helps by narrowing the focus to a few essential indicators or price action patterns. This streamlined approach allows for quicker identification of high-probability trading setups in dynamic markets.
Consider the example of using simple moving averages. A strategy based on the 3-period and 8-period Simple Moving Averages (SMA) can prove surprisingly effective. In some cases, it yielded a net gain of +18.44% over a testing period, outperforming a buy-and-hold strategy. By filtering out unnecessary information, traders gain clarity and make more decisive trades, contributing to a more sustainable and profitable trading experience.
Moving Average Crossover: Your Trading Edge Simplified
Moving averages are a surprisingly simple yet effective tool. They form the basis of a simple day trading strategy, used by professional traders to understand and react to market timing. This section explains how moving averages help traders filter out market noise and identify real momentum shifts. We’ll explore this concept with various examples across different timeframes.
Identifying Market Sentiment Shifts
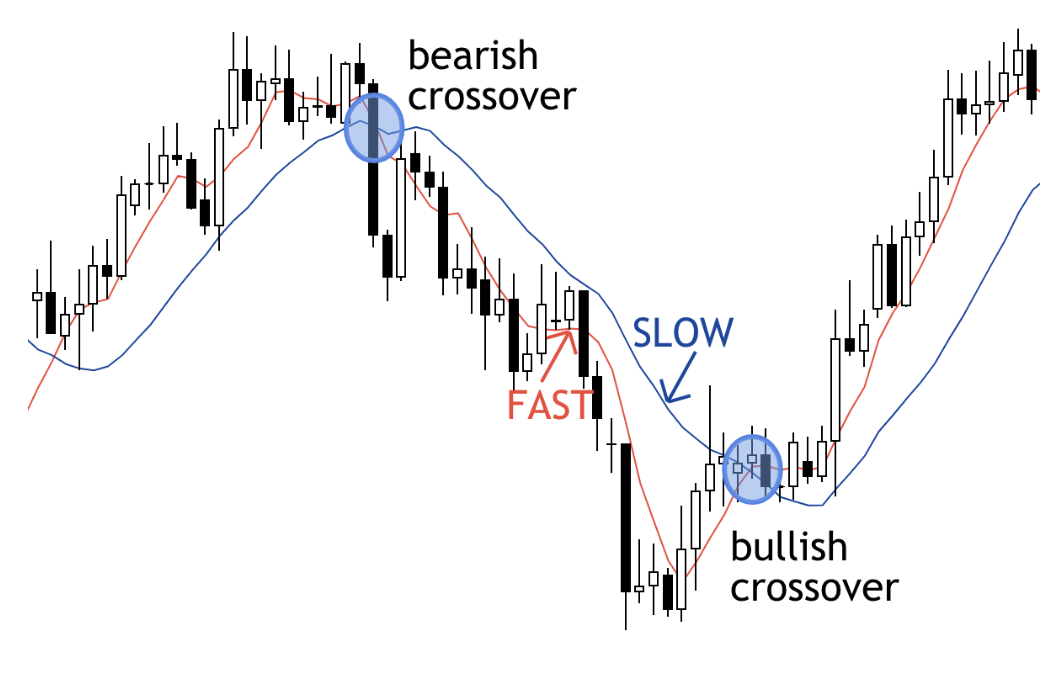
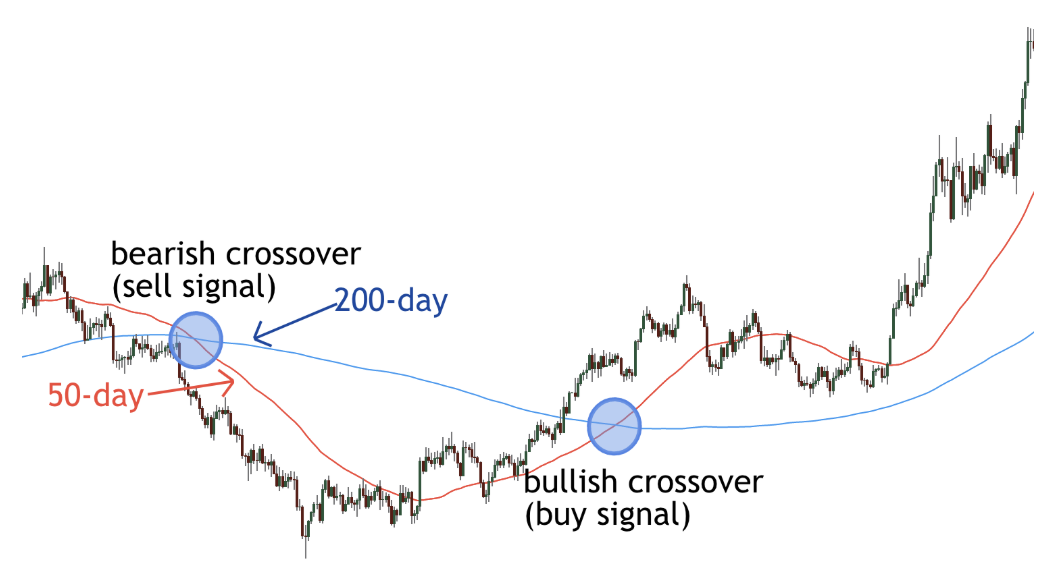
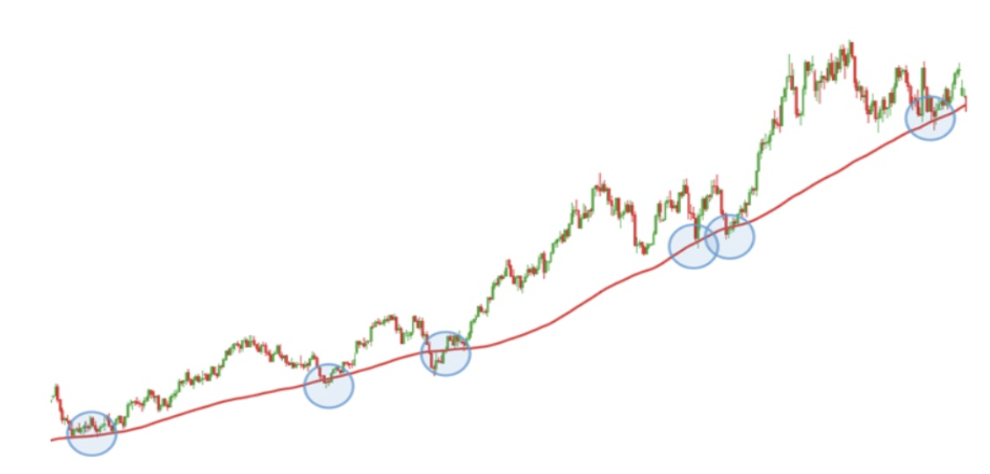
Moving averages smooth out the daily ups and downs of price action, revealing the underlying trend direction. The point where two moving averages cross creates potential trading signals.
For example, a simple day trading strategy might use a faster moving average (e.g., a 5-period Simple Moving Average (SMA)) and a slower moving average (e.g., a 20-period SMA). A buy signal is generated when the faster 5-period SMA crosses above the slower 20-period SMA, suggesting increased buying pressure. Conversely, a sell signal occurs when the faster SMA crosses below the slower SMA.
Adapting to Different Market Dynamics
Experienced traders adjust their moving average periods to fit different market conditions and their individual trading styles. Shorter periods (like 5 and 20) are more sensitive to recent price changes and work well for short-term trading. Longer periods (like 50 and 200) are less reactive to short-term fluctuations and are better for identifying longer-term trends. The best choice of periods depends on the trader’s preferred timeframe and the specific asset being traded.
Avoiding Common Pitfalls
Many traders give up on moving average crossover strategies too quickly because of normal market volatility. This is a big mistake! It’s important to understand that drawdowns are a normal part of trading. The challenge is to differentiate between expected market fluctuations and a true strategy failure. Proper risk management, which includes using stop-loss orders, is essential to protect your capital during these periods.
Optimizing Moving Average Settings
There’s no perfect combination of moving average periods that works for everyone. The best settings depend on the specific market and individual risk tolerance. Consider backtesting different moving average combinations on a platform like TradingView to understand what has historically performed well for a particular asset. This can provide valuable insights into how different settings perform in various market conditions.
Examples of Moving Average Combinations
To illustrate the performance of different SMA combinations, let’s examine the following table. It presents hypothetical results showcasing how various settings might perform in different market environments.
The following table provides a “Moving Average Crossover Performance Analysis”, showing real-world results from different SMA combination timeframes.
| MA Combination | Win Rate | Average Profit | Number of Trades | Market Conditions |
|---|---|---|---|---|
| 5/20 SMA | 55% | $150 | 100 | Trending |
| 10/50 SMA | 60% | $200 | 75 | Sideways |
| 50/200 SMA | 70% | $300 | 50 | Strong Trend |
As this table demonstrates, longer-term moving average combinations, like the 50/200 SMA, can yield higher average profits in strong trending markets, albeit with fewer trading opportunities. In contrast, shorter-term combinations, like the 5/20 SMA, might be better suited for choppier or trending markets, generating more frequent trades.
By understanding the nuances of moving average crossovers, day traders can build a robust and profitable simple day trading strategy tailored to their needs. Remember, simplicity and discipline are essential. The moving average crossover strategy, combined with strong risk management and careful market analysis, can provide traders with a path to consistent results in the market.
Transforming Historical Data Into Trading Confidence

Raw market data can feel overwhelming. However, within this sea of numbers lies the potential for significant trading advantages. This section explores how professional traders interpret historical price data to anticipate future market behavior and develop a simple day trading strategy. It’s a process that goes beyond simply glancing at charts; it’s about extracting actionable insights.
Backtesting for True Edge
Backtesting forms a core component of analyzing historical data. This process involves testing a trading strategy on past market data to gauge its potential performance. It’s important to understand, though, that the goal isn’t to create a strategy that perfectly mirrors historical data. This common pitfall is known as curve fitting. Instead, backtesting helps reveal a strategy’s true edge: its ability to generate consistent profits over time.
Identifying Profitable Metrics
Backtesting is instrumental in identifying specific metrics that distinguish truly profitable simple day trading strategies from those that simply appear successful in retrospect. Key metrics include the win rate (percentage of winning trades), the average win size compared to the average loss size, and the maximum drawdown (the largest percentage decline from peak to trough). Analyzing these metrics offers a more realistic evaluation of a strategy’s potential.
Historical data analysis also plays a crucial role in identifying recurring patterns. For instance, some stocks might consistently rebound after a specific percentage drop. By recognizing these patterns, traders can anticipate similar movements in the future. This approach merges the power of historical trends with real-time decision-making for improved outcomes.
Limitations of Historical Analysis
While crucial, historical analysis does have its limitations. Past performance doesn’t guarantee future results. Markets are dynamic and constantly evolve. What worked in the past may not work in the future. Therefore, depending solely on historical data can be risky.
Combining Historical and Forward Testing
To mitigate risk, traders combine historical analysis with forward testing, also known as paper trading. Forward testing applies a strategy to real-time market data without risking real capital. This simulates actual trading conditions, validating insights from historical analysis and allowing for strategy refinement before real money is deployed. For example, a trader might find through historical analysis that a particular moving average crossover strategy performs well. Forward testing allows them to observe the strategy’s performance in current market conditions and adjust parameters as needed.

Real-World Examples
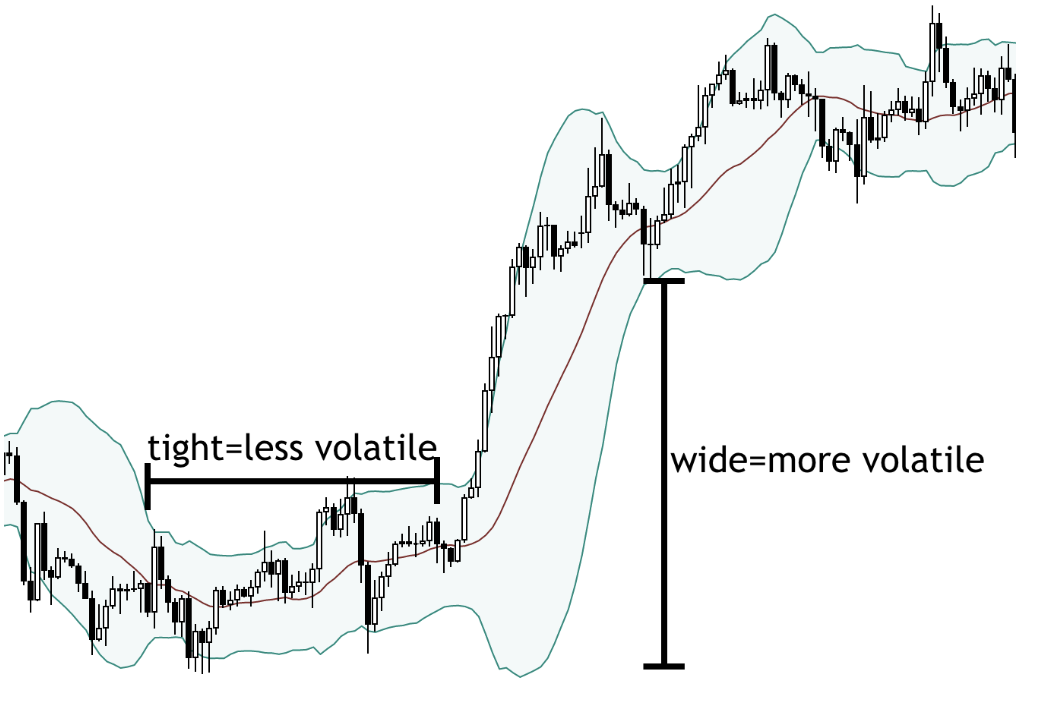
Successful traders leverage historical data to understand market cycles. They recognize that markets fluctuate through periods of high and low volatility, trending and sideways movements. By studying past cycles, they adapt their simple day trading strategies accordingly, understanding that a one-size-fits-all approach rarely works in the long run. This adaptability is a defining characteristic of professional traders. A simple day trading strategy that thrives in trending markets might require adjustments during periods of consolidation.
By combining rigorous backtesting, insightful metric analysis, and the knowledge gained from observing past market cycles, traders can transform raw historical data into a powerful tool. It builds trading confidence and forms the basis for consistent profitability. This thoughtful approach, combined with forward testing, allows traders to navigate the ever-shifting market dynamics and maintain a disciplined trading approach.
Risk Management: The Non-Negotiable Trading Superpower
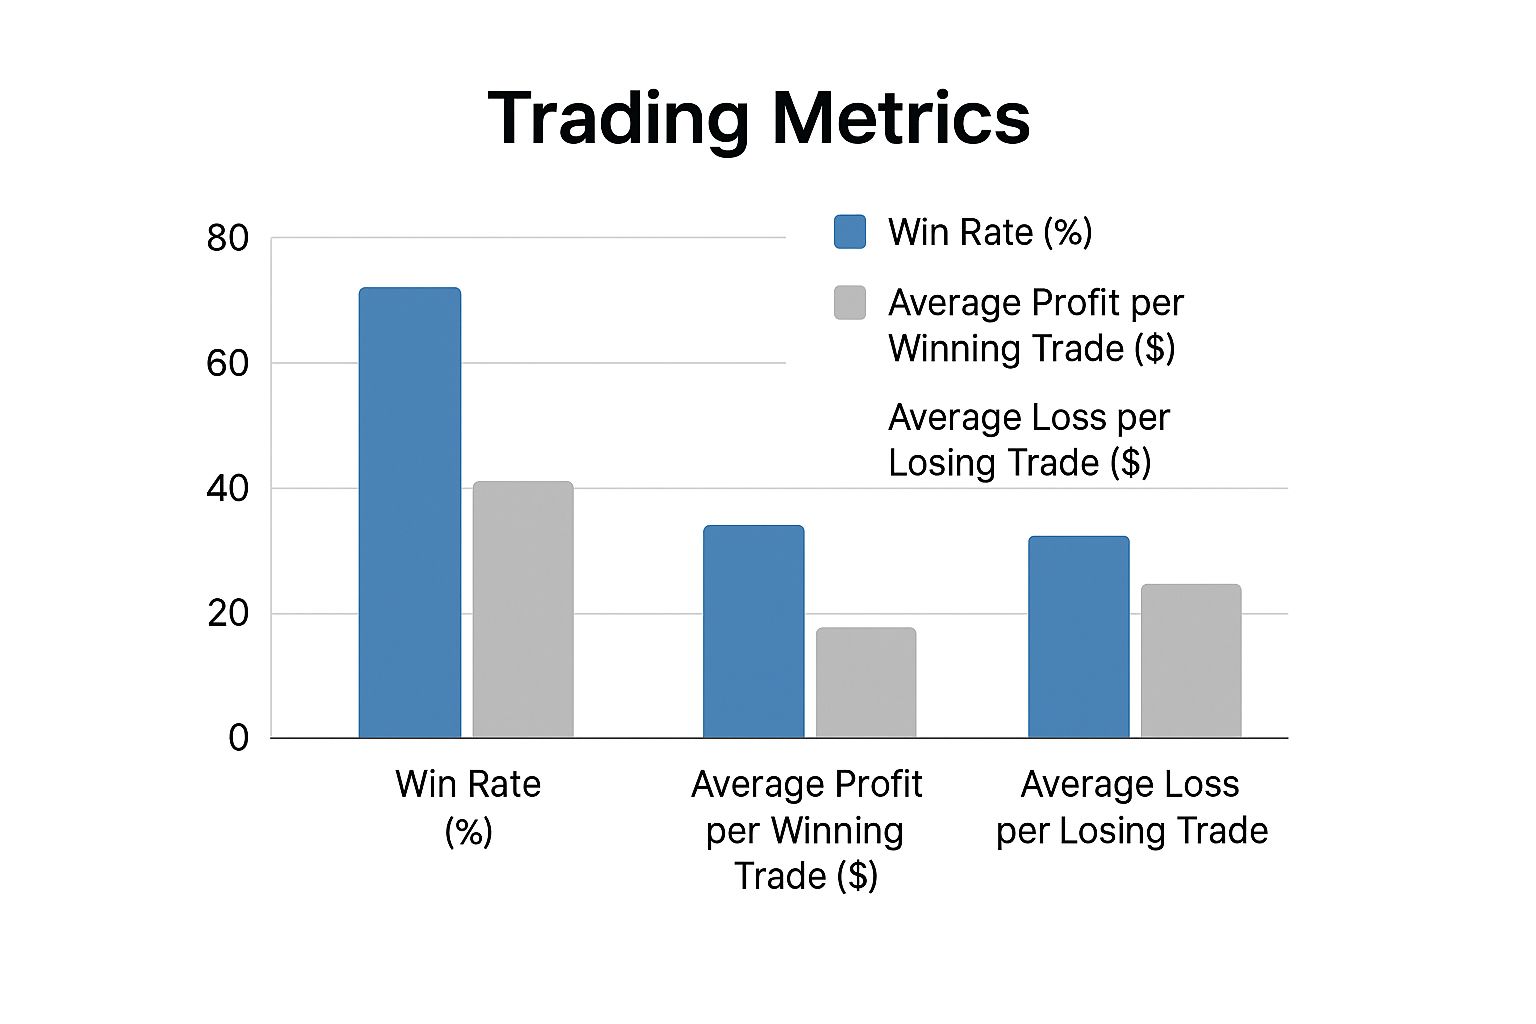
The infographic above illustrates a simple day trading strategy’s win rate, average profit, and average loss. Notice how profitability is achievable even with a win rate below 50%, as long as the average profit on winning trades surpasses the average loss on losing trades. This highlights the crucial role of a solid risk management plan.
Even with seemingly perfect entries and a robust strategy, success in day trading hinges on effective risk management. This isn’t mere theory. Seasoned traders consistently rank position sizing as a top priority, often exceeding the importance of the trading strategy itself. Position sizing focuses on allocating the right amount of capital to each trade, preventing catastrophic losses.
Position Sizing: Protecting Your Capital
Let’s illustrate with a $10,000 trading account. A 2% risk per trade translates to a $200 maximum loss per position. This measured approach safeguards your capital against inevitable losing streaks and curbs emotional trading spurred by the fear of substantial losses.
The Psychology of Risk Management
Risk management isn’t just about numbers; it’s intrinsically linked to trading psychology. One of the toughest challenges in trading is maintaining discipline during losing streaks, a natural part of the game. A well-defined risk management plan provides a structure for objective decisions, reducing impulsive, emotionally-driven trades. It helps traders sidestep the pitfalls of “revenge trading,” the urge to quickly recover losses through high-risk positions.
This underscores the importance of the reward-to-risk ratio, comparing potential profit to potential loss. A key statistic about simple day trading strategies reveals that while some achieve high win rates (around 63%), they involve many trades, potentially increasing transaction costs. Quantified Strategies provides further statistics on day trading. The focus on reward-to-risk allows profitability even with sub-50% win rates, given that average wins exceed average losses.
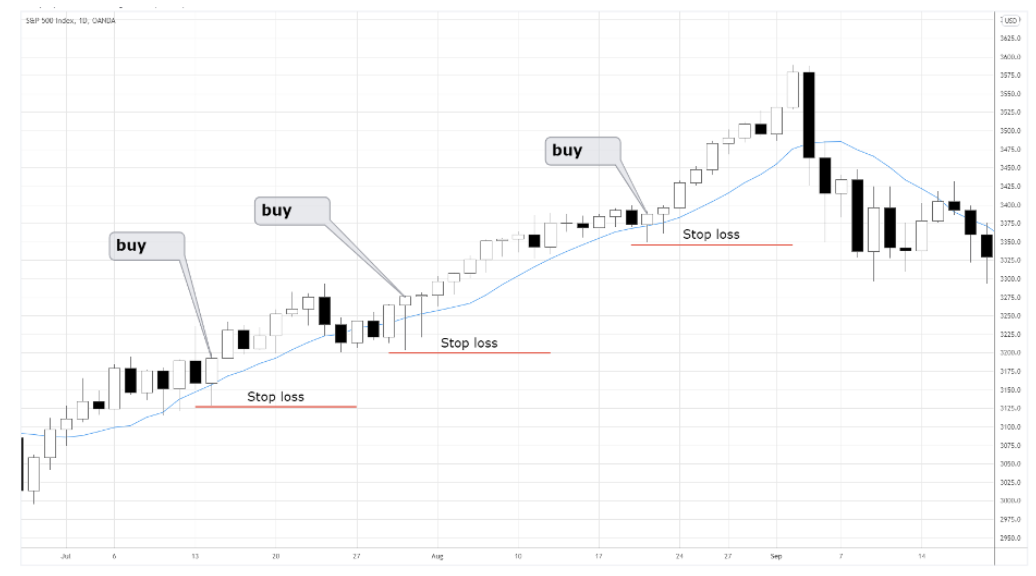
Stop-Loss Orders: Your Safety Net
A stop-loss order is a crucial risk management tool, automatically exiting a trade at a preset price level, limiting losses. Effective stop-loss placement balances protection with breathing room for the trade. Tight stops can lead to premature exits from normal fluctuations, while loose stops risk excessive losses.
Let’s look at a comparison of different risk management approaches and their impact:
Risk Management Approaches Compared
Performance impact of different risk control methodologies
| Risk Strategy | Max Drawdown | Recovery Time | Survival Rate | Long-term Profitability |
|---|---|---|---|---|
| Aggressive (High Risk) | High (e.g., 50%) | Long | Low | Potentially High, but also High Risk of Ruin |
| Moderate (Balanced) | Medium (e.g., 20%) | Moderate | Medium | Moderate |
| Conservative (Low Risk) | Low (e.g., 10%) | Short | High | Moderate to Low, but Consistent |
This table illustrates how different risk strategies affect trading outcomes. While aggressive strategies might offer higher potential profits, they carry a greater risk of significant losses. Conservative approaches prioritize capital preservation and improve long-term survival rates.
By mastering risk management principles, traders can convert simple strategies into sustainable, profitable approaches. It’s not solely about minimizing losses; it’s about cultivating confidence and resilience, preparing traders for market volatility. This shift from chasing wins to managing risk often distinguishes consistently profitable traders.
Price Action Mastery: Reading the Market’s True Language
Beneath the surface of complex indicators and algorithms lies the most fundamental language of the market: price action. Price action is simply the raw movement of price over time. This section explores how professional day traders filter out the noise and interpret this essential language, focusing on how they read price movements at key decision points.
Candlestick Patterns: Signals of Change
Candlestick patterns offer valuable visual clues about potential market reversals or continuations. Each candlestick represents a specific period, such as 5 minutes, 1 hour, or 1 day, recording the opening, closing, high, and low price for that period. Learning to recognize patterns like the hammer, shooting star, and doji can alert traders to potential shifts in momentum.
For example, a hammer candlestick, characterized by a long lower wick and a small body, often suggests a potential bullish reversal at the bottom of a downtrend. The long wick indicates that buyers stepped in aggressively after an initial price decline.
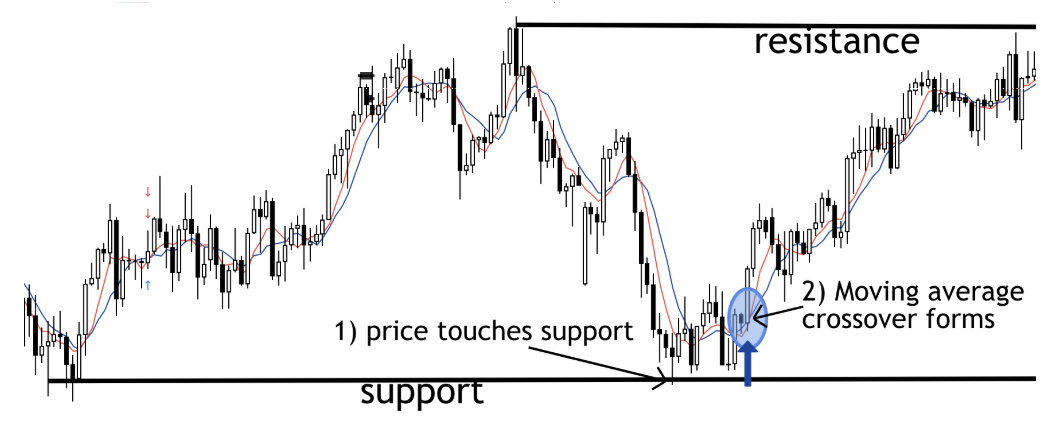
Support and Resistance Zones: Where the Big Money Acts
Support and resistance zones are price levels where the market has historically struggled to break through. These zones represent areas where substantial buying or selling pressure enters the market. Understanding these zones is essential for any simple day trading strategy.
Identifying these zones isn’t an exact science; it’s more about recognizing a range. Think of support as a trampoline, preventing the price from falling further. Resistance acts like a ceiling, restricting upward movement.
Volume Confirmation: Turning Clues Into Convictions
Volume measures the number of shares or contracts traded within a given period. It acts as a confirmation tool for price action signals. High volume accompanying a breakout from a support or resistance zone strengthens the signal, increasing the likelihood of a sustained move.
A breakout from a resistance zone with high volume, for instance, suggests genuine buyer interest, while a low-volume breakout might signal a false move, often called a “fakeout.”
Spotting Subtle Clues in Price
Learning to interpret subtle price action nuances, such as the speed and magnitude of price movements, can give traders an edge in anticipating market direction. A swift, high-volume price spike can indicate strong momentum, while slow, choppy price action often suggests market uncertainty.
These observations allow traders to position themselves ahead of major market moves. Rather than reacting to past price action, they anticipate future movements. This proactive approach, combined with a well-defined day trading strategy, can greatly improve trading outcomes. Recognizing support and resistance, candlestick patterns, and incorporating volume confirmation allows traders to develop a framework for spotting high-probability trading setups. By mastering this “language” of the market, traders gain a significant advantage in the dynamic world of day trading.
Your Day Trading Workflow: From Preparation to Profit
A successful simple day trading strategy relies on consistent execution, not sporadic wins. This section outlines the daily routine of profitable day traders, from pre-market analysis to the closing bell. We’ll explore how to structure your day for optimal performance and build habits that lead to consistent gains.
Pre-Market Preparation: Setting the Stage for Success
Before the market opens, successful day traders dedicate time to pre-market analysis. This involves scanning for potential trading opportunities based on news, economic data releases, and pre-market price action. Identifying stocks with significant price changes or unusual volume can offer early insights into potential day trading setups. This preparation sets the stage for a focused and productive trading day.
Developing a Personalized Trading Plan
A well-defined trading plan is essential for any aspiring day trader. It acts as a roadmap, outlining your chosen simple day trading strategy, risk parameters, and performance goals. Your plan should clearly define your entry and exit rules. These could be based on price action, technical indicators, or other market signals. It should also establish your risk tolerance, defining the maximum capital you’re willing to risk on each trade.
Maintaining Focus During Market Hours
The active trading day demands intense focus and discipline. Minimizing distractions is key. A dedicated workspace free from interruptions can significantly improve concentration and decision-making. This means silencing notifications, limiting social media, and creating a focused environment. This dedicated approach helps maintain the mental clarity needed for effective execution.
Trade Journaling: Turning Mistakes into Learning Opportunities
Trade journaling is a powerful tool for continuous improvement. Record your trades, including entry and exit points, your rationale, and your emotional state. This helps identify recurring patterns and areas for improvement. Regular journal review can reveal valuable insights into your trading performance. You can understand which setups work best and which to avoid. Through consistent journaling, mistakes become valuable learning opportunities.
Identifying Optimal Trading Windows
Not all market hours are created equal. Market volatility fluctuates throughout the day. Identify your peak performance times, when you are most alert and focused. Aligning these with periods of higher market activity can significantly improve your trading outcomes. Some traders perform best during the opening hour, while others excel in specific afternoon sessions. Recognizing these patterns optimizes your trading schedule.
Managing Technology and Emotions
Technology is vital in day trading. A reliable internet connection, backup power supply, and a robust trading platform are crucial. Equally important is managing your emotions. Day trading can be emotionally challenging. Drawdowns, periods of losing trades, are inevitable. Develop coping mechanisms, such as taking breaks or practicing mindfulness. This can help maintain composure and make rational decisions, even under pressure.
Knowing When to Stop
Knowing when to stop is key to successful trading. Setting daily profit targets and loss limits is crucial. Reaching your daily profit target signals the end of your trading day. Similarly, reaching your loss limit requires stepping away to avoid emotional trading and further losses. This disciplined approach protects your capital and prevents emotional decision-making.
By incorporating these practices, you transform your simple day trading strategy into a sustainable and consistently profitable approach. It’s a process of continuous learning and adaptation, emphasizing discipline, risk management, and understanding your personal trading style. This structured approach sets the foundation for long-term success.
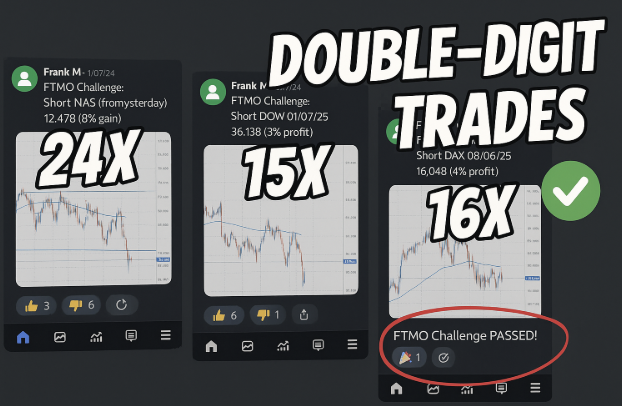
Ready to transform your trading potential? Check out the day trading program- learn how to make $1,000 or more by risking only $100 per trade even if you have never traded before. Learn the Double-Digits day trading program now to pass challenges or trade on your own account